149
145
153
153
153
152
145
164
143
170
175
148
174
171
156
166
168
152
150
173
168
146
155
172
159
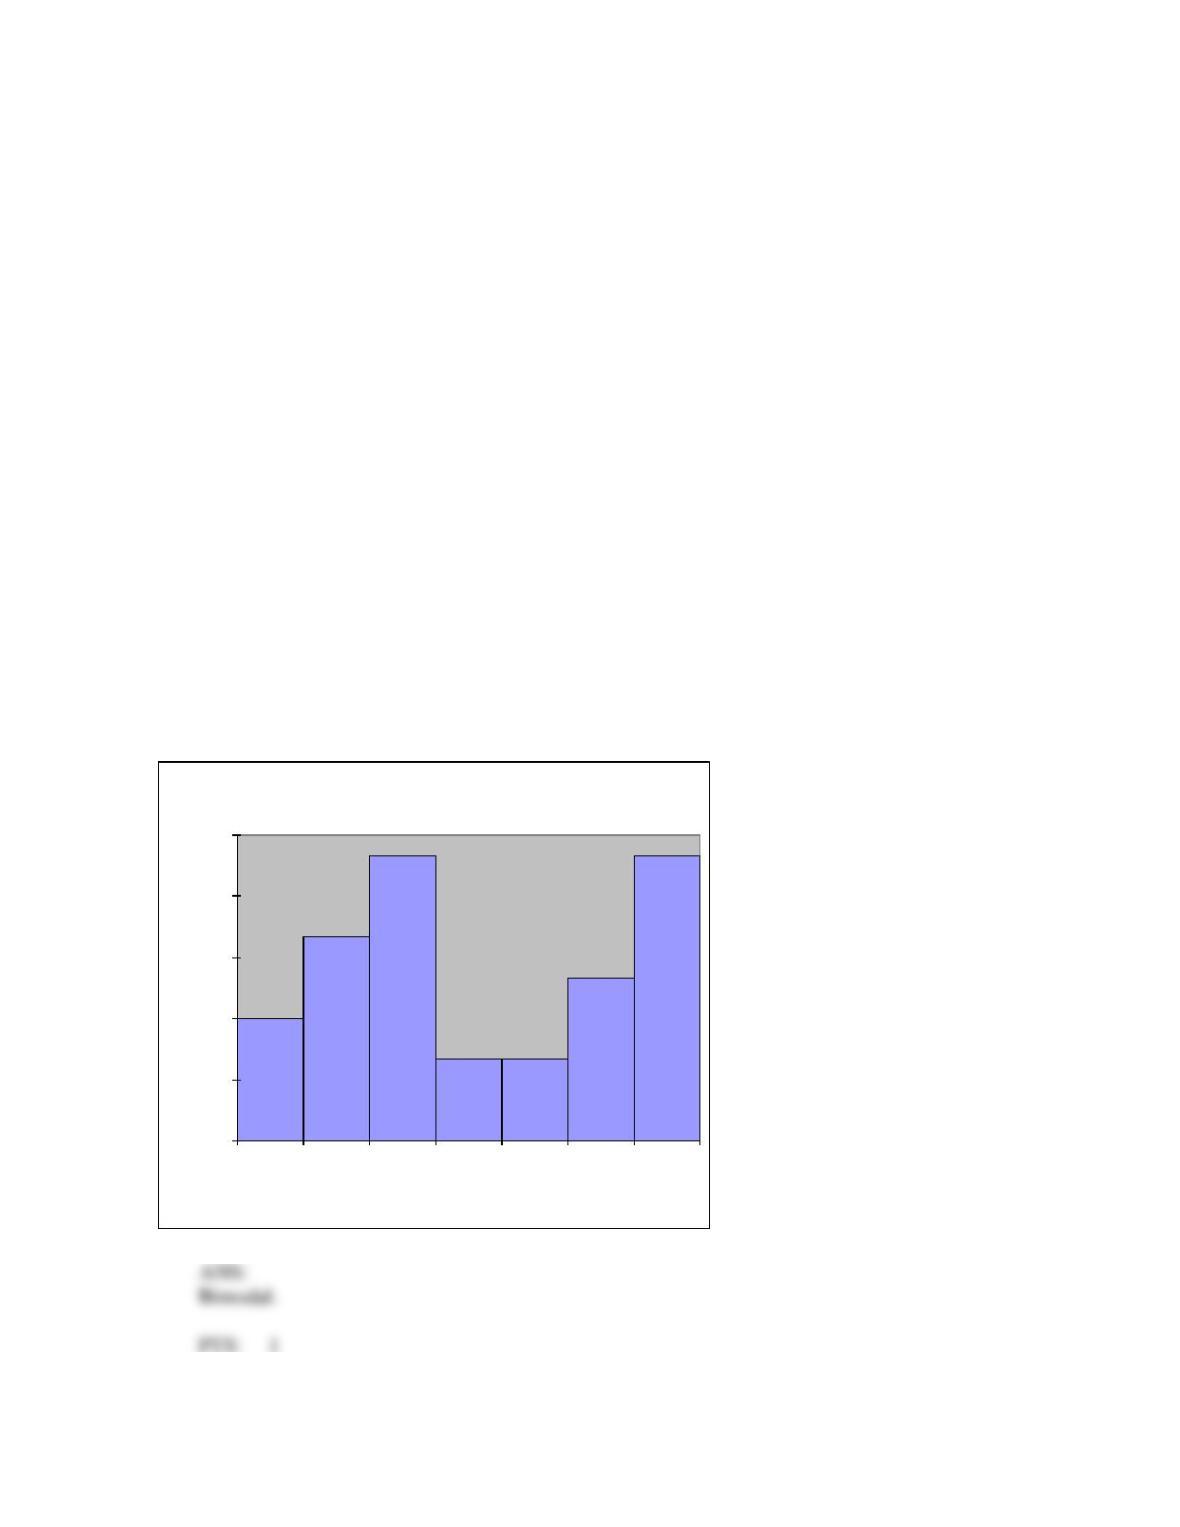
Is the following histogram constructed from the weight data unimodal, bimodal or multimodal?
Histogram
0%
5%
10%
15%
20%
25%
140 to
145
145 to
150
150 to
155
155 to
160
160 to
165
165 to
170
170 to
175
Weight
Relative Frequency

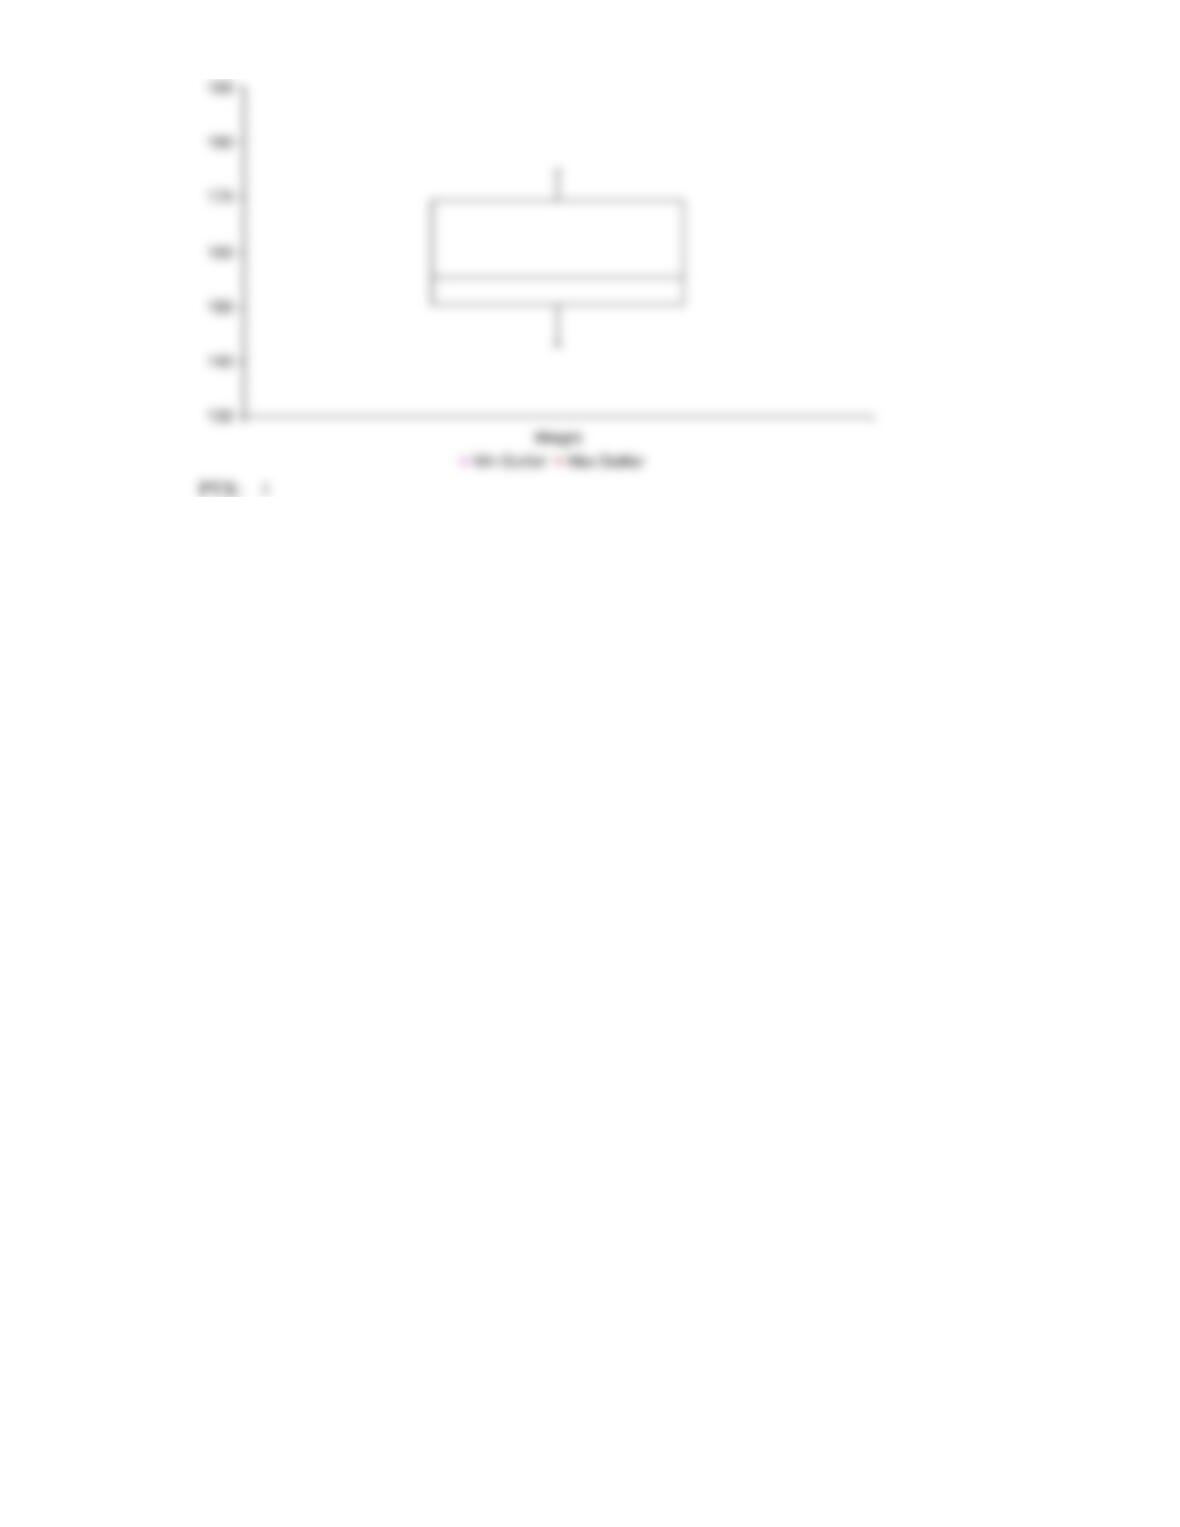
19. The following data represent the weights (in kilograms) of a sample of 30 horses:
Weight
165
175
150
155
173
149
145
153
153
153
152
145
164
143
170
175
148
174
171
156
166
168
152
150
173
168
146
155
172
159
Construct a box plot for the weights.
20. The following data represent the weights (in kilograms) of a sample of 30 horses:
Weight
165
175
150
155
173
149
145
153
153
153
152
145
164
143
170
175
148
174
171
156
166
168
152
150
173
168
146
155
172
159
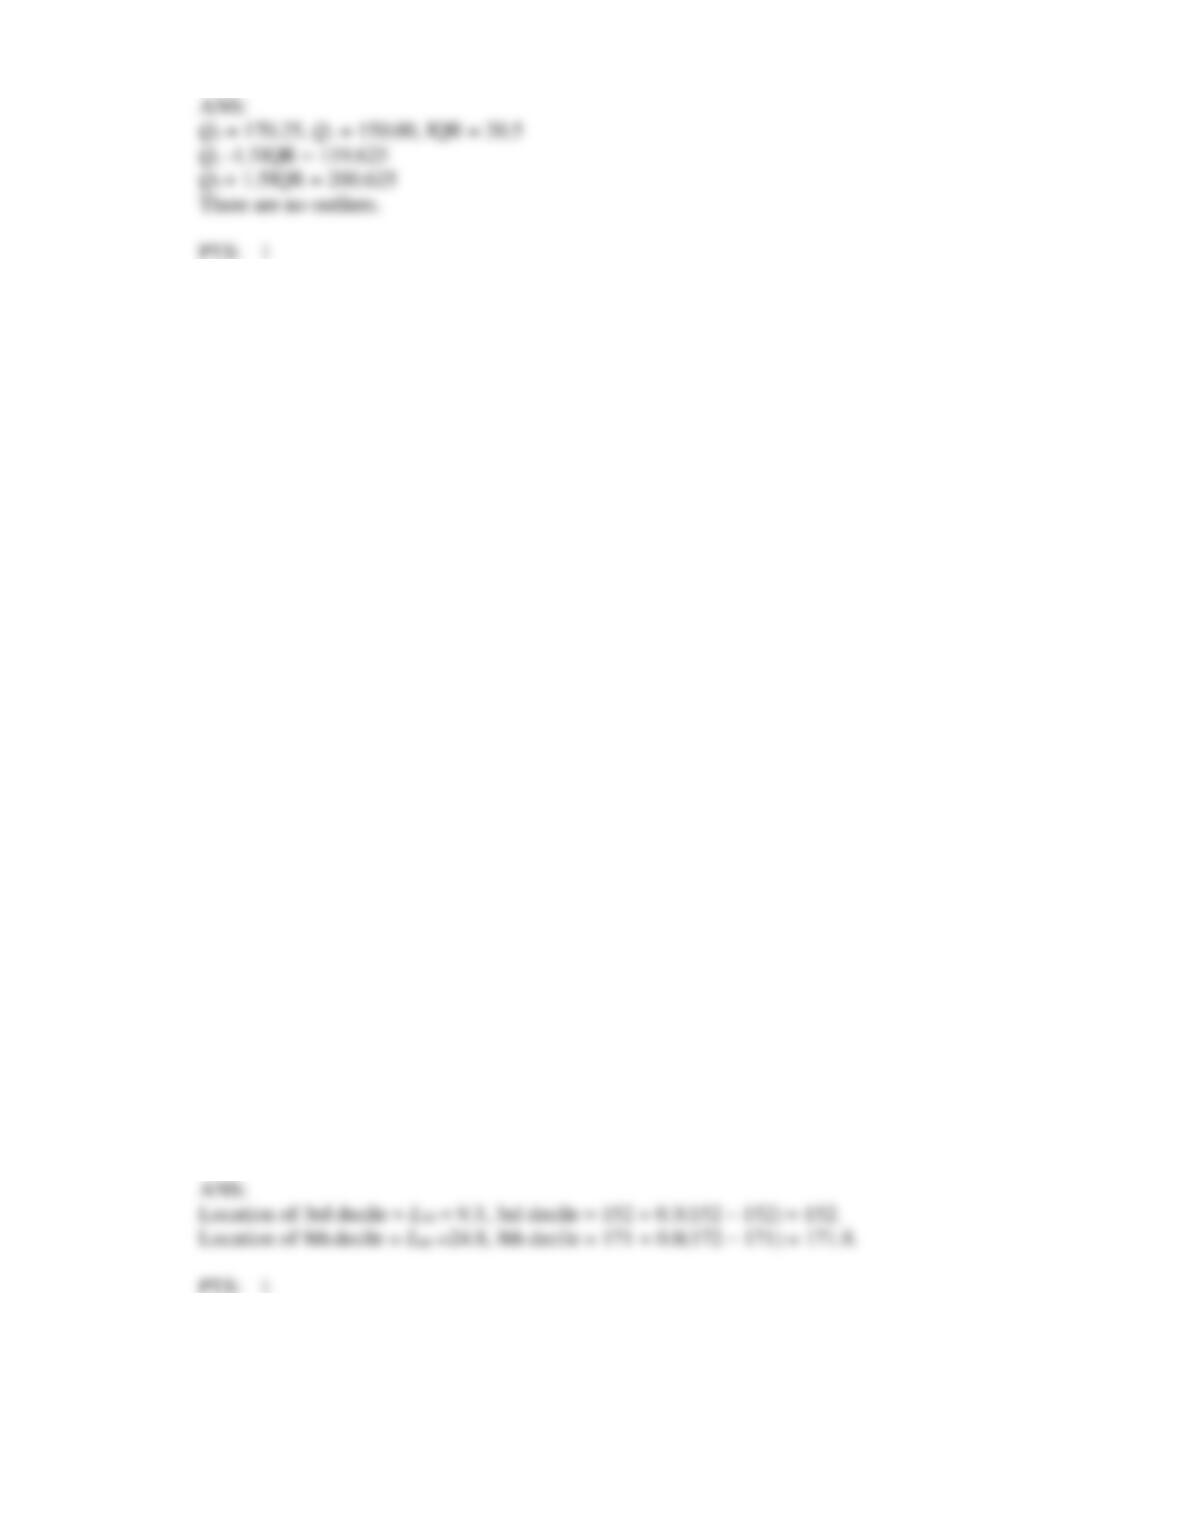
Are there any outliers?
21. The following data represent the weights (in kilograms) of a sample of 30 horses:
Weight
165
175
150
155
173
149
145
153
153
153
152
145
164
143
170
175
148
174
171
156
166
168
152
150
173
168
146
155
172
159
Calculate the 3rd and 8th deciles of the data.
22. When is the standard deviation of a data set smaller than its variance? Explain.
23. Data from three samples are shown below:
Sample A:
17
22
20
18
23
Sample B:
30
28
35
40
25
Sample C:
44
39
54
21
52
Examine the three samples. Without performing any calculations, indicate which sample has the
greatest amount of variability and which sample has the least amount of variability.
24. Data from three samples are shown below:
Sample A:
17
22
20
18
23
Sample B:
30
28
35
40
25
Sample C:
44
39
54
21
52
Calculate for the three samples. What can you infer about this calculation in general?
Data from three samples are shown below:
Sample A:
17
22
20
18
23
Sample B:
30
28
35
40
25
Sample C:
44
39
54
21
52
25. Data from three samples are shown below:
Sample A:
17
22
20
18
23
Sample B:
30
28
35
40
25
Sample C:
44
39
54
21
52
Calculate the variance and the range for the three samples.
26. The following data provide the hours of television viewing per week for a sample of 15 high school
students in Darwin:
5
11
25
19
18
20
27
13
8
10
15
19
8
9
12
a. Determine the locations and values of the first, second and third quartiles.
b. Calculate the interquartile range.
c. Interpret the value of the interquartile range.
27. The number of hours a college student spent studying during the final exam week was recorded as
follows:
7
6
4
9
8
5
10
Compute the range, x, s2 and s for these data. Express each number in appropriate units.
28. The annual percentage rates of return over the past 10 years for two mutual funds are as follows:
Fund A:
7.1
–7.4
19.7
–3.9
32.4
41.7
23.2
4.0
1.9
29.3
Fund B:
10.8
–4.1
5.1
10.9
26.5
24.0
16.9
9.4
–2.6
10.1
Which fund would you classify as having the higher level of risk?
29. The following data represent the ages (in years) of a sample of 25 employees from a government
department:
31
43
56
23
49
42
33
61
44
28
48
38
44
35
40
64
52
42
47
39
53
27
36
35
20
Construct a stem-and-leaf display for the ages.
30. The following data represent the ages (in years) of a sample of 25 employees from a government
department:
31
43
56
23
49
42
33
61
44
28
48
38
44
35
40
64
52
42
47
39
53
27
36
35
20
Find the median age.
31. The following data represent the ages (in years) of a sample of 25 employees from a government
department:
31
43
56
23
49
42
33
61
44
28
48
38
44
35
40
64
52
42
47
39
53
27
36
35
20
Find the lower quartile of the ages.
32. The following data represent the ages (in years) of a sample of 25 employees from a government
department:
31
43
56
23
49
42
33
61
44
28
48
38
44
35
40
64
52
42
47
39
53
27
36
35
20
Find the upper quartile of the ages.
33. The following data represent the ages (in years) of a sample of 25 employees from a government
department:
31
43
56
23
49
42
33
61
44
28
48
38
44
35
40
64
52
42
47
39
53
27
36
35
20
Find the 60th percentile of the ages.
34. The following data represent the ages (in years) of a sample of 25 employees from a government
department:
31
43
56
23
49
42
33
61
44
28
48
38
44
35
40
64
52
42
47
39
53
27
36
35
20
Compute the range and interquartile range of the data.
35.
The following data represent the ages (in years) of a sample of 25 employees from a government
department:
31
43
56
23
49
42
33
61
44
28
48
38
44
35
40
64
52
42
47
39
53
27
36
35
20
Compute the sample mean age.
36. The following data represent the ages (in years) of a sample of 25 employees from a government
department:
31
43
56
23
49
42
33
61
44
28
48
38
44
35
40
64
52
42
47
39
53
27
36
35
20
Compute the sample variance and sample standard deviation.
37. The following data represent the ages (in years) of a sample of 25 employees from a government
department:
31
43
56
23
49
42
33
61
44
28
48
38
44
35
40
64
52
42
47
39
53
27
36
35
20
Compute the range approximation to the standard deviation of the data. (Hint: S Range)
38. The following data represent the ages (in years) of a sample of 25 employees from a government
department:
31
43
56
23
49
42
33
61
44
28
48
38
44
35
40
64
52
42
47
39
53
27
36
35
20
Calculate the 4th decile of the data.
39. The following data represent the ages (in years) of a sample of 25 employees from a government
department:
31
43
56
23
49
42
33
61
44
28
48
38
44
35
40
64
52
42
47
39
53
27
36
35
20
Compute the 8th decile of the data.
40. The following data represent the ages (in years) of a sample of 25 employees from a government
department:
31
43
56
23
49
42
33
61
44
28
48
38
44
35
40
64
52
42
47
39
53
27
36
35
20
Calculate the 1st quintile. (Hint: 1st quintile is L20)
41. The following data represent the ages (in years) of a sample of 25 employees from a government
department:
31
43
56
23
49
42
33
61
44
28
48
38
44
35
40
64
52
42
47
39
53
27
36
35
20
Calculate the 2nd quintile. (Hint: 2nd quintile is L40.)
42. The following data represent the ages (in years) of a sample of 25 employees from a government
department:
31
43
56
23
49
42
33
61
44
28
48
38
44
35
40
64
52
42
47
39
53
27
36
35
20
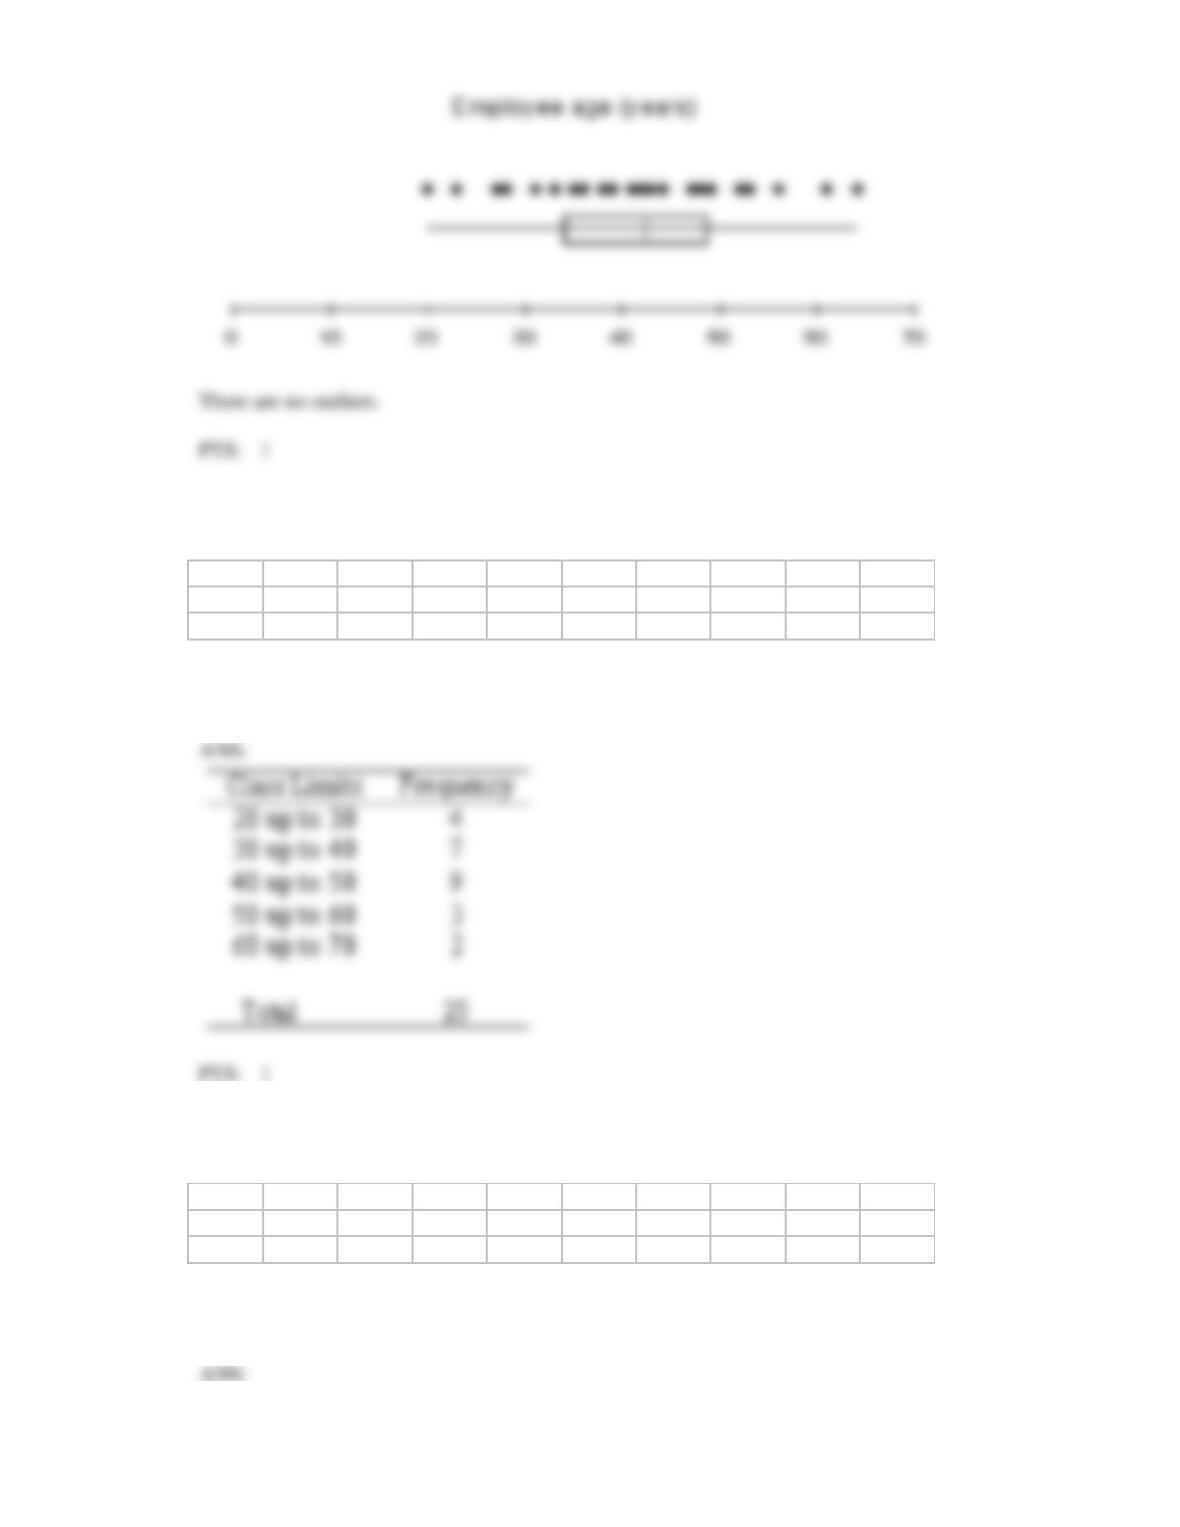
Construct a box plot for the age data and identify any outliers.
43. The following data represent the ages (in years) of a sample of 25 employees from a government
department:
31
43
56
23
49
42
33
61
44
28
48
38
44
35
40
64
52
42
47
39
53
27
36
35
20
Construct a frequency distribution for the data, using five class intervals and the value 20 as the lower
limit of the first class.
44. The following data represent the ages (in years) of a sample of 25 employees from a government
department:
31
43
56
23
49
42
33
61
44
28
48
38
44
35
40
64
52
42
47
39
53
27
36
35
20
Construct a relative frequency distribution for the data, using five class intervals and the value 20 as
the lower limit of the first class.