16.
Data Set 1
The following data are test grades for a university business statistics class.
63
74
42
65
51
54
36
56
68
57
62
64
76
67
79
61
81
77
59
38
84
68
71
94
71
86
69
75
91
55
48
82
83
54
79
62
68
58
41
47
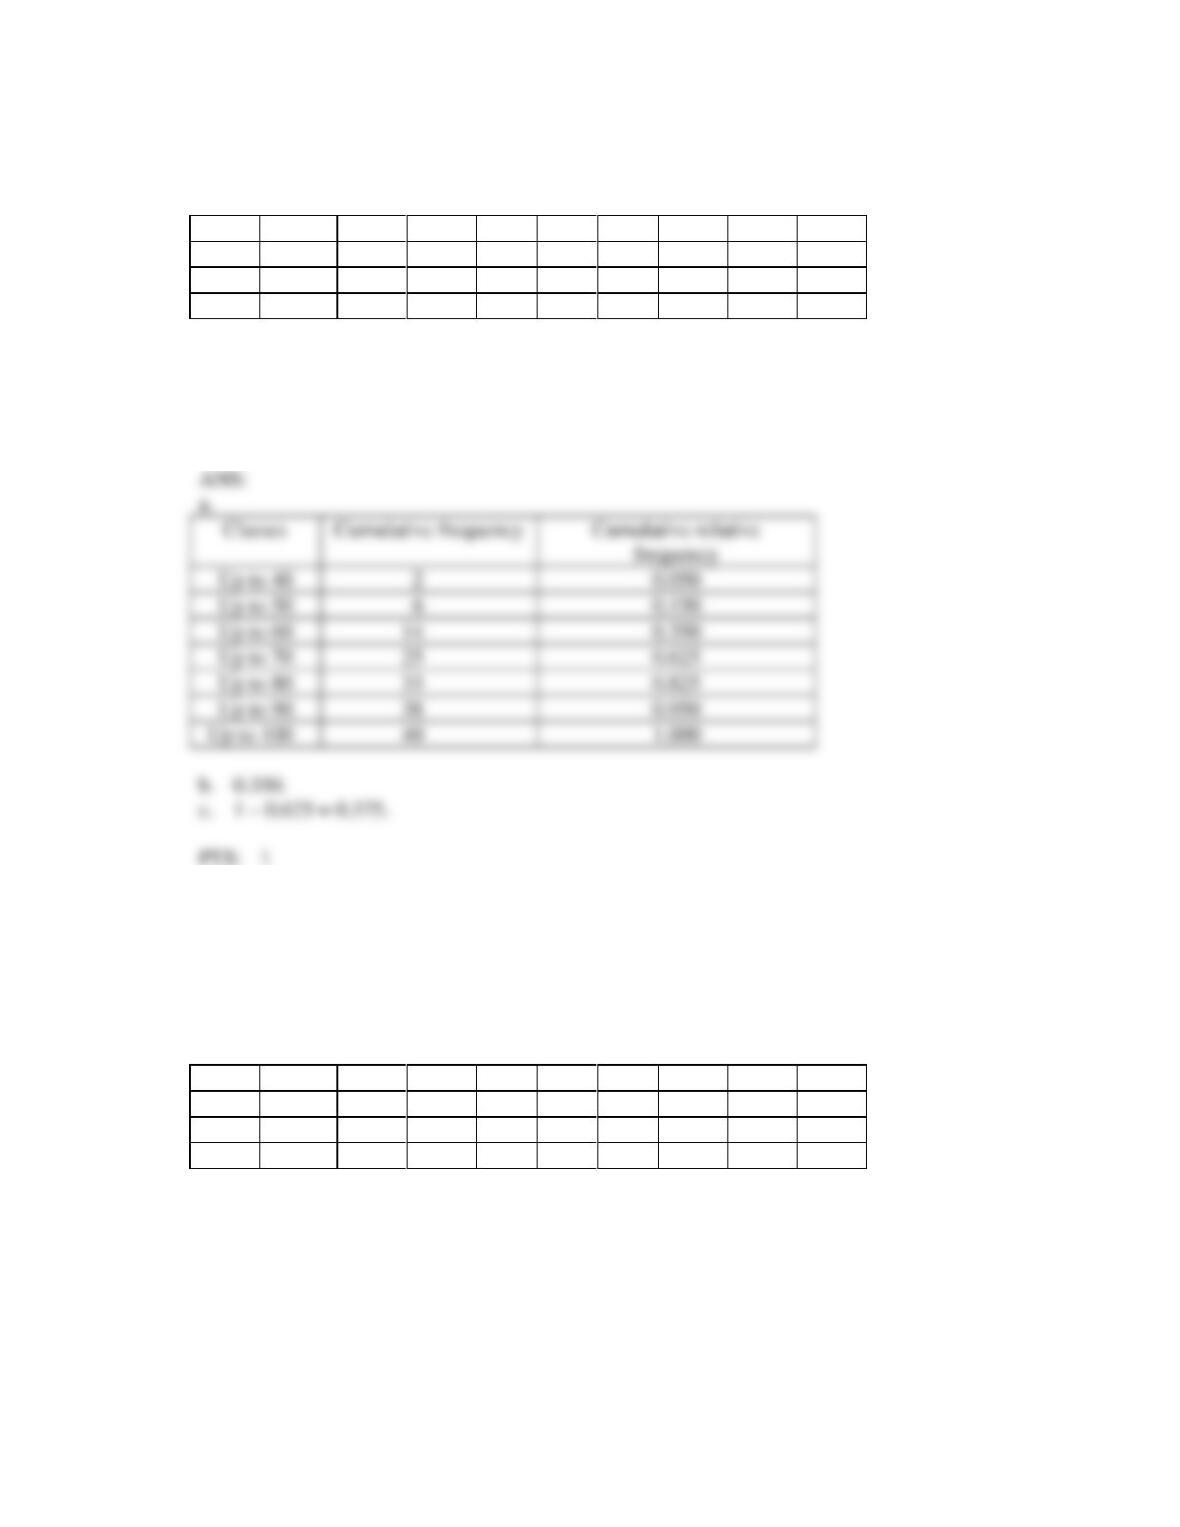
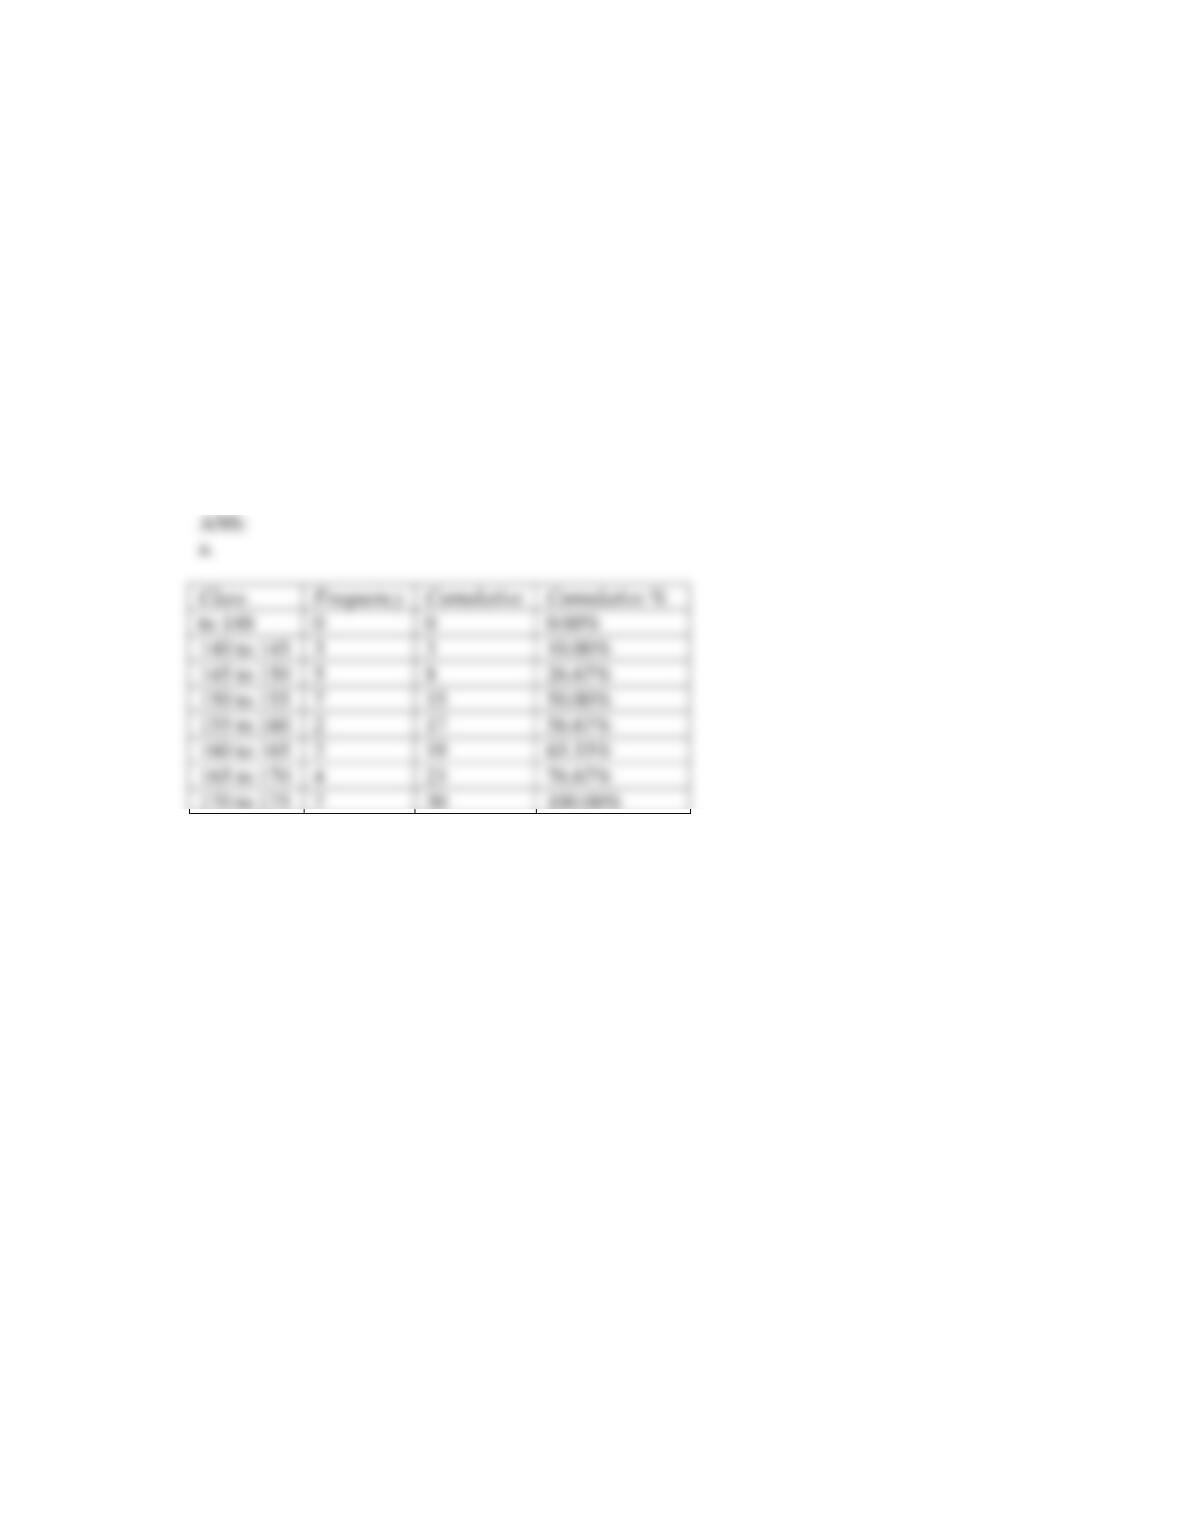
a. Construct a cumulative frequency distribution and a cumulative relative frequency distribution for
the data in Data Set 1 above.
b. What proportion of the grades is less than 60?
c. What proportion of the grades is more than 70?
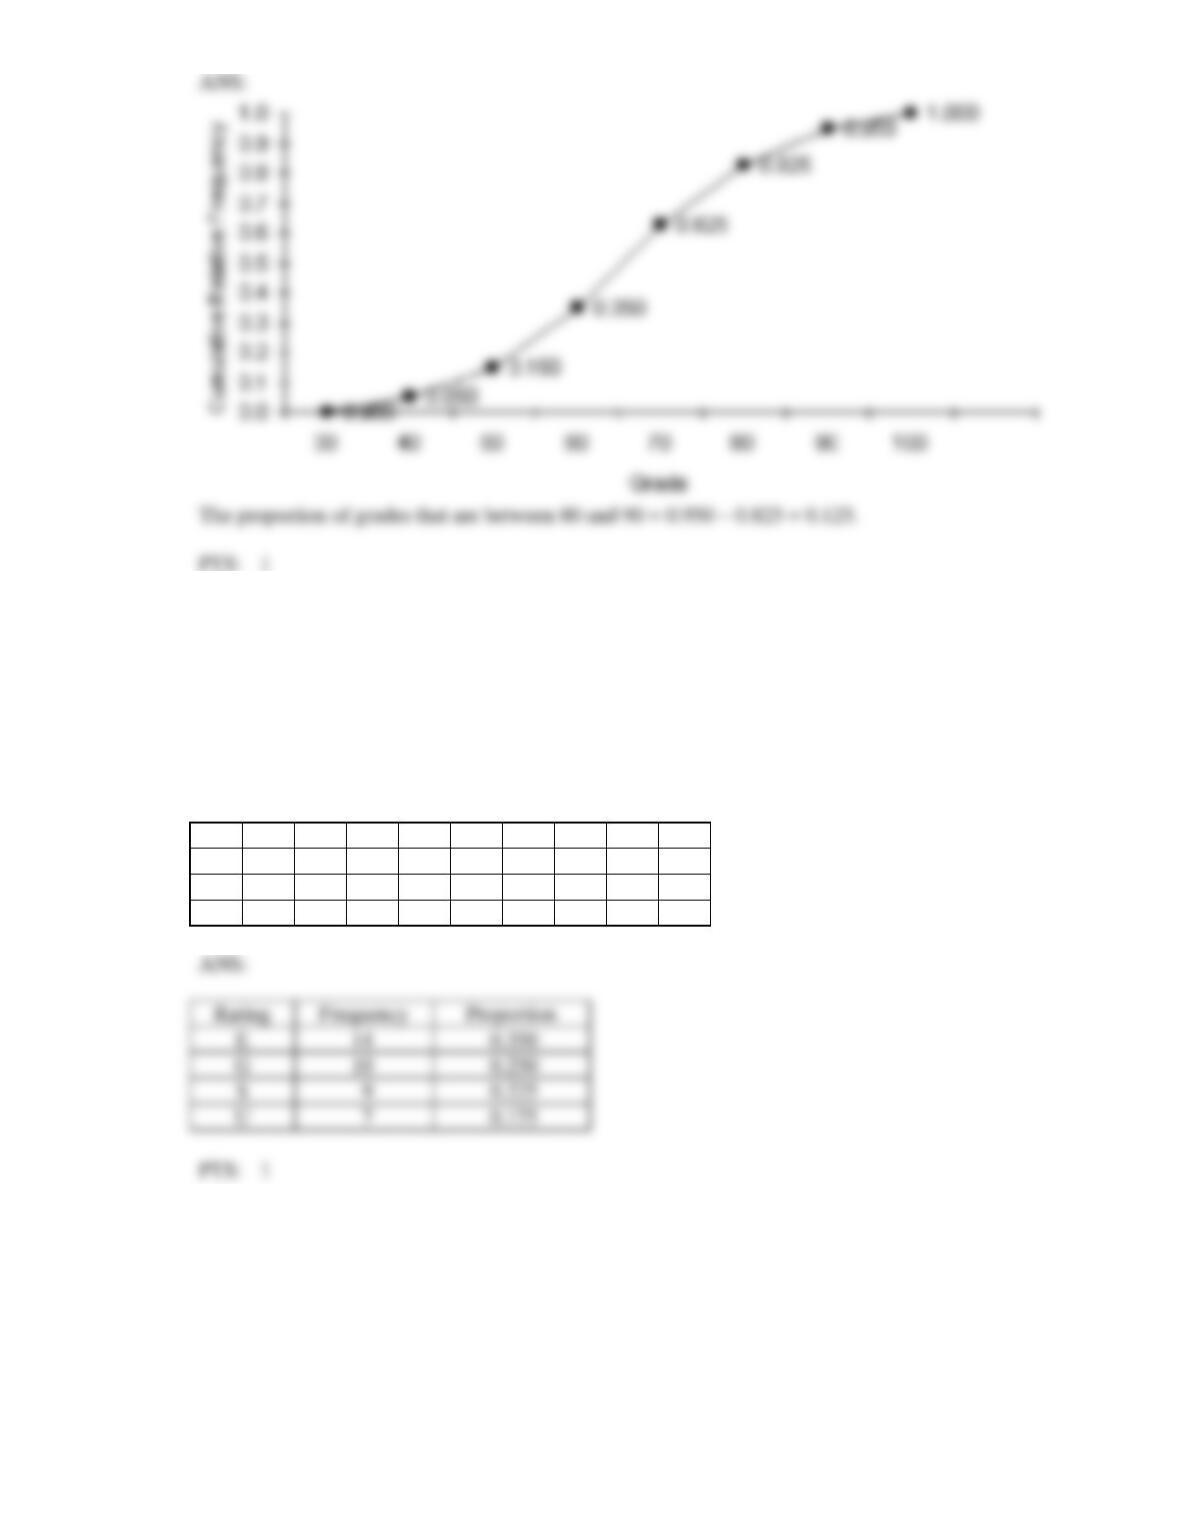
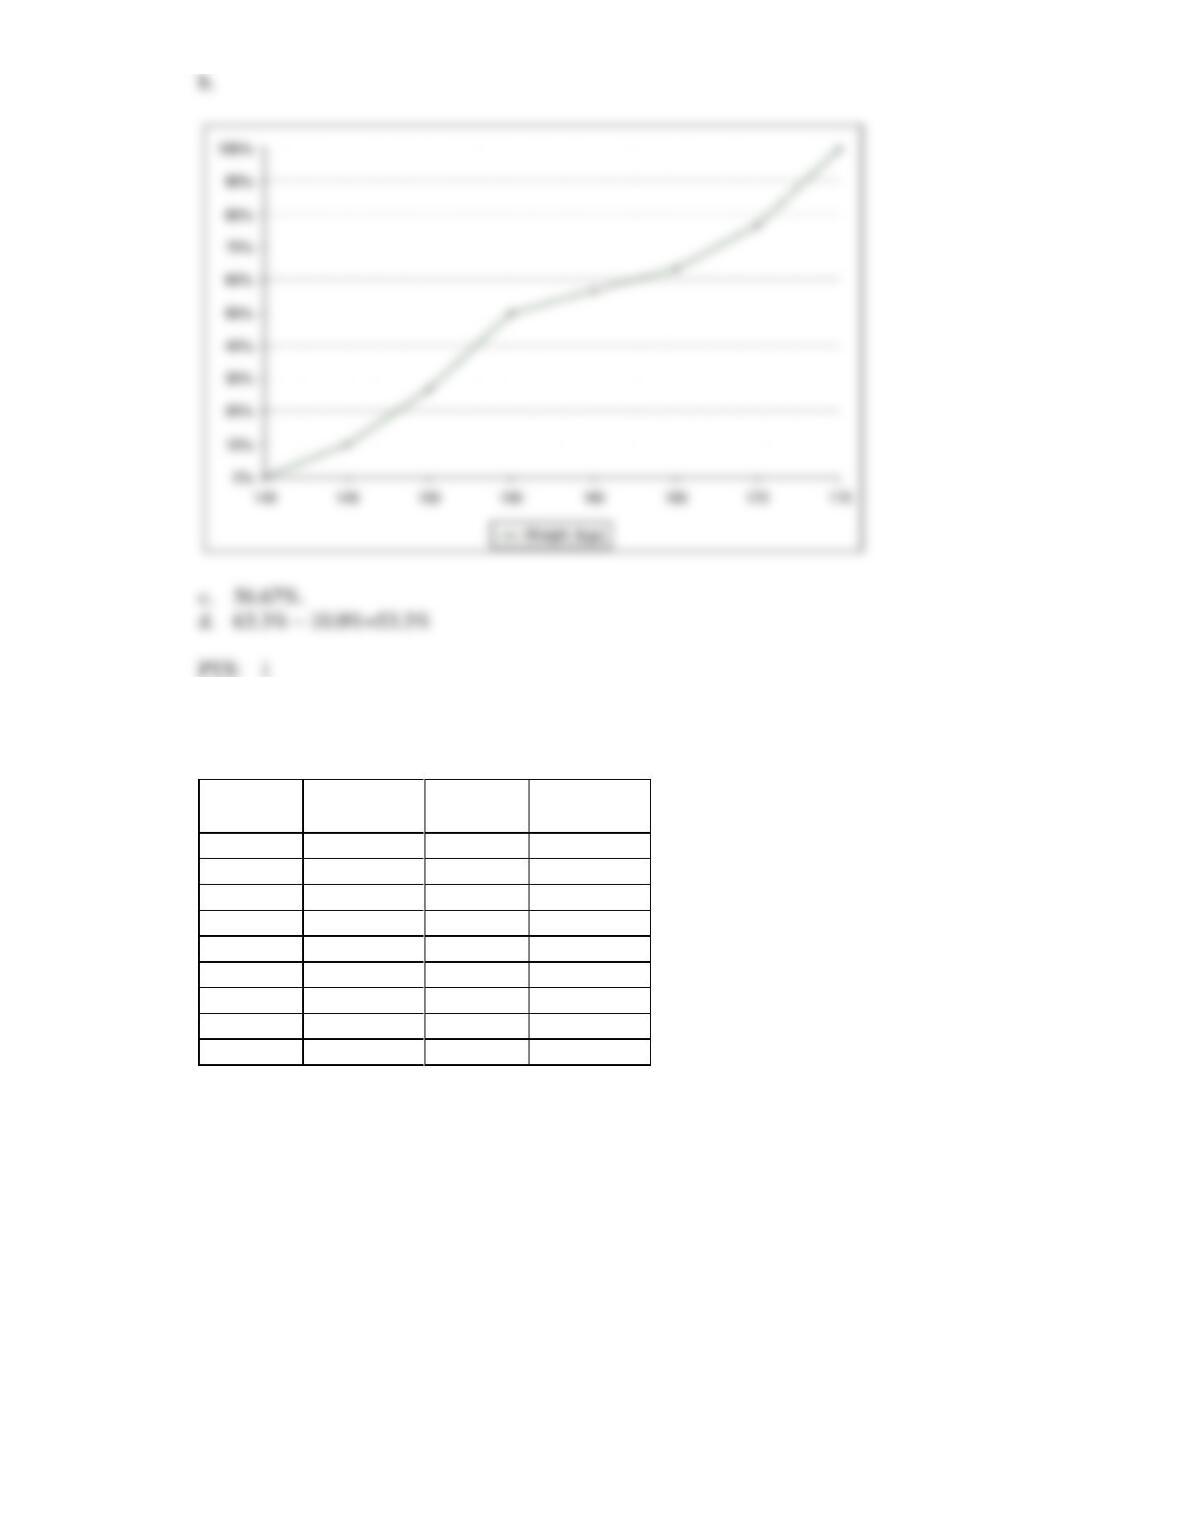
17. Construct an ogive for the data in Data Set 1, and estimate the proportion of grades that are between 80
and 90.
Data Set 1
The following data are test grades for a university business statistics class.
63
74
42
65
51
54
36
56
68
57
62
64
76
67
79
61
81
77
59
38
84
68
71
94
71
86
69
75
91
55
48
82
83
54
79
62
68
58
41
47
18. Construct a frequency distribution and a proportion distribution for the data in Data Set 2.
Data Set 2
Car buyers were asked by a car dealer to rate their level of satisfaction with the service they had
received. The four ratings were Excellent (E), Good (G), Satisfactory (S) and Unsatisfactory (U). The
following data were obtained.
S
E
E
E
U
E
G
S
E
U
U
G
E
G
S
E
G
G
E
G
S
E
E
S
U
G
G
E
E
S
S
U
E
U
S
G
G
E
U
S
19. Construct a frequency bar chart for the data in Data Set 2.
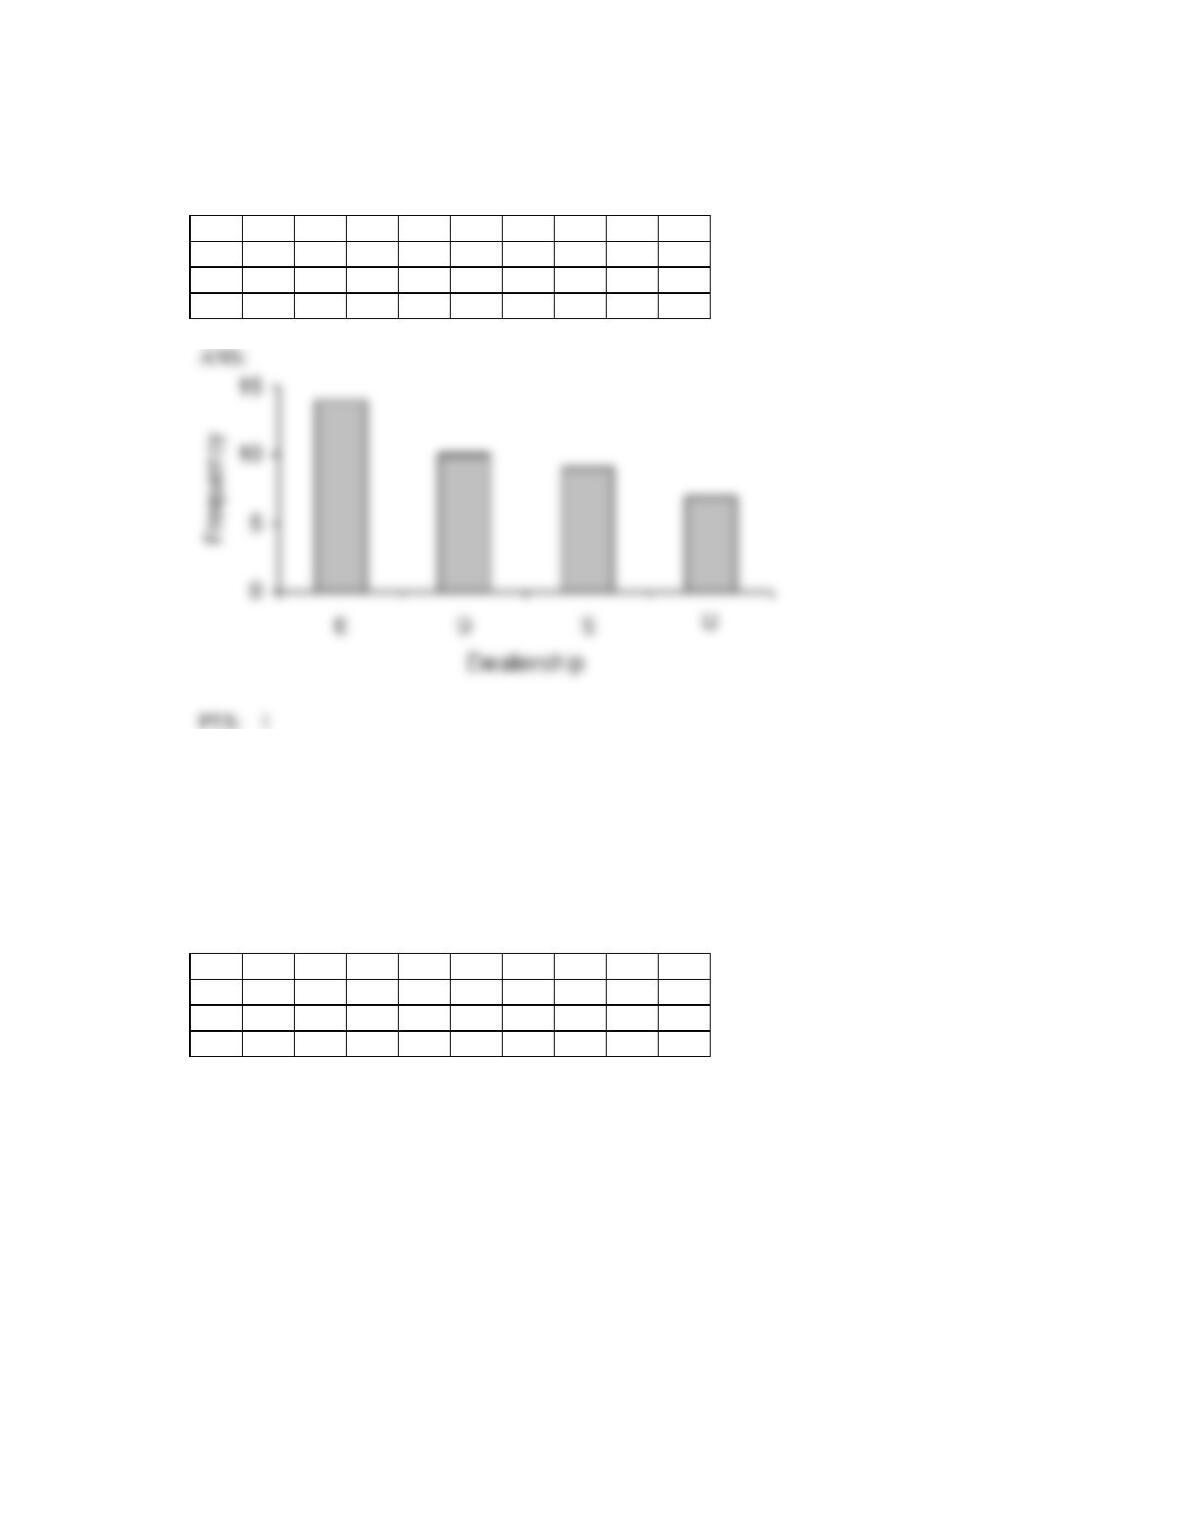
Data Set 2
Car buyers were asked by a car dealer to rate their level of satisfaction with the service they had
received. The four ratings were Excellent (E), Good (G), Satisfactory (S) and Unsatisfactory (U). The
following data were obtained.
S
E
E
E
U
E
G
S
E
U
U
G
E
G
S
E
G
G
E
G
S
E
E
S
U
G
G
E
E
S
S
U
E
U
S
G
G
E
U
S
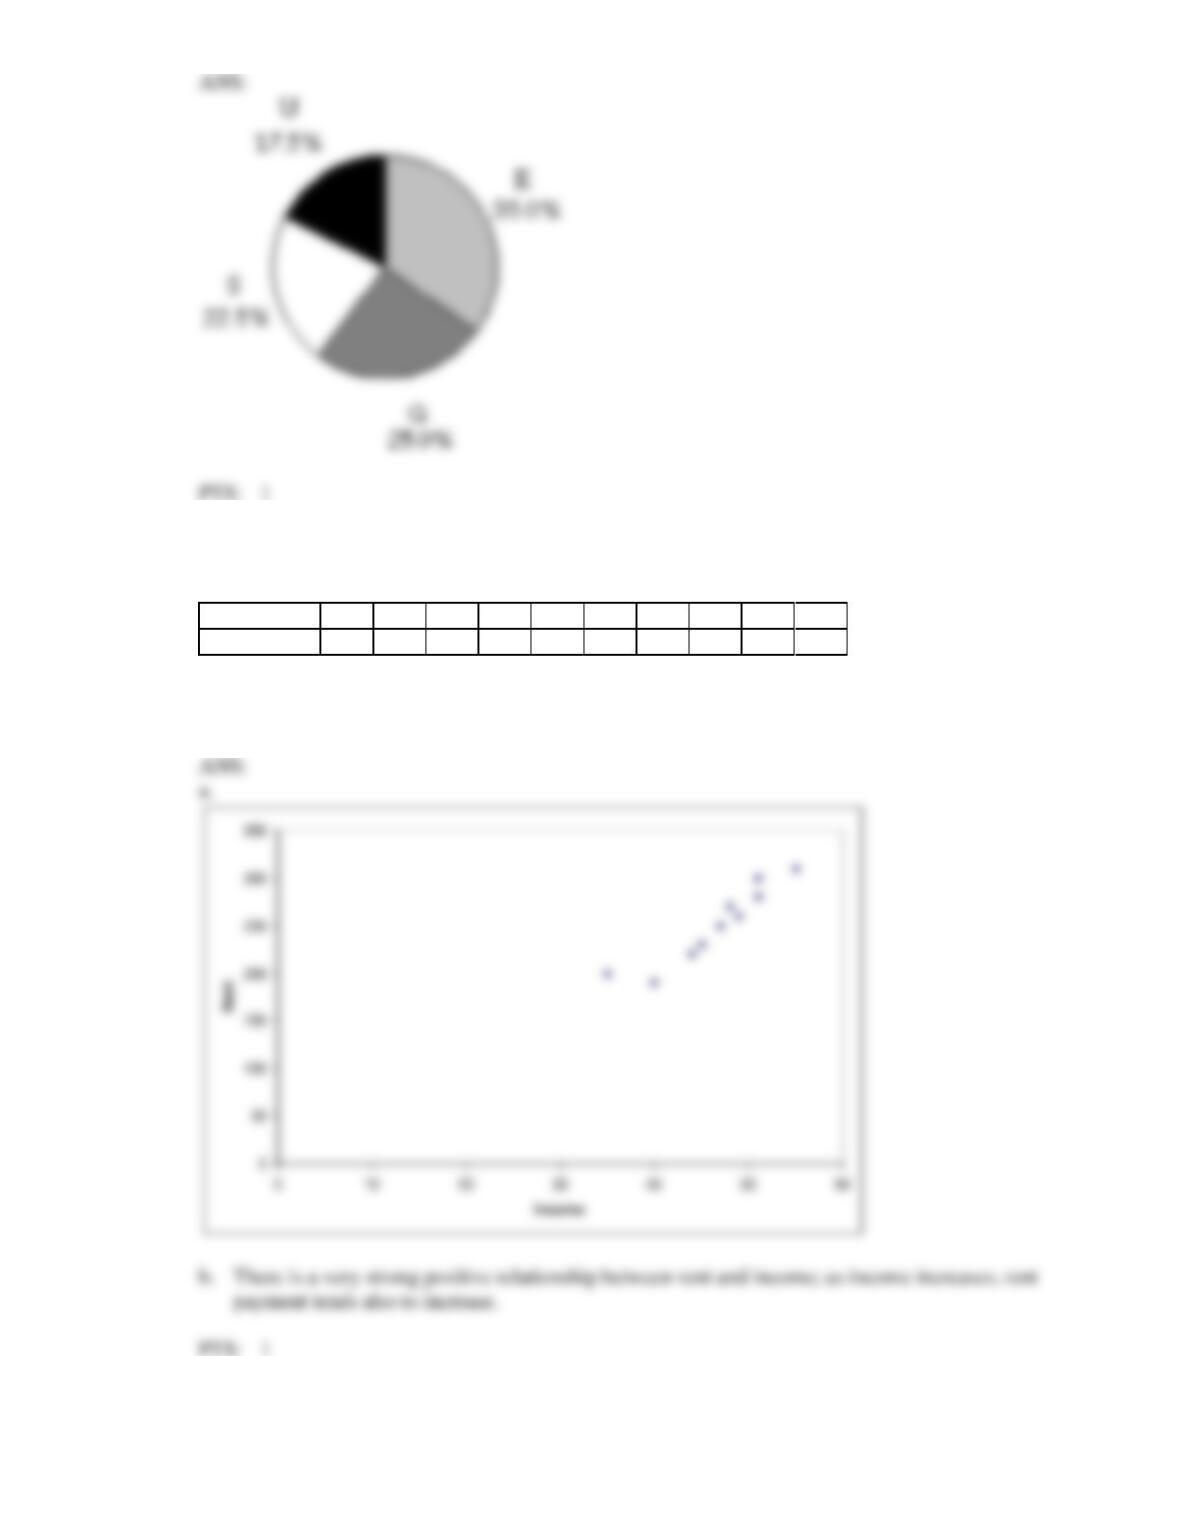
20. Construct a pie chart for the data in Data Set 2.
Data Set 2
Car buyers were asked by a car dealer to rate their level of satisfaction with the service they had
received. The four ratings were Excellent (E), Good (G), Satisfactory (S) and Unsatisfactory (U). The
following data were obtained.
S
E
E
E
U
E
G
S
E
U
U
G
E
G
S
E
G
G
E
G
S
E
E
S
U
G
G
E
E
S
S
U
E
U
S
G
G
E
U
S
21. The following table shows the annual incomes (in thousand of dollars) and weekly rent payments
(dollars) of a sample of 10 individuals in country New South Wales:
Income
45
51
40
44
48
35
51
55
49
47
Rent
230
280
190
220
270
200
300
310
260
250
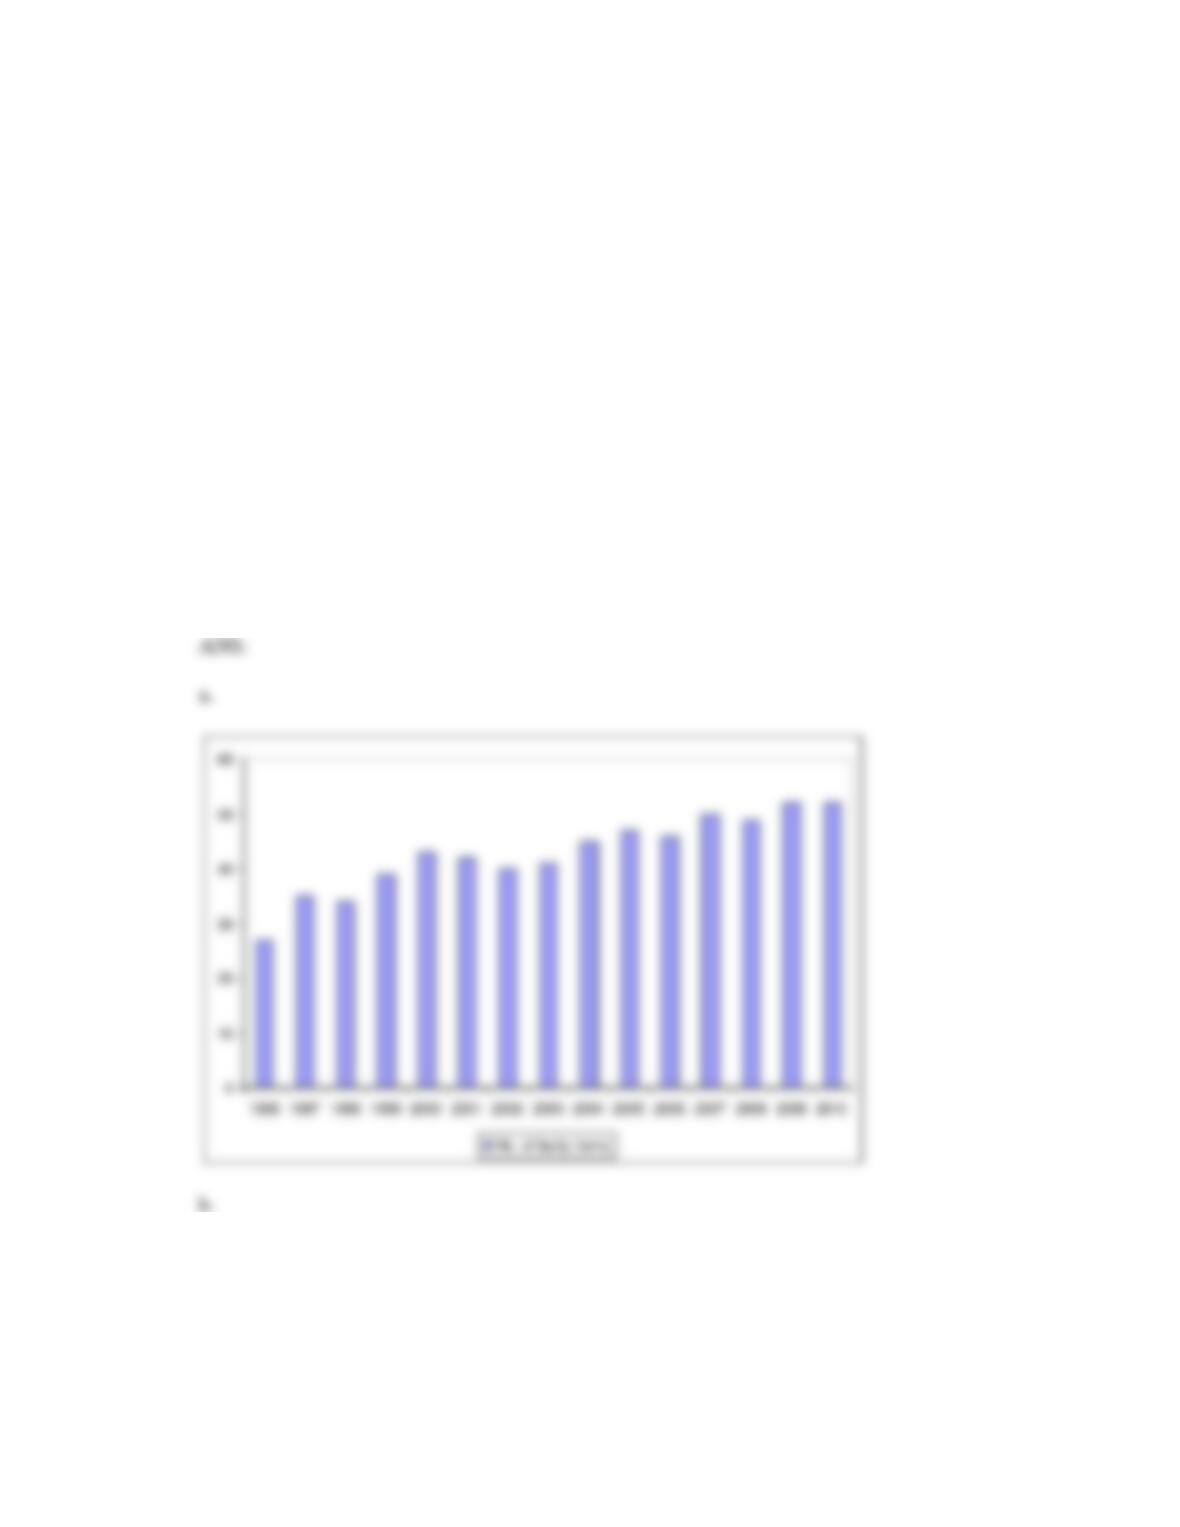
a. Draw a scatter diagram for these data with rent payment on the vertical axis.
b. Describe the relationship between rent payment and income.
22. The number of faulty items returned to a manufacturer of electric goods in the last 15 years are as
follows:
Year
No. of faulty items
1996
27
1997
35
1998
34
1999
39
2000
43
2001
42
2002
40
2003
41
2004
45
2005
47
2006
46
2007
50
2008
49
2009
52
2010
52
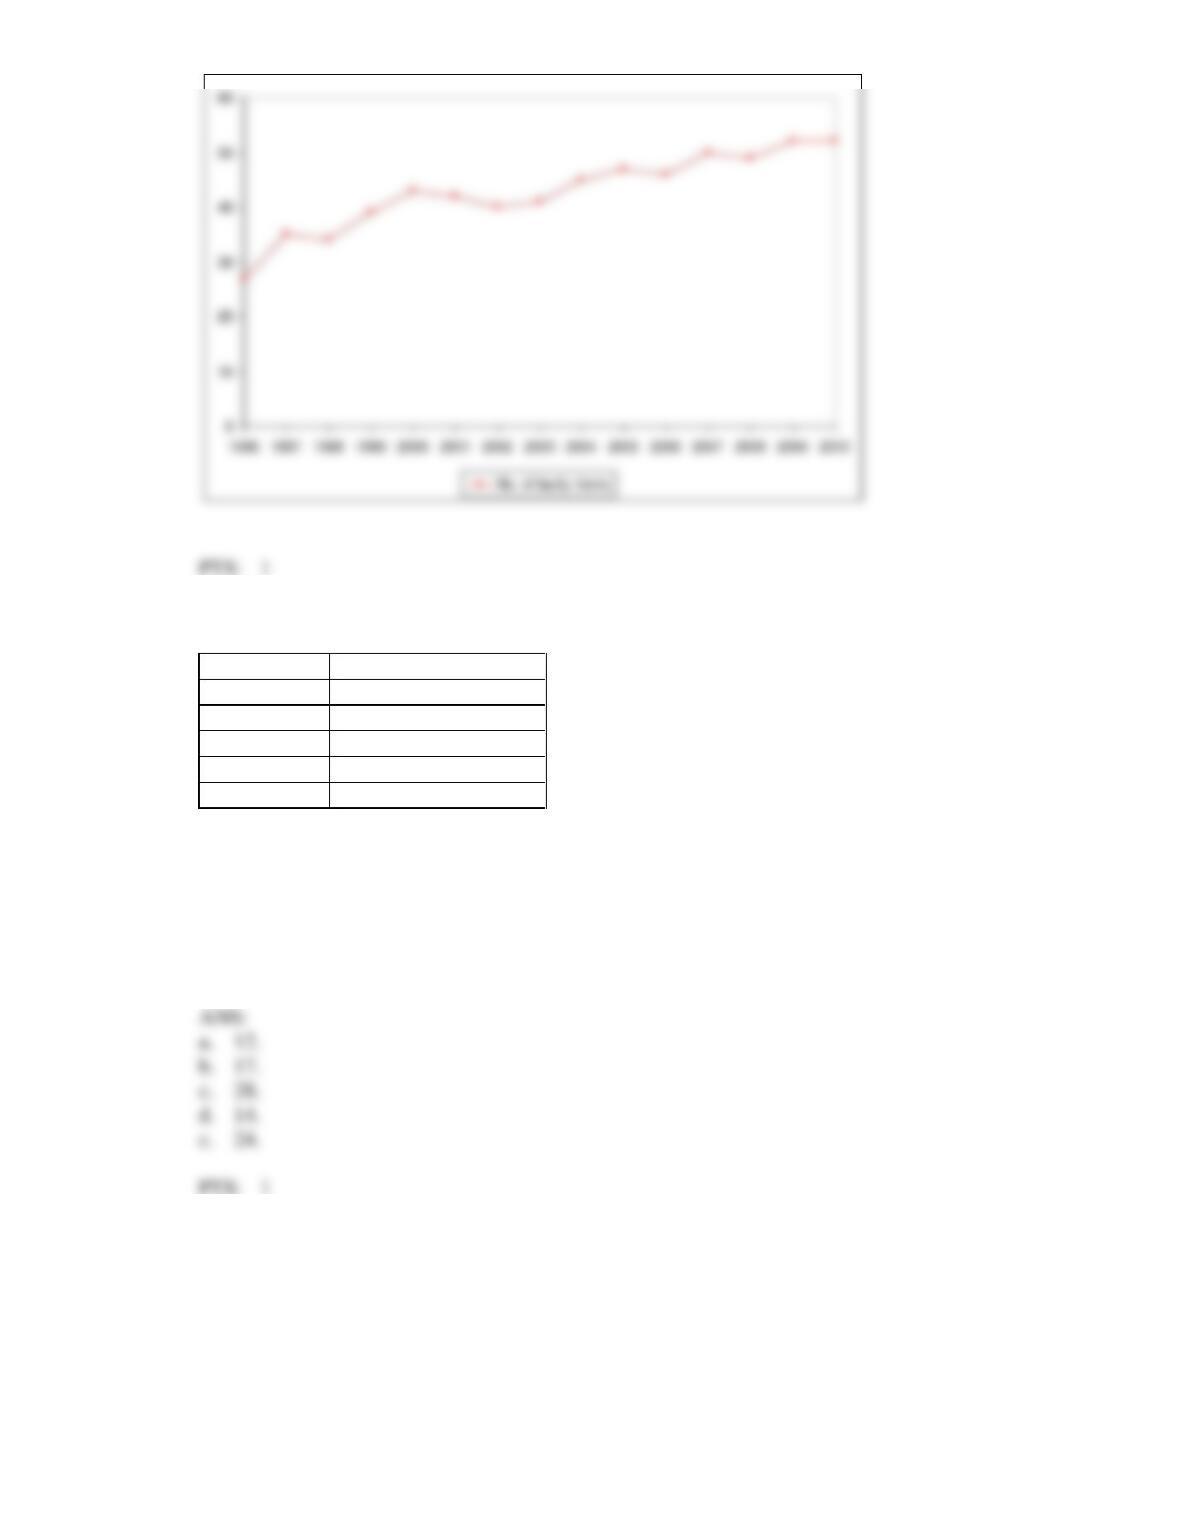
a. Construct a relative frequency bar chart for these data.
b. Construct a line chart.
23. Consider the following cumulative frequency distribution.
Class limits
Cumulative frequency
Up to 10
12
Up to 20
29
Up to 30
57
Up to 40
71
Up to 50
95
Find the frequency for each of the following classes.
a. 0 up to 10.
b. 10 up to 20.
c. 20 up to 30.
d. 30 up to 40.
e. 40 up to 50.
24. Data Set 3
The frequency distribution for a sample of 200 business school graduates is shown in the following
table:
Major of graduates
Number of graduates
Accounting
58
Finance
42
Management
38
Marketing
52
Other
10
Construct a relative frequency distribution for the data in Data Set 3 above.
25. Data Set 3
The frequency distribution for a sample of 200 business school graduates is shown in the following
table:
Major of graduates
Number of graduates
Accounting
58
Finance
42
Management
38
Marketing
52
Other
10
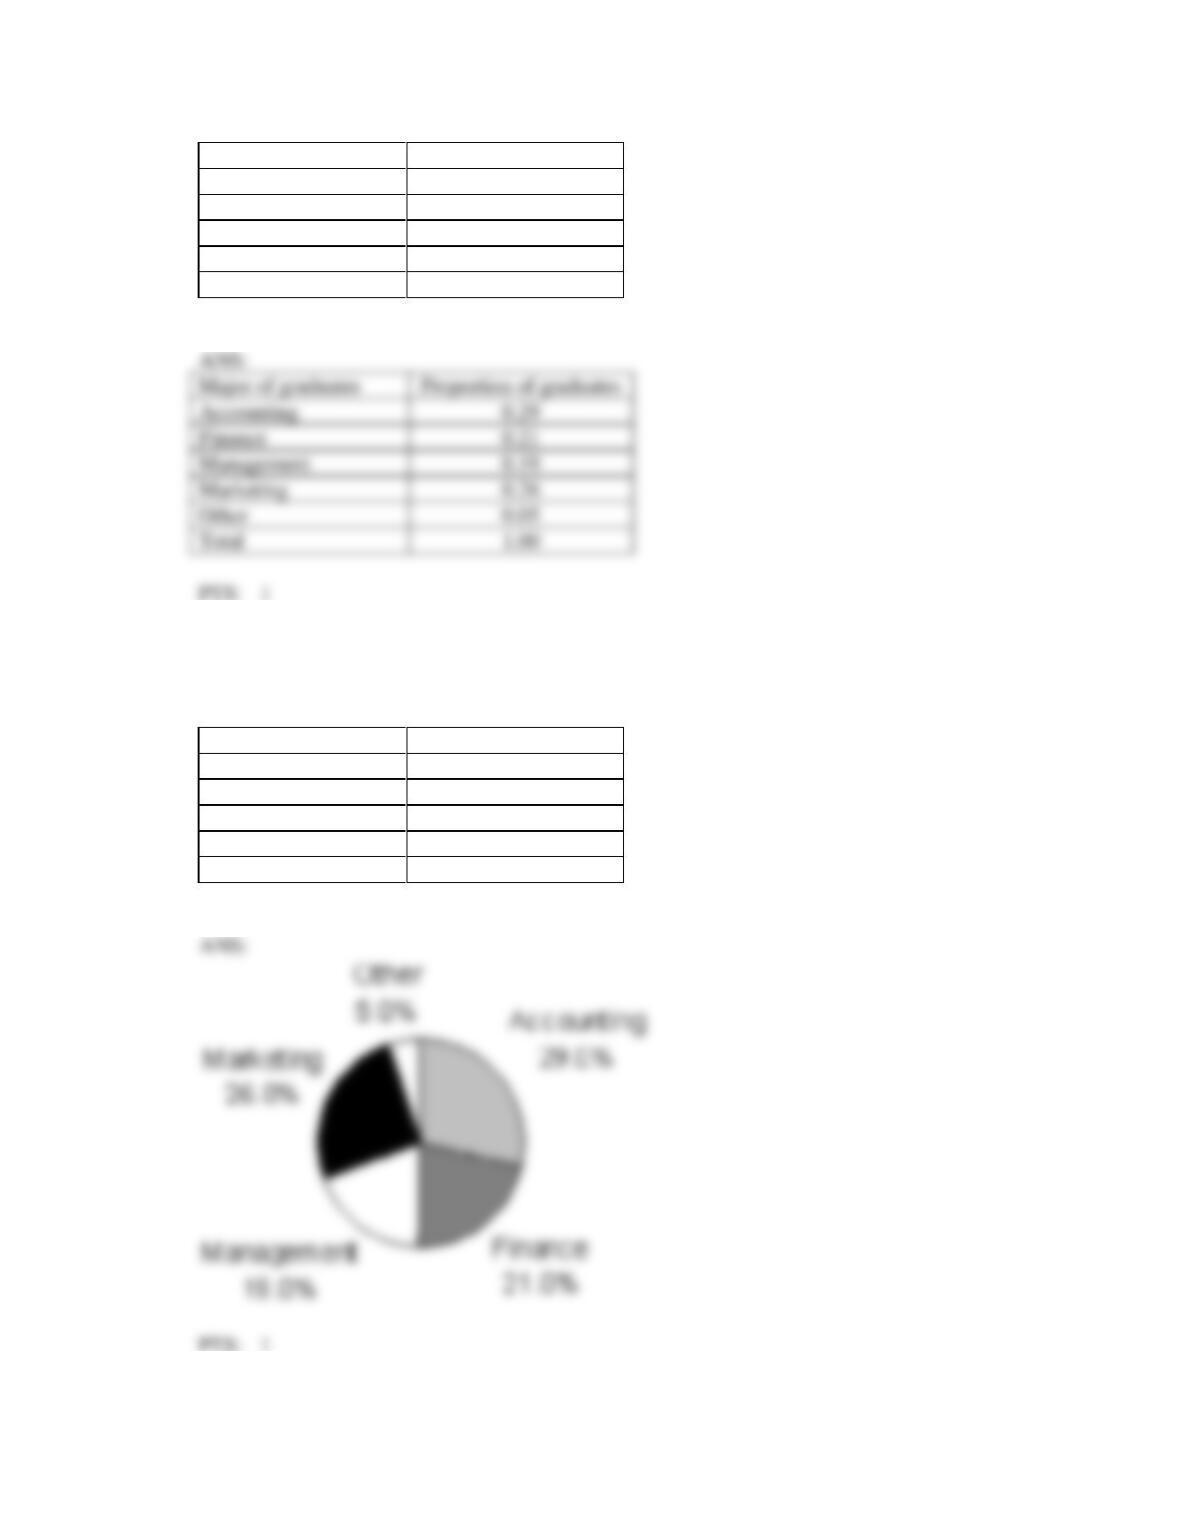
Draw a pie chart for the sample of graduates in Data Set 3 above.
Proportion of graduates
26. Data Set 3
The frequency distribution for a sample of 200 business school graduates is shown in the following
table:
Major of graduates
Number of graduates
Accounting
58
Finance
42
Management
38
Marketing
52
Other
10
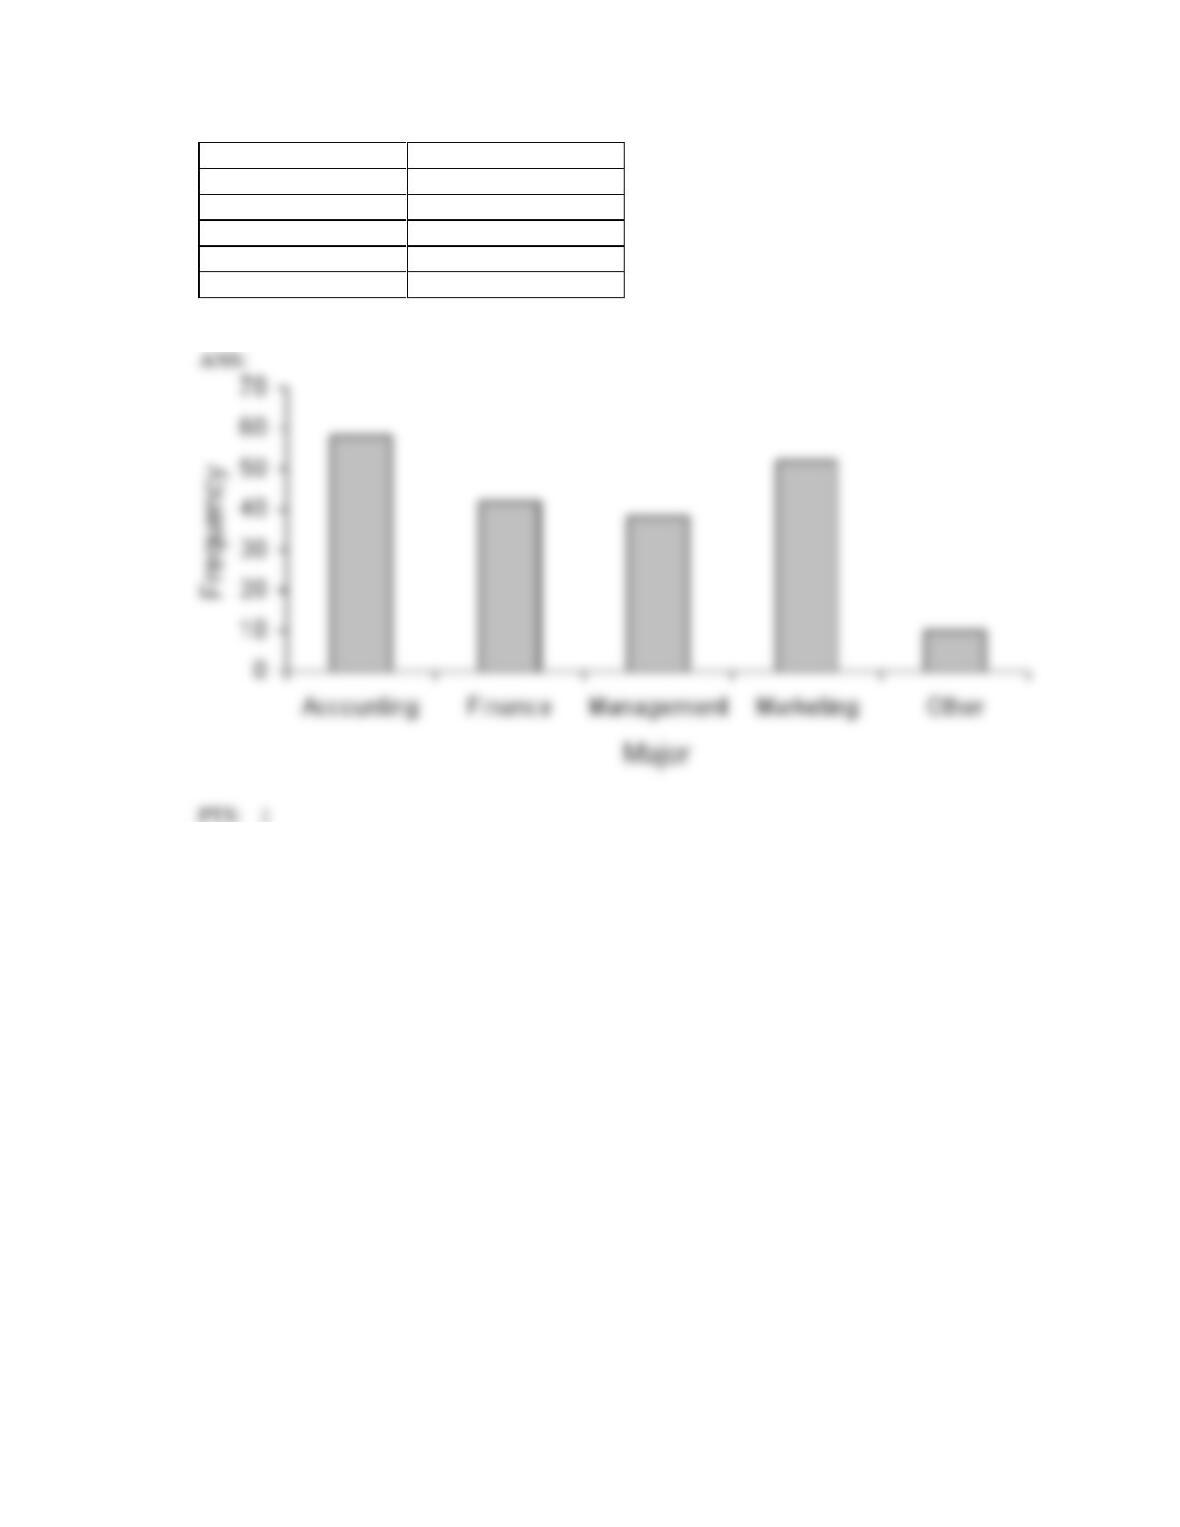
Draw a frequency bar chart for the sample of graduates in Data Set 3 above.
27. The weights in kilograms of a sample of 30 horses are given below:
Weight
165
175
150
155
173
149
145
153
153
153
152
145
164
143
170
175
148
174
171
156
166
168
152
150
173
168
146
155
172
159
a. Construct a cumulative relative frequency distribution for the data.
b. Construct an ogive for the data.
c. What proportion of horses weigh less than 160kgs?
d. What proportion of horses weigh between 145 and 165kgs?
28. The number of houses sold in a suburb in Sydney and the average monthly mortgage rates for 18
months randomly selected are shown in the following table.
Mortgage
rate (%)
Number of
houses sold
Mortgage
rate (%)
Number of
houses sold
7.5
90
9.5
68
9.0
72
6.5
97
7.0
89
8.0
79
10.5
62
9.0
75
10.0
58
10.5
53
9.5
70
9.5
73
8.5
74
11.0
50
10.0
65
7.5
82
11.0
51
8.5
70
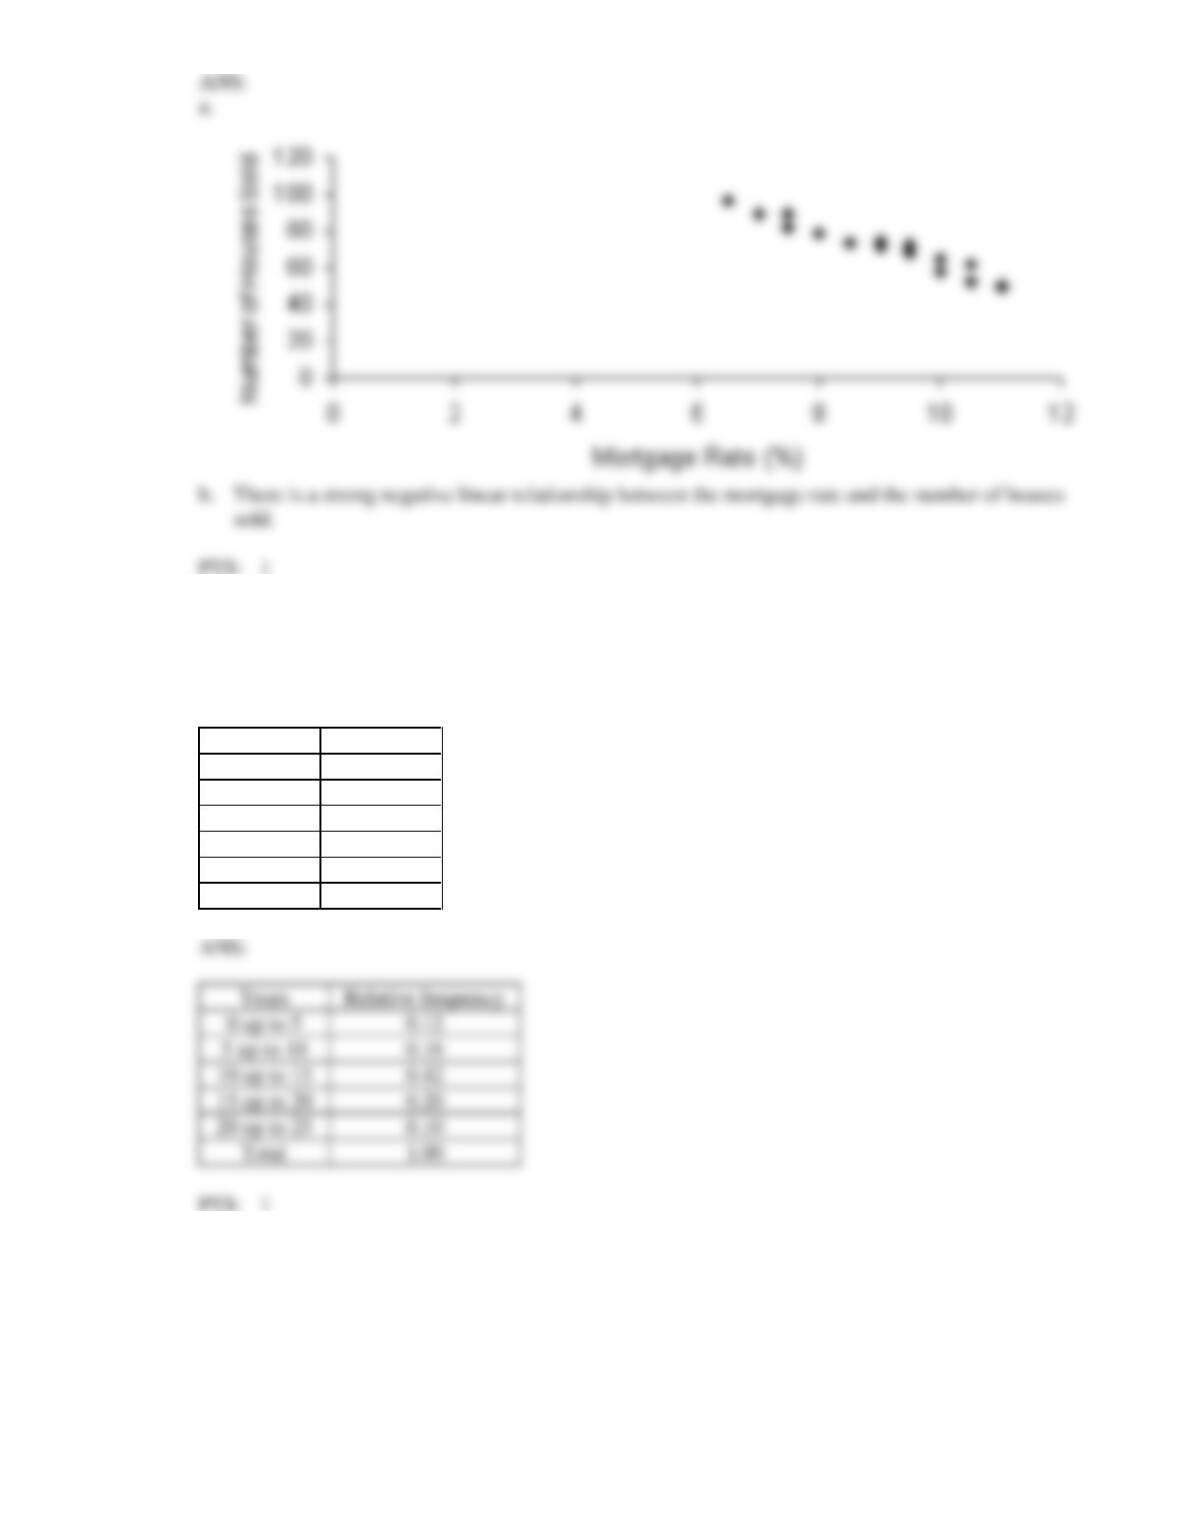
a. Draw a scatter diagram with the number of houses sold on the vertical axis.
b. Describe the relationship between mortgage rate and number of houses sold.
29. Construct a relative frequency distribution for the data in Data Set 4.
Data Set 4
The frequency distribution of the number of years of service for 100 employees is shown below.
Years
Frequency
0 up to 5
12
5 up to 10
16
10 up to 15
42
15 up to 20
20
20 up to 25
10
Total
100
15 up to 20
30. Construct a cumulative relative frequency distribution for the data in Data Set 4.
Data Set 4
The frequency distribution of the number of years of service for 100 employees is shown below.
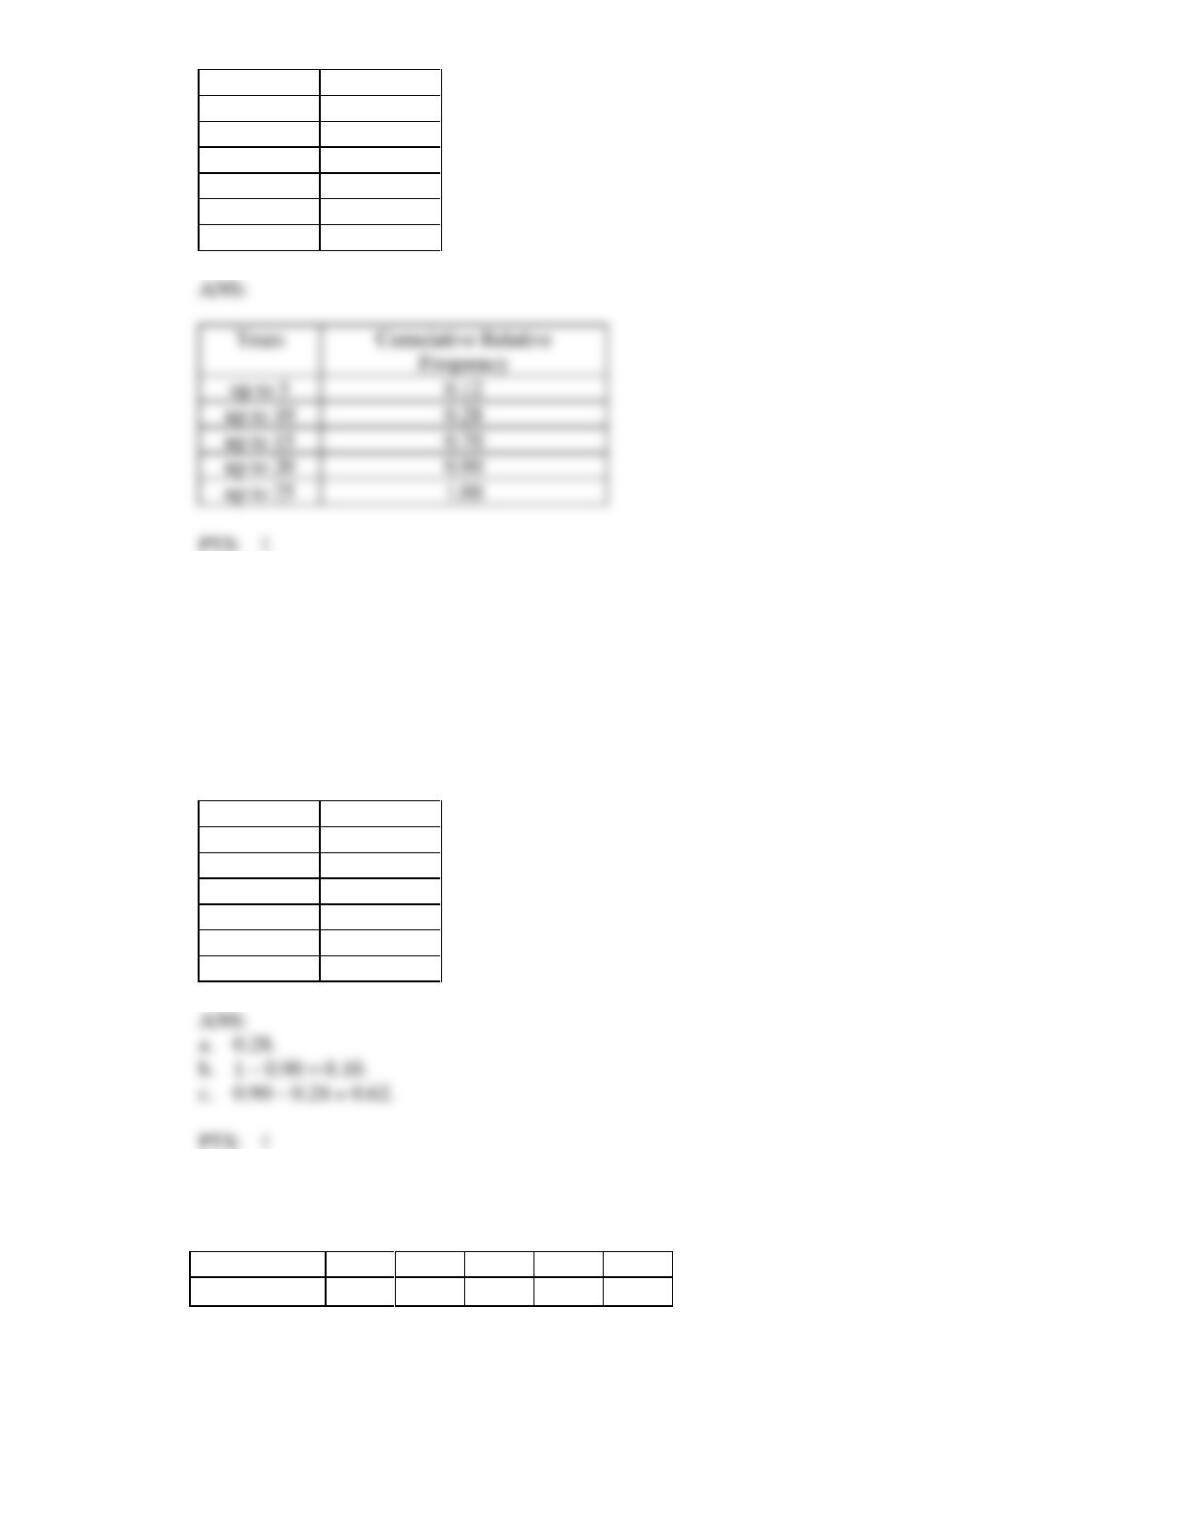
Years
Frequency
0 up to 5
12
5 up to 10
16
10 up to 15
42
15 up to 20
20
20 up to 25
10
Total
100
31. For the data in Data Set 4, estimate the proportion of employees who have:
a. fewer than 10 years of service.
b. more than 20 years of service.
c. between 10 and 20 years of service.
Data Set 4
The frequency distribution of the number of years of service for 100 employees is shown below.
Years
Frequency
0 up to 5
12
5 up to 10
16
10 up to 15
42
15 up to 20
20
20 up to 25
10
Total
100
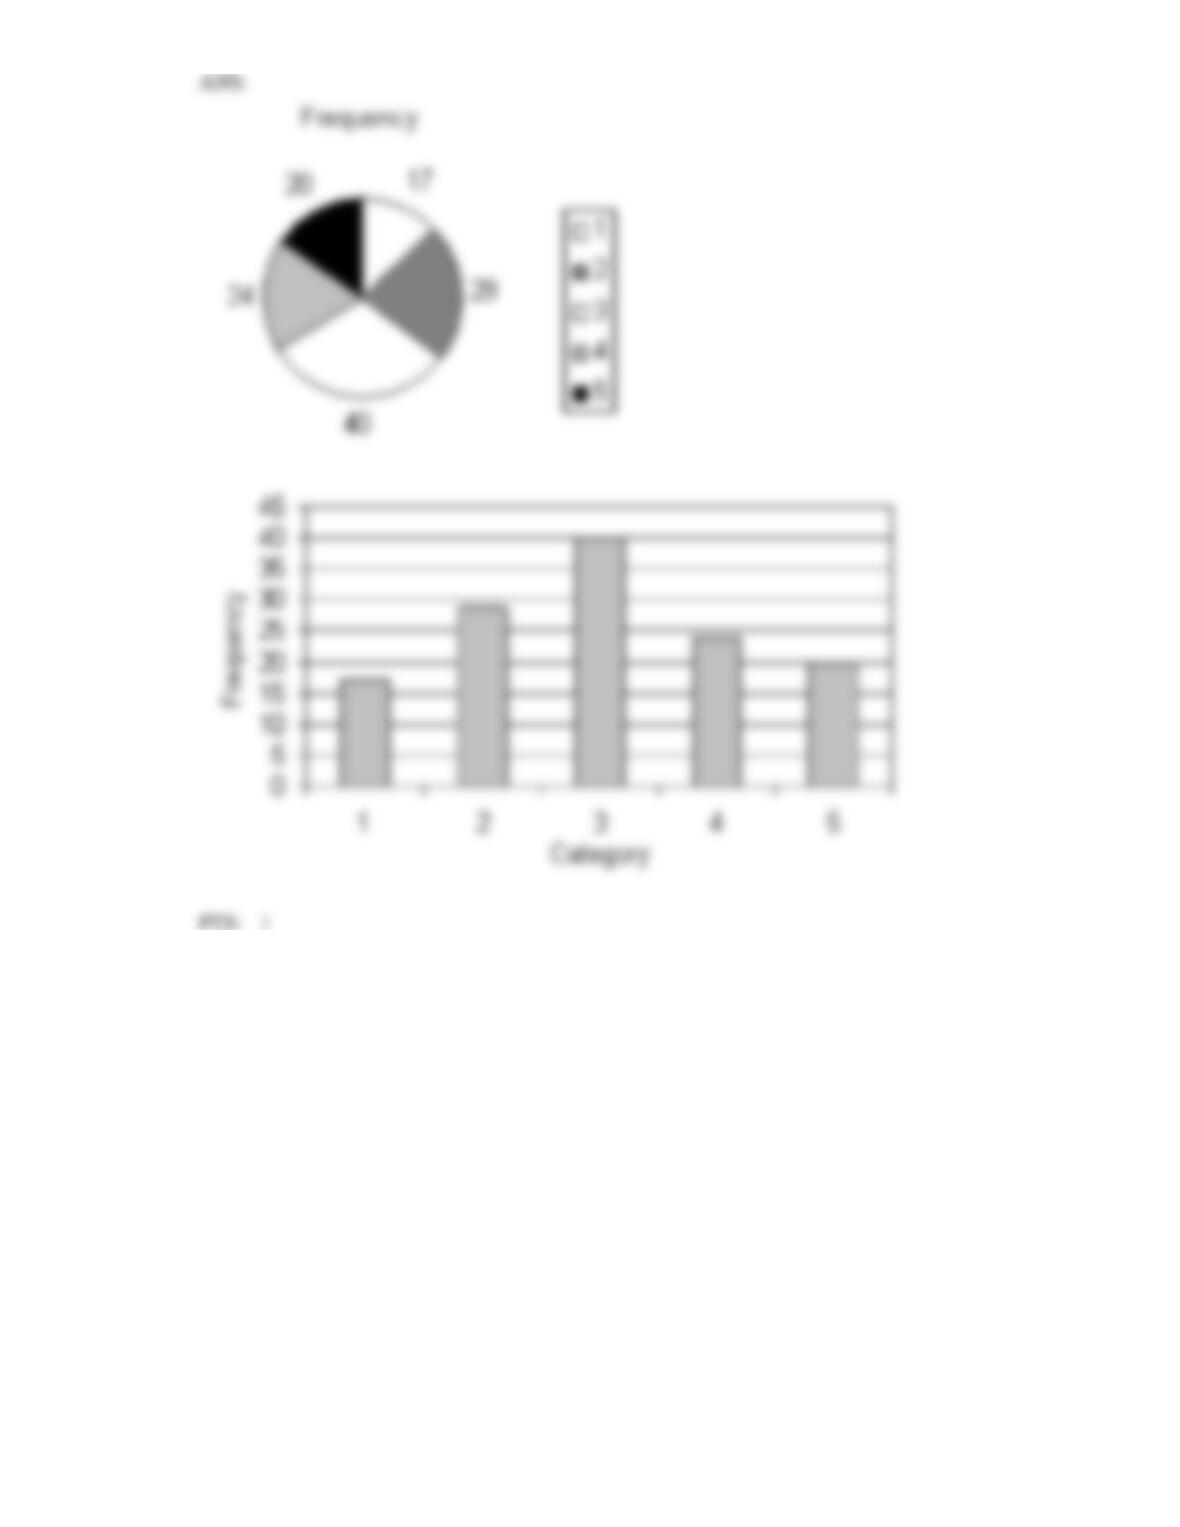
32. Given the following five categories and the number of times each occurs, draw a pie chart and a bar
chart by hand.
Category
1
2
3
4
5
Frequency
17
29
40
24
20