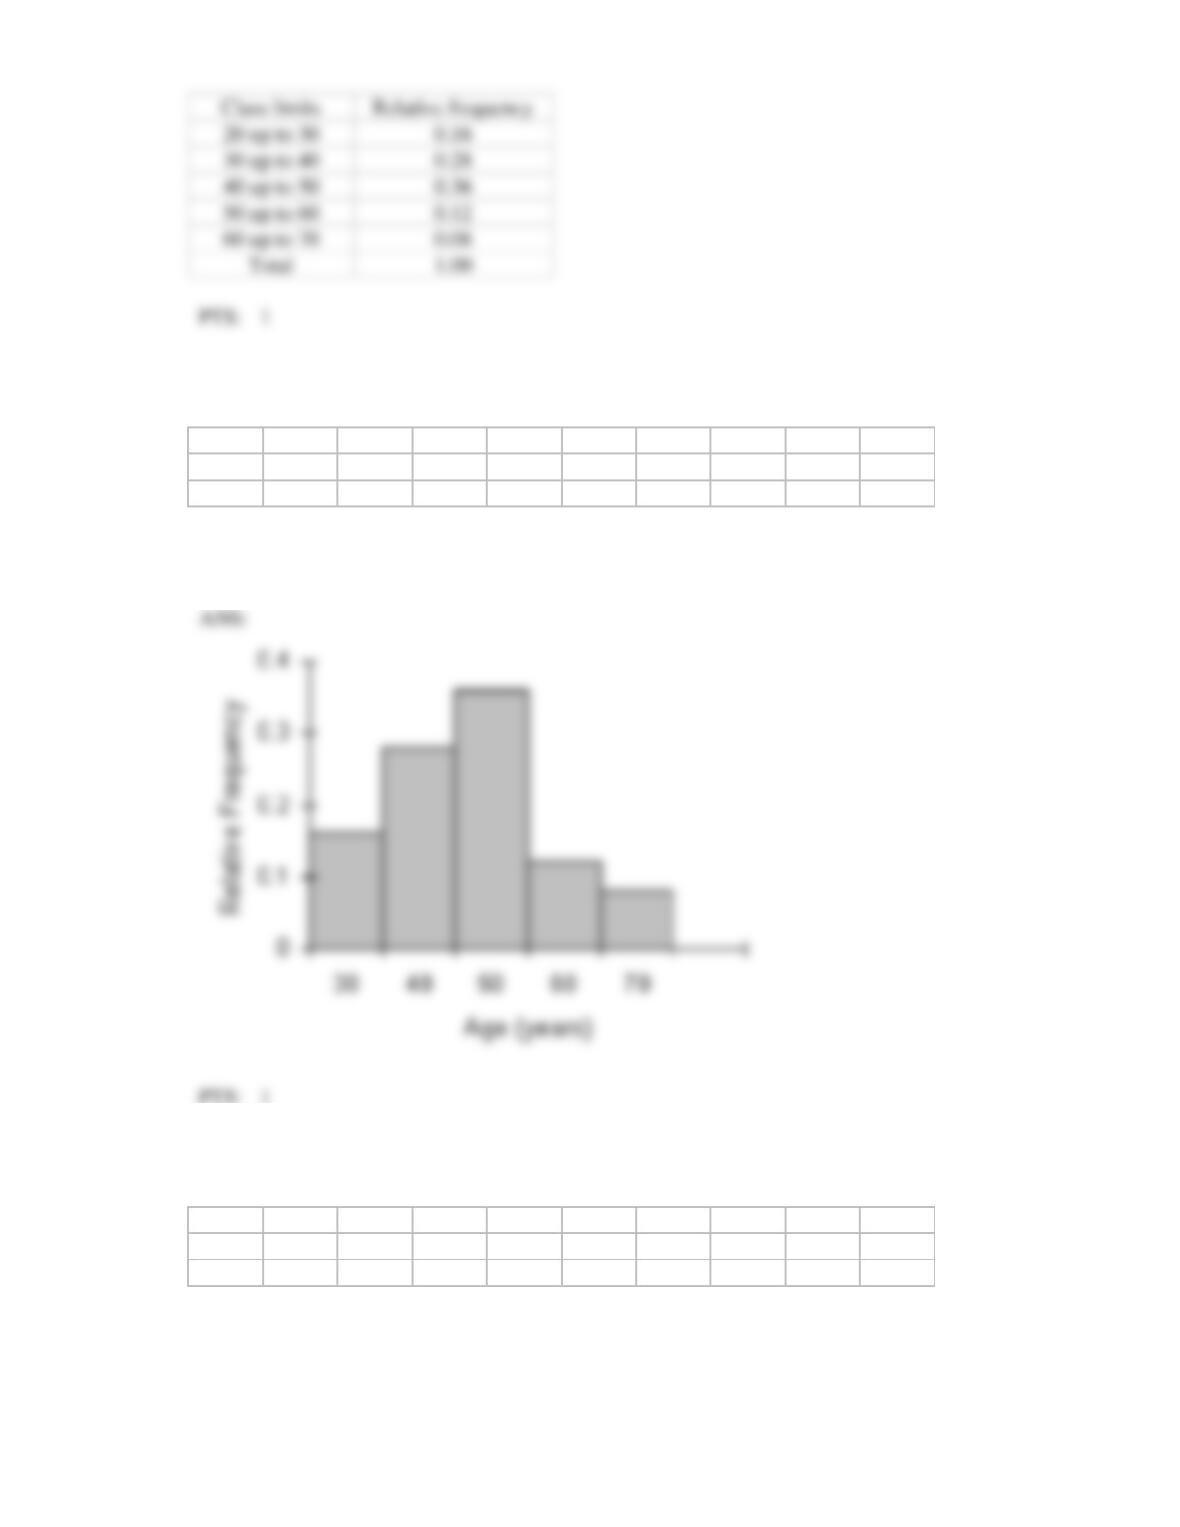
45. The following data represent the ages (in years) of a sample of 25 employees from a government
department:
31
43
56
23
49
42
33
61
44
28
48
38
44
35
40
64
52
42
47
39
53
27
36
35
20
Construct a relative frequency histogram for the data, using the relative frequency distribution
calculated in the previous question.
46. The following data represent the ages (in years) of a sample of 25 employees from a government
department:
31
43
56
23
49
42
33
61
44
28
48
38
44
35
40
64
52
42
47
39
53
27
36
35
20
Construct an ogive for the data. What proportion of the total area under the histogram constructed
above falls between 20 and 50 years?
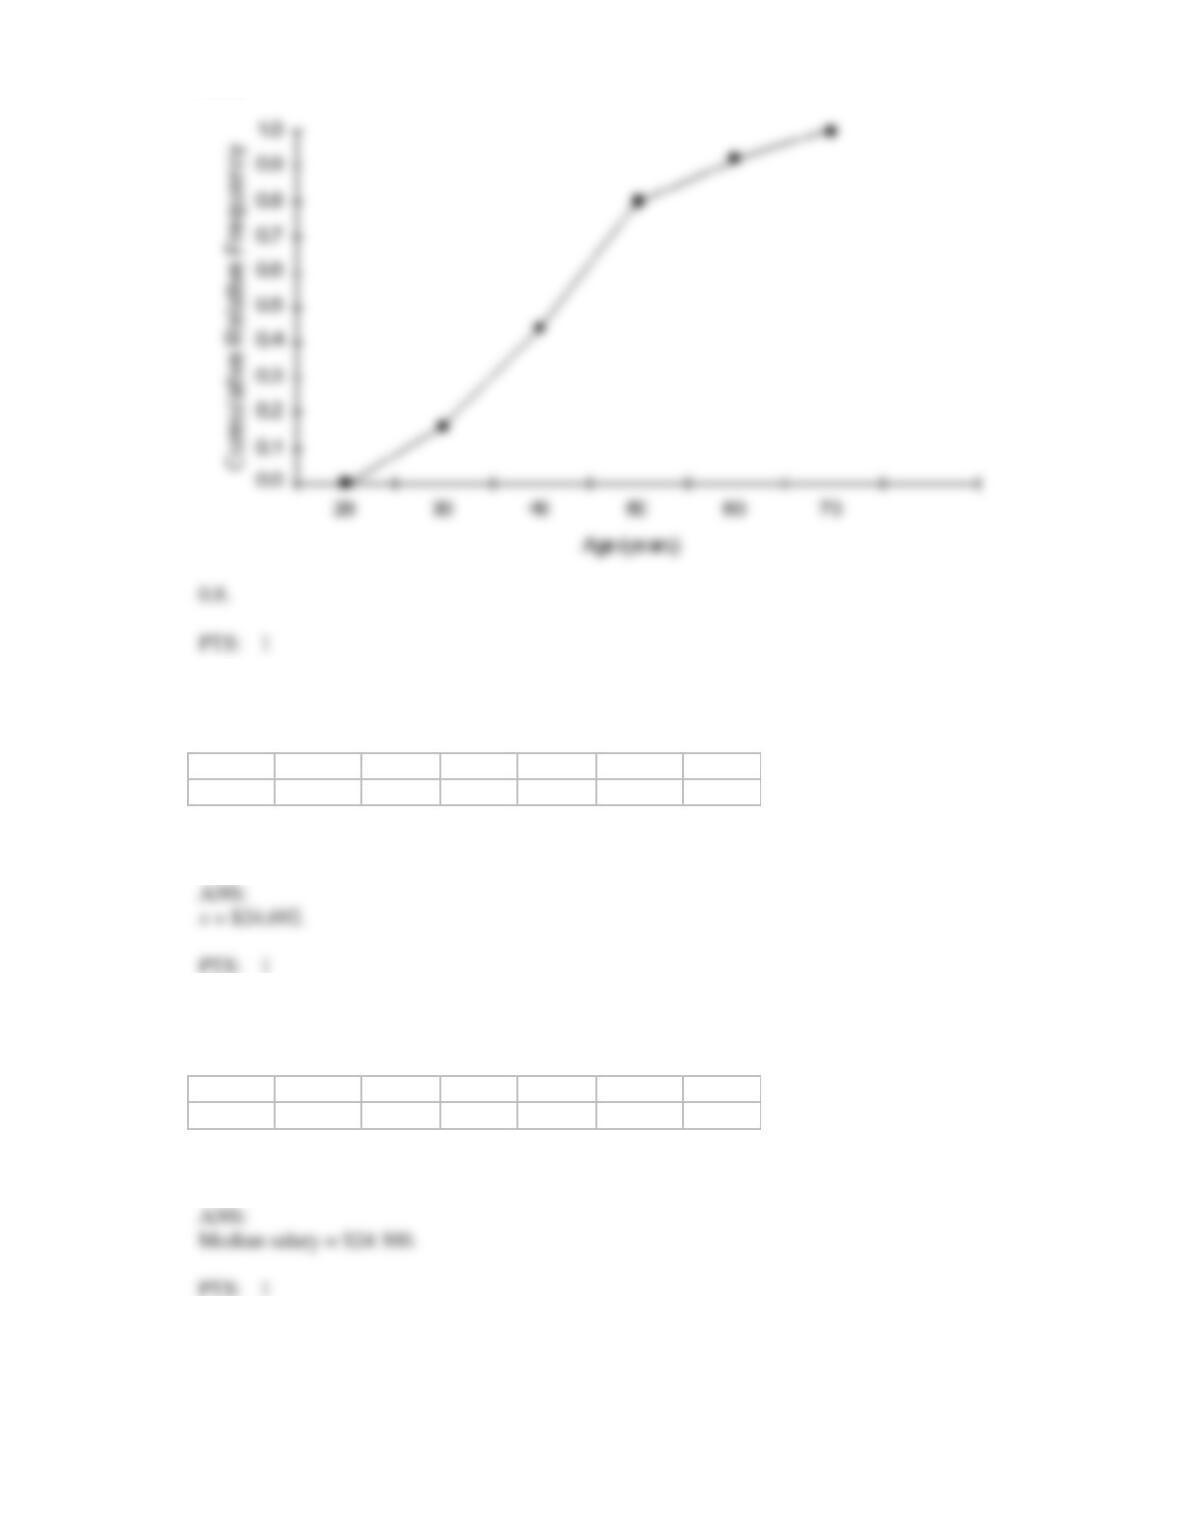
ANS:
47. The following data represent the salaries (in thousands of dollars) of a sample of 13 employees of a
firm:
26.5
23.5
29.7
24.8
21.1
24.3
20.4
22.7
27.2
23.7
24.1
24.8
28.2
Compute the mean salary.
48. The following data represent the salaries (in thousands of dollars) of a sample of 13 employees of a
firm:
26.5
23.5
29.7
24.8
21.1
24.3
20.4
22.7
27.2
23.7
24.1
24.8
28.2
Compute the median salary.
49. The following data represent the salaries (in thousands of dollars) of a sample of 13 employees of a
firm:
26.5
23.5
29.7
24.8
21.1
24.3
20.4
22.7
27.2
23.7
24.1
24.8
28.2
Compute the variance and standard deviation of the salaries.
50. The following data represent the salaries (in thousands of dollars) of a sample of 13 employees of a
firm:
26.5
23.5
29.7
24.8
21.1
24.3
20.4
22.7
27.2
23.7
24.1
24.8
28.2
Compute the coefficient of variation.
51. The following data represent the salaries (in thousands of dollars) of a sample of 13 employees of a
firm:
26.5
23.5
29.7
24.8
21.1
24.3
20.4
22.7
27.2
23.7
24.1
24.8
28.2
Compute the range.
52. The following data represent the salaries (in thousands of dollars) of a sample of 13 employees of a
firm:
26.5
23.5
29.7
24.8
21.1
24.3
20.4
22.7
27.2
23.7
24.1
24.8
28.2
Compute the lower quartile.
53. The following data represent the salaries (in thousands of dollars) of a sample of 13 employees of a
firm:
26.5
23.5
29.7
24.8
21.1
24.3
20.4
22.7
27.2
23.7
24.1
24.8
28.2
Compute the upper quartile.
54. The following data represent the salaries (in thousands of dollars) of a sample of 13 employees of a
firm:
26.5
23.5
29.7
24.8
21.1
24.3
20.4
22.7
27.2
23.7
24.1
24.8
28.2
Compute the 90th percentile.
55. The following data represent the salaries (in thousands of dollars) of a sample of 13 employees of a
firm:
26.5
23.5
29.7
24.8
21.1
24.3
20.4
22.7
27.2
23.7
24.1
24.8
28.2
Consider the following population of measurements:
162
152
177
157
184
176
165
181
170
163
a. Compute the mean.
b. Compute the median.
c. Compute the variance and the standard deviation.
56. A supermarket has determined that daily demand for egg cartons has an approximate mound-shaped
distribution, with a mean of 55 cartons and a standard deviation of 6 cartons.
a. For what percentage of days can we expect the number of cartons of eggs sold to be between 49
and 61?
b. For what percentage of days can we expect the number of cartons of eggs sold to be more than 2
standard deviations from the mean?
c. If the supermarket begins each morning with a stock of 77 cartons of eggs, for what percentage of
days will there be an insufficient number of cartons to meet the demand?
57. A sample of 12 measurements has a mean of 25 and a standard deviation of 4. Suppose that the sample
is enlarged to 14 measurements, by including two additional measurements having a common value of
25.
a. Find the mean of the sample of 14 measurements.
b. Find the standard deviation of the sample of 14 measurements.
58. The price–earnings ratios of a sample of stocks have a mean value of 13.5 and a standard deviation of
2. If the ratios have a mound-shaped distribution, what can we say about the proportion of ratios that
fall between:
a. 11.5 and 15.5?
b. 9.5 and 17.5?
c. 7.5 and 19.5?
59. The mean of a sample of 15 measurements is 35.6. Suppose that the sample is enlarged to 16
measurements, by including one additional measurement having a value of 42. Find the mean of the
sample of 16 measurements.
60. Suppose that an analysis of a set of data reveals that
,45
1=
Q
85
2=Q
and
.105
3=Q
a. What do these statistics tell you about the shape of the distribution?
b. What can you say about the relative position of each of the observations 34, 84 and 104?
c. Calculate the interquartile range.
d. What does the interquartile range tell you about the data?
61. Given the following sample data:
x
420
610
625
500
400
450
550
650
480
565
y
2.80
3.60
3.75
3.00
2.50
2.70
3.50
3.90
2.95
3.30
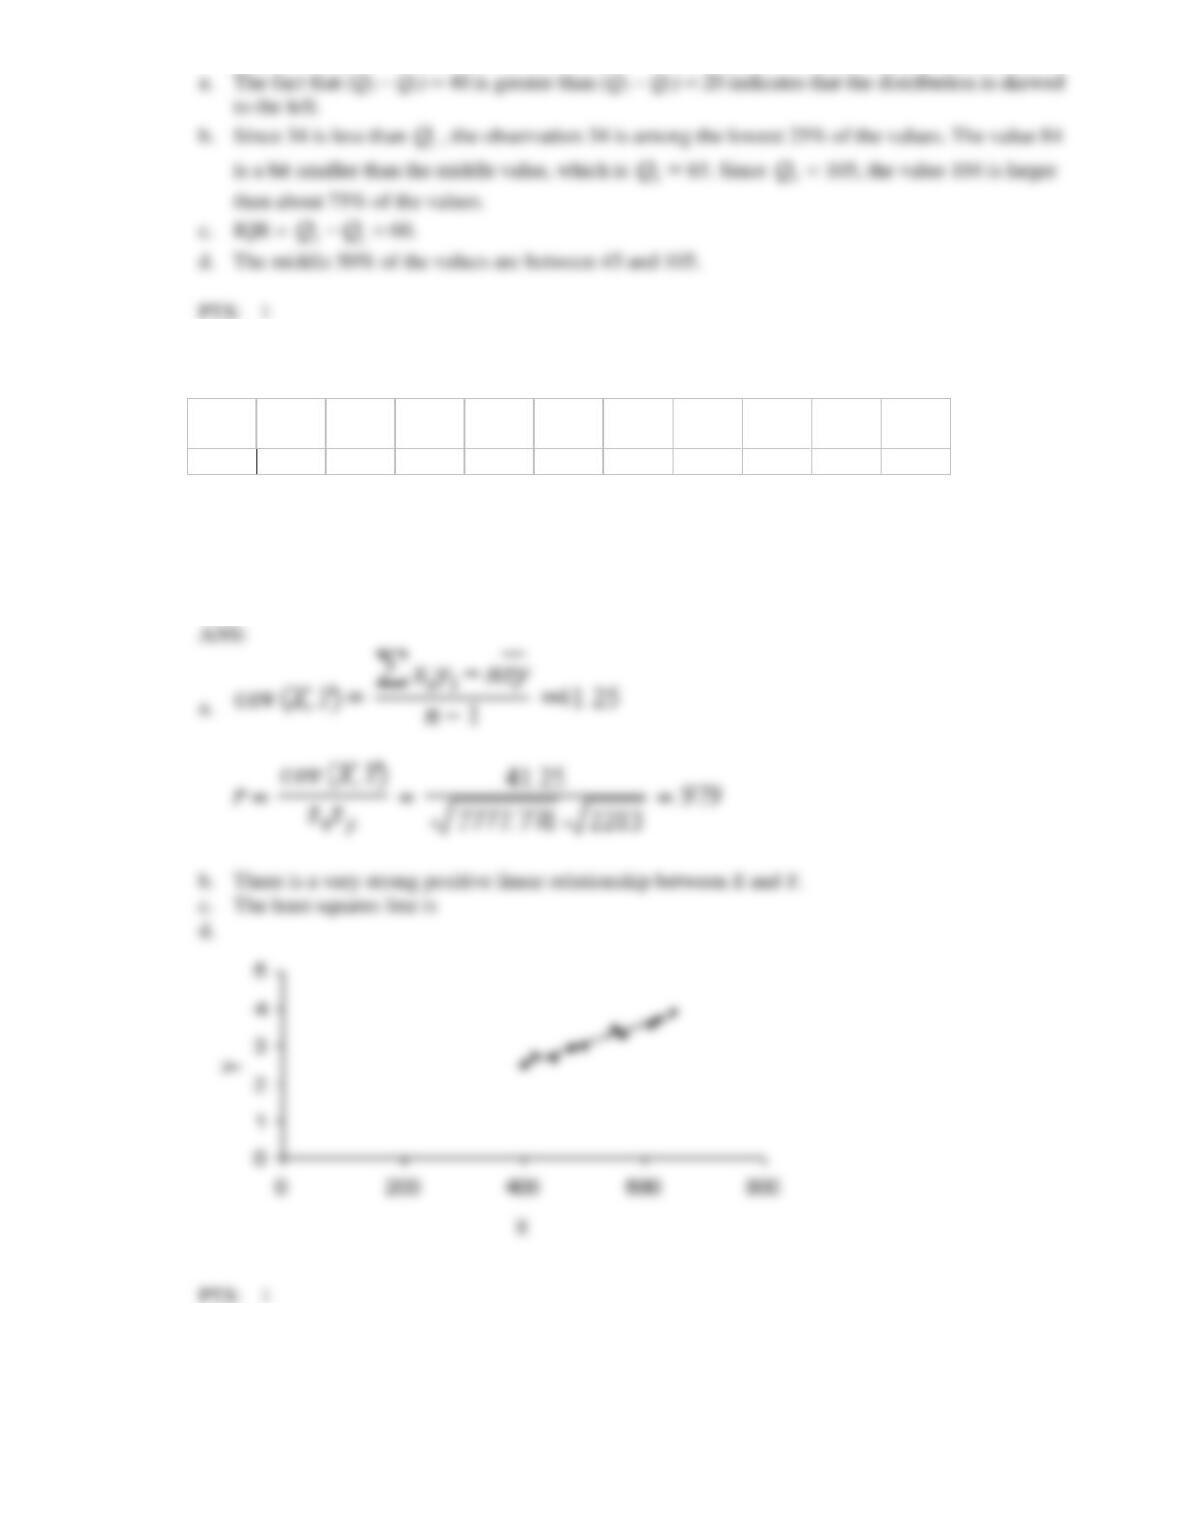
a. calculate the covariance and the correlation coefficient.
b. comment on the relationship between X and Y.
c. determine the least-squares line.
d. draw the scatter diagram and plot the least-squares line.
62. A sample of eight observations of variables x and y is shown below:
x
5
3
7
9
2
4
6
8
y
20
23
15
11
27
21
17
14
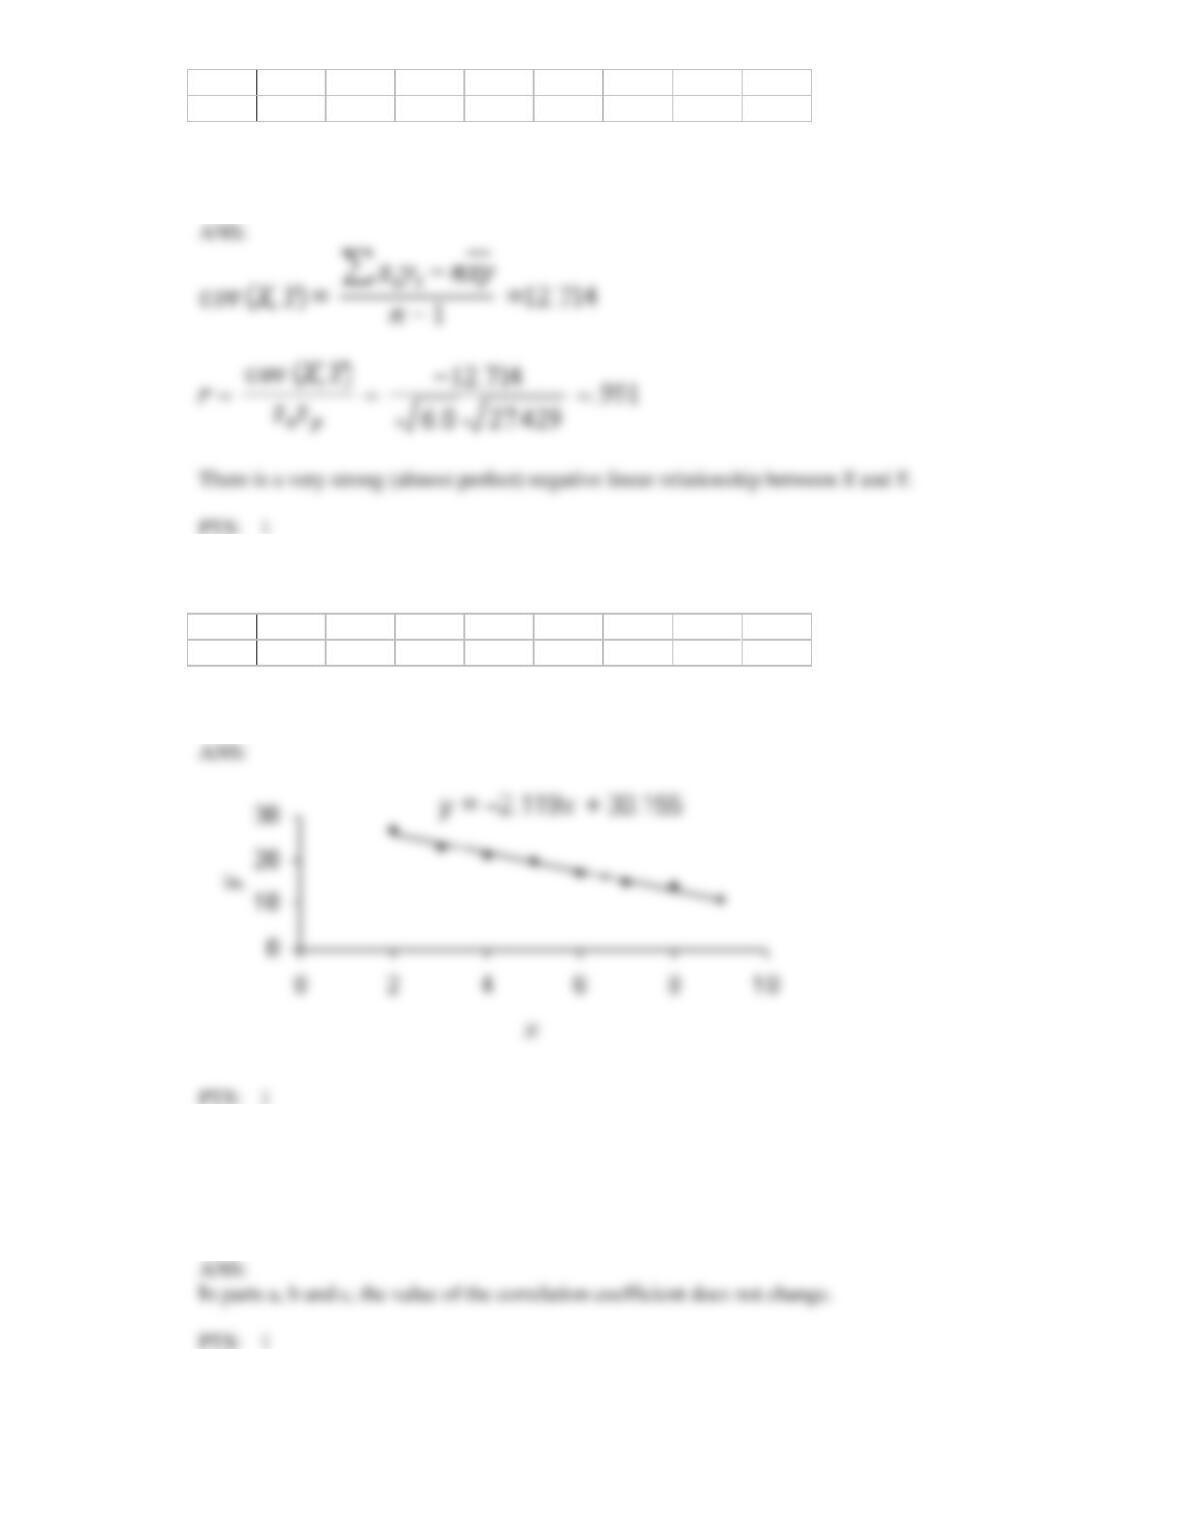
Calculate the covariance and the coefficient of correlation, and comment on the relationship between X
and Y.
63. A sample of eight observations of variables x and y is shown below:
x
5
3
7
9
2
4
6
8
y
20
23
15
11
27
21
17
14
Draw the scatter diagram and plot the least-squares line.
64. How is the value of the correlation coefficient r affected in each of the following cases?
a. Each x value is multiplied by 4.
b. Each x value is switched with the corresponding y value.
c. Each x value is increased by 2.
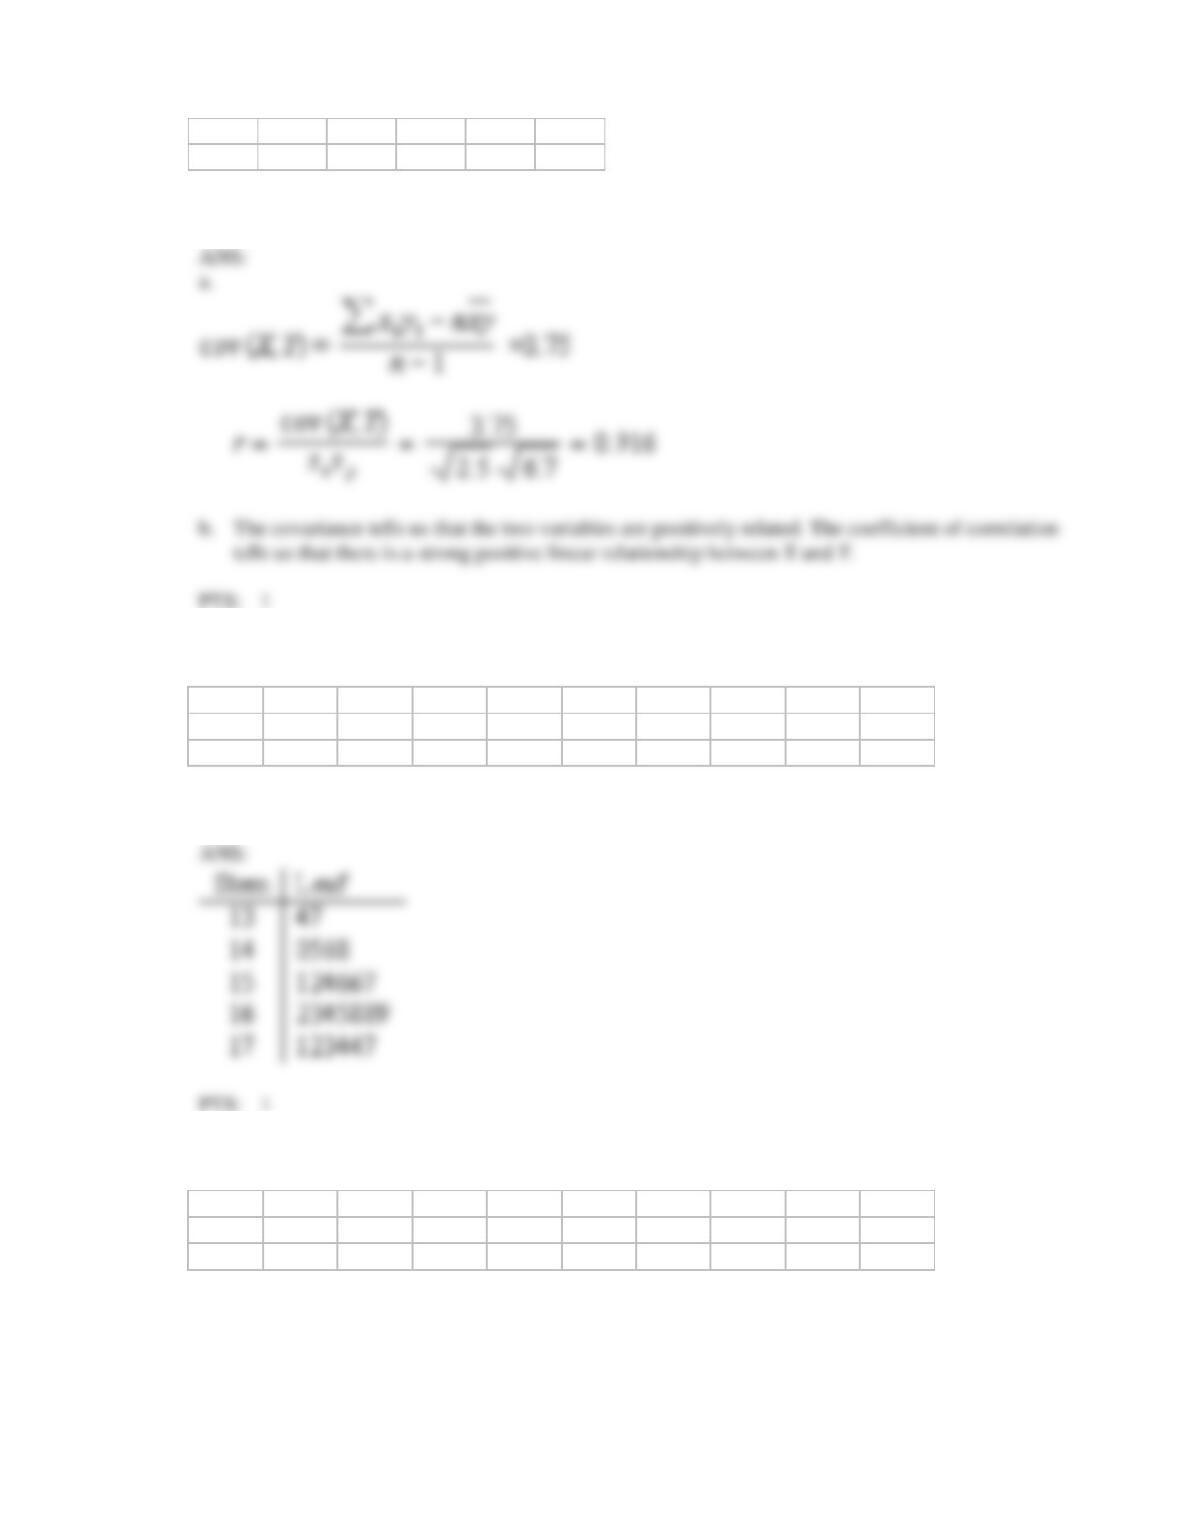
65. a. Calculate the covariance and the coefficient of correlation for the following sample.
x
9
6
7
5
8
y
19
14
16
12
15
b. What do these statistics tell you about the relationship between X and Y?
66. The following data are the heights (in cm) of the 25 students in a business statistics class:
164
148
137
157
173
156
177
172
169
165
145
168
163
162
174
152
156
168
154
151
174
146
134
140
171
Construct a stem and leaf display for the heights.
67. The following data are the heights (in cm) of the 25 students in a business statistics class:
164
148
137
157
173
156
177
172
169
165
145
168
163
162
174
152
156
168
154
151
174
146
134
140
171
a. Find the median height.
b. Find the lower quartile of the heights.
c. Find the upper quartile of the heights.
d. Find the 60th percentile of the heights.
68. The following data are the heights (in cm) of the 25 students in a business statistics class:
164
148
137
157
173
156
177
172
169
165
145
168
163
162
174
152
156
168
154
151
174
146
134
140
171
a. Compute the sample mean height.
b. Compute the sample variance.
c. Compute the sample standard deviation.
69. The following data are the heights (in cm) of the 25 students in a business statistics class:
164
148
137
157
173
156
177
172
169
165
145
168
163
162
174
152
156
168
154
151
174
146
134
140
171
a. Compute the range of the data.
b. Compute the range approximation to the standard deviation of the data. (Hint: S Range/4.)
70. The following data are the heights (in cm) of the 25 students in a business statistics class:
164
148
137
157
173
156
177
172
169
165
145
168
163
162
174
152
156
168
154
151
174
146
134
140
171
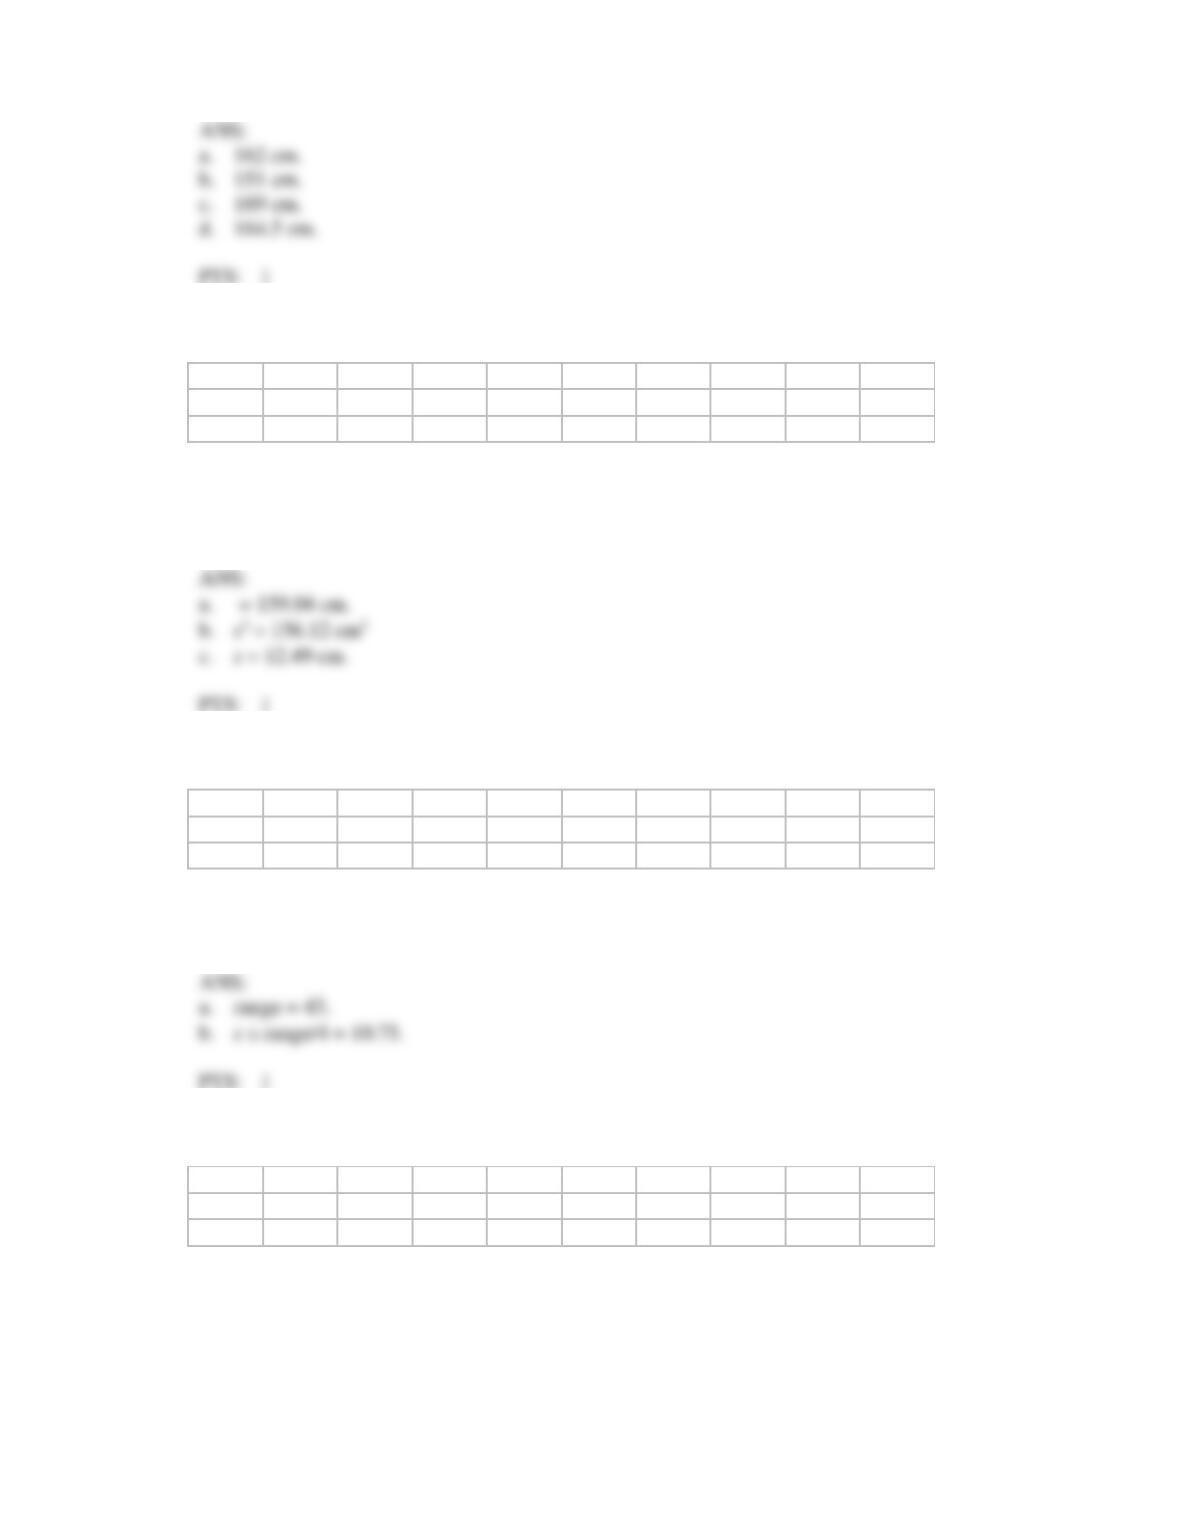
a. Construct a frequency distribution for the data, using five class intervals and the value 130 as the
lower limit of the first class.
b. Construct a relative frequency histogram for the data, using five class intervals and the value 10 as
the lower limit of the first class.
71. The following data are the heights (in cm) of the 25 students in a business statistics class:
164
148
137
157
173
156
177
172
169
165
145
168
163
162
174
152
156
168
154
151
174
146
134
140
171
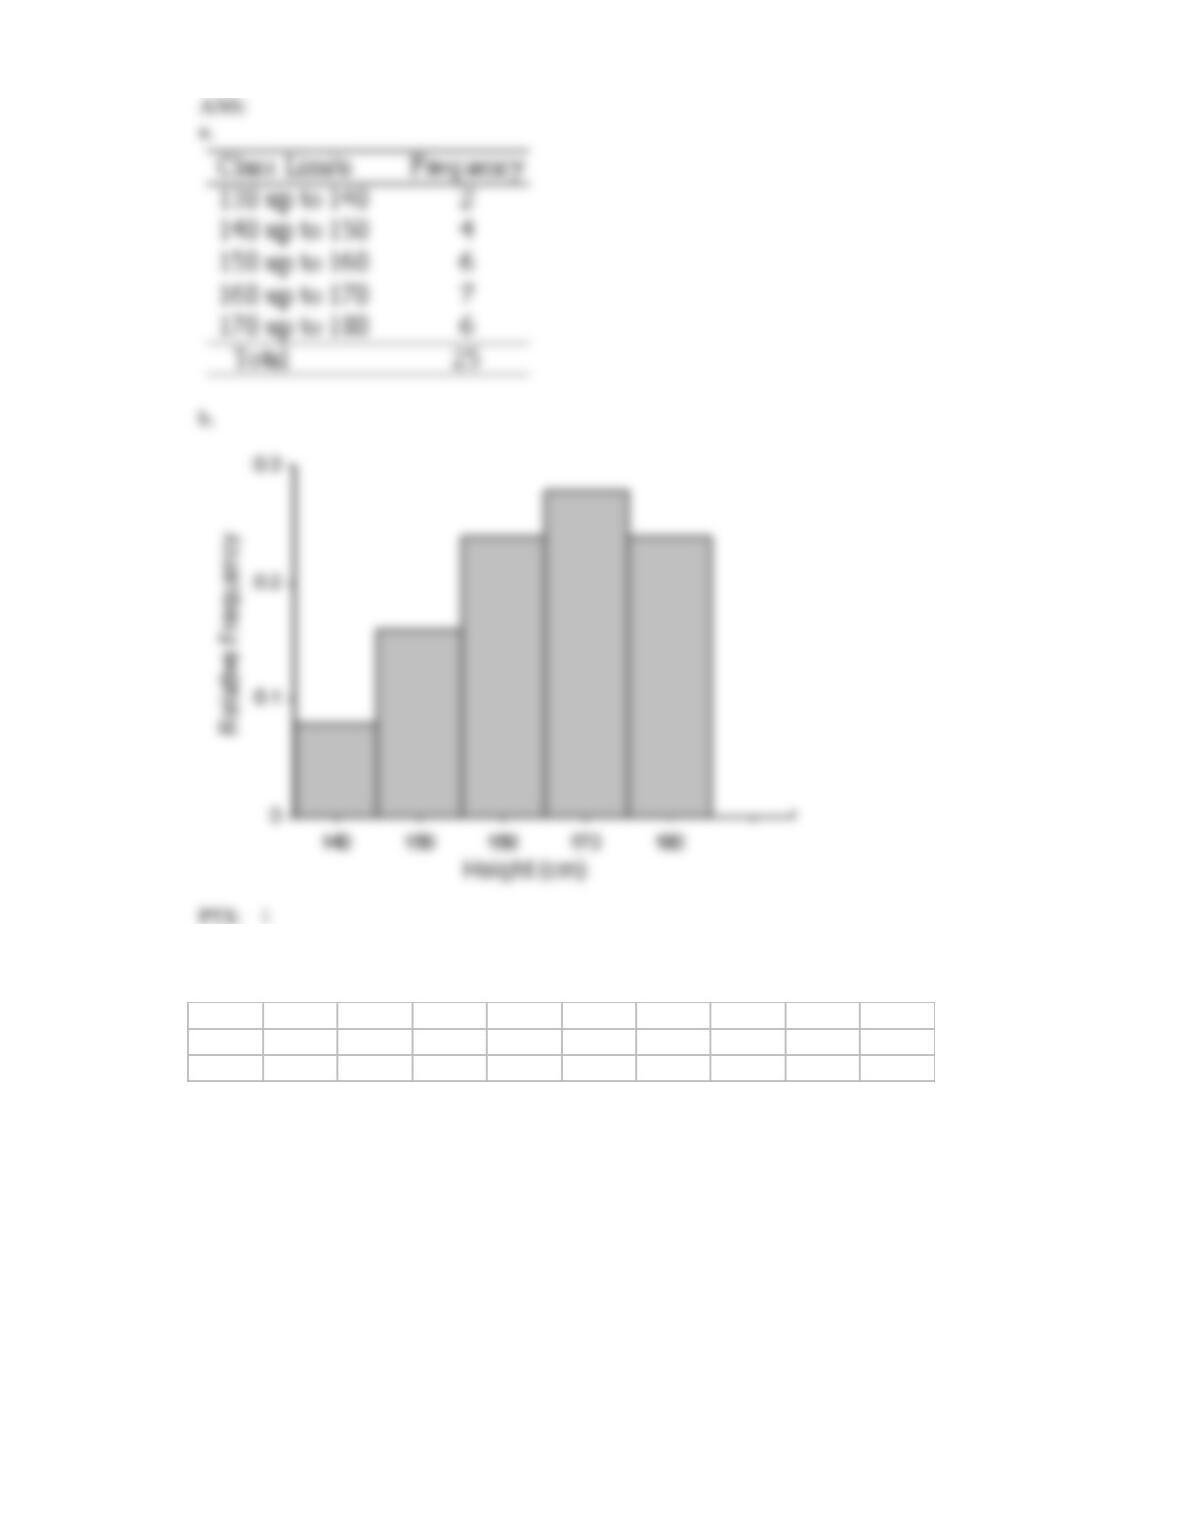
a. Construct an ogive for the data.
b. What proportion of the total area under the ogive constructed in part (a) falls between 160 and
180?
72. The following data are the heights (in cm) of the 25 students in a business statistics class:
164
148
137
157
173
156
177
172
169
165
145
168
163
162
174
152
156
168
154
151
174
146
134
140
171
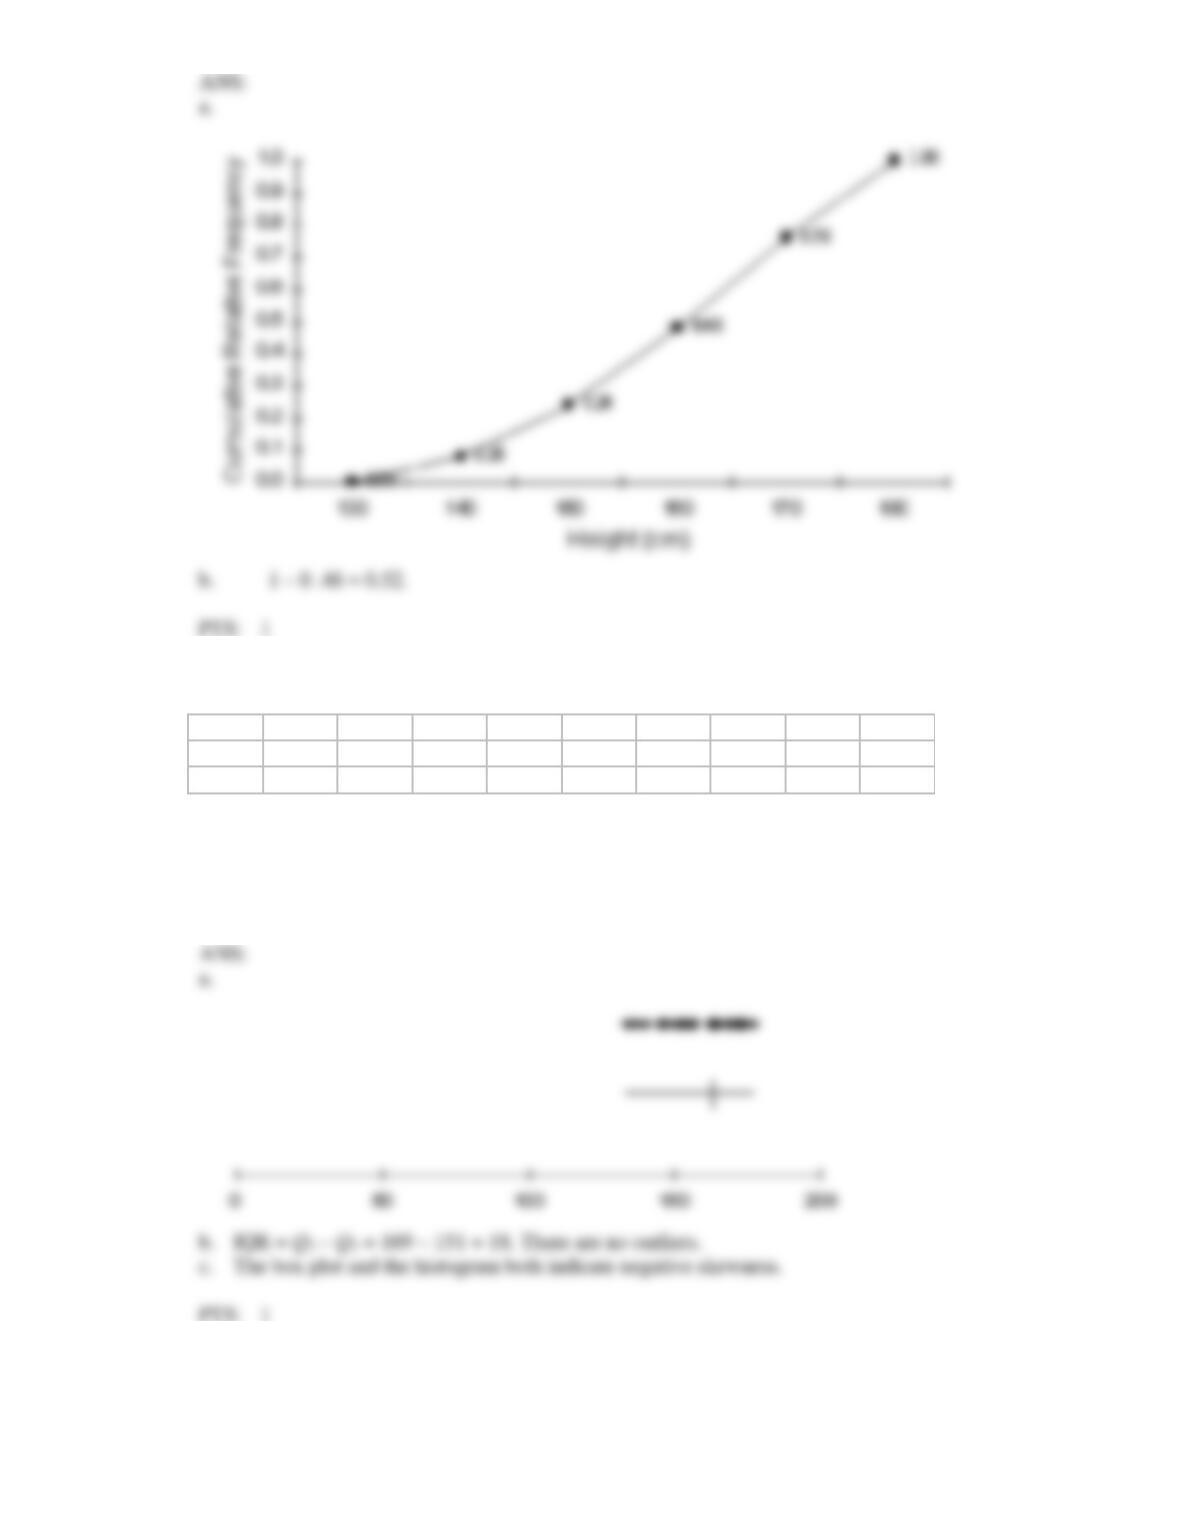
a. Construct a box plot for the heights.
b. State the interquartile range and identify any outliers.
c. Compare the information regarding skewness conveyed by your box plot with that shown by a
histogram.