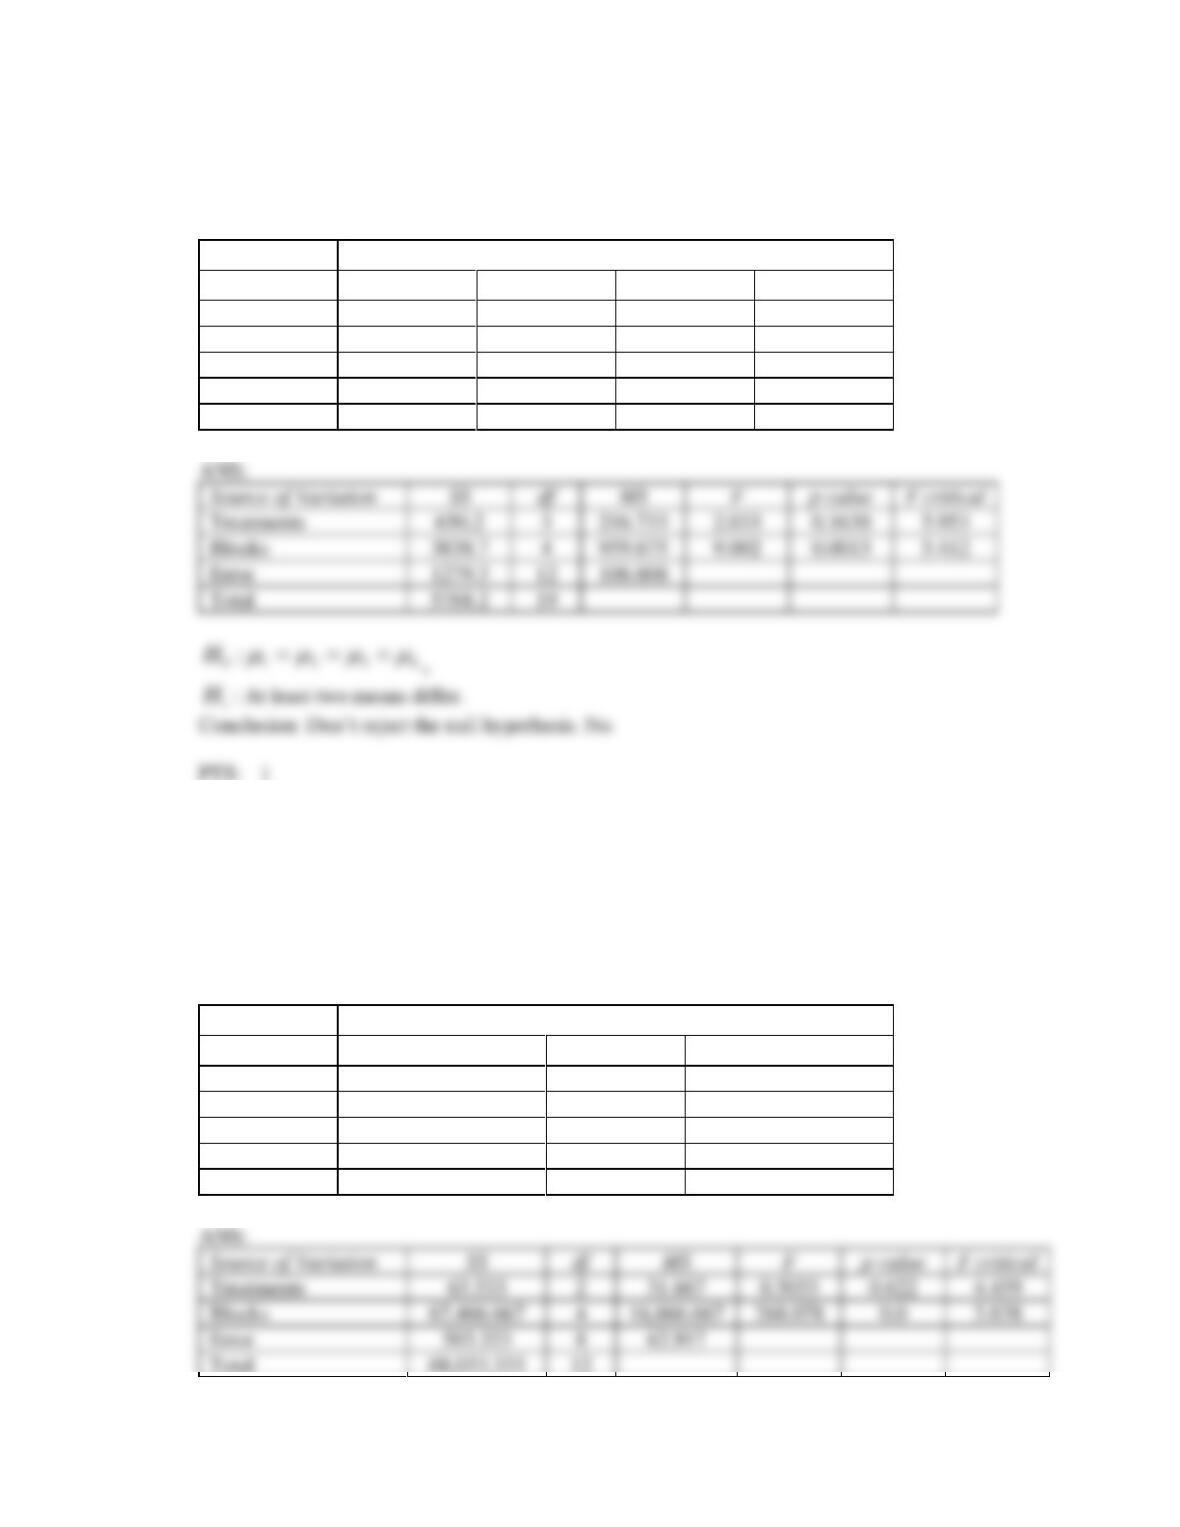
4. The following statistics were calculated based on samples drawn from four normal populations.
Treatment
Statistic
1
2
3
4
j
n
4
7
5
5
j
x
52
69
71
61
2
j
x
753
798
1248
912
Test at the 5% level of significance to determine whether differences exist among the population
means.
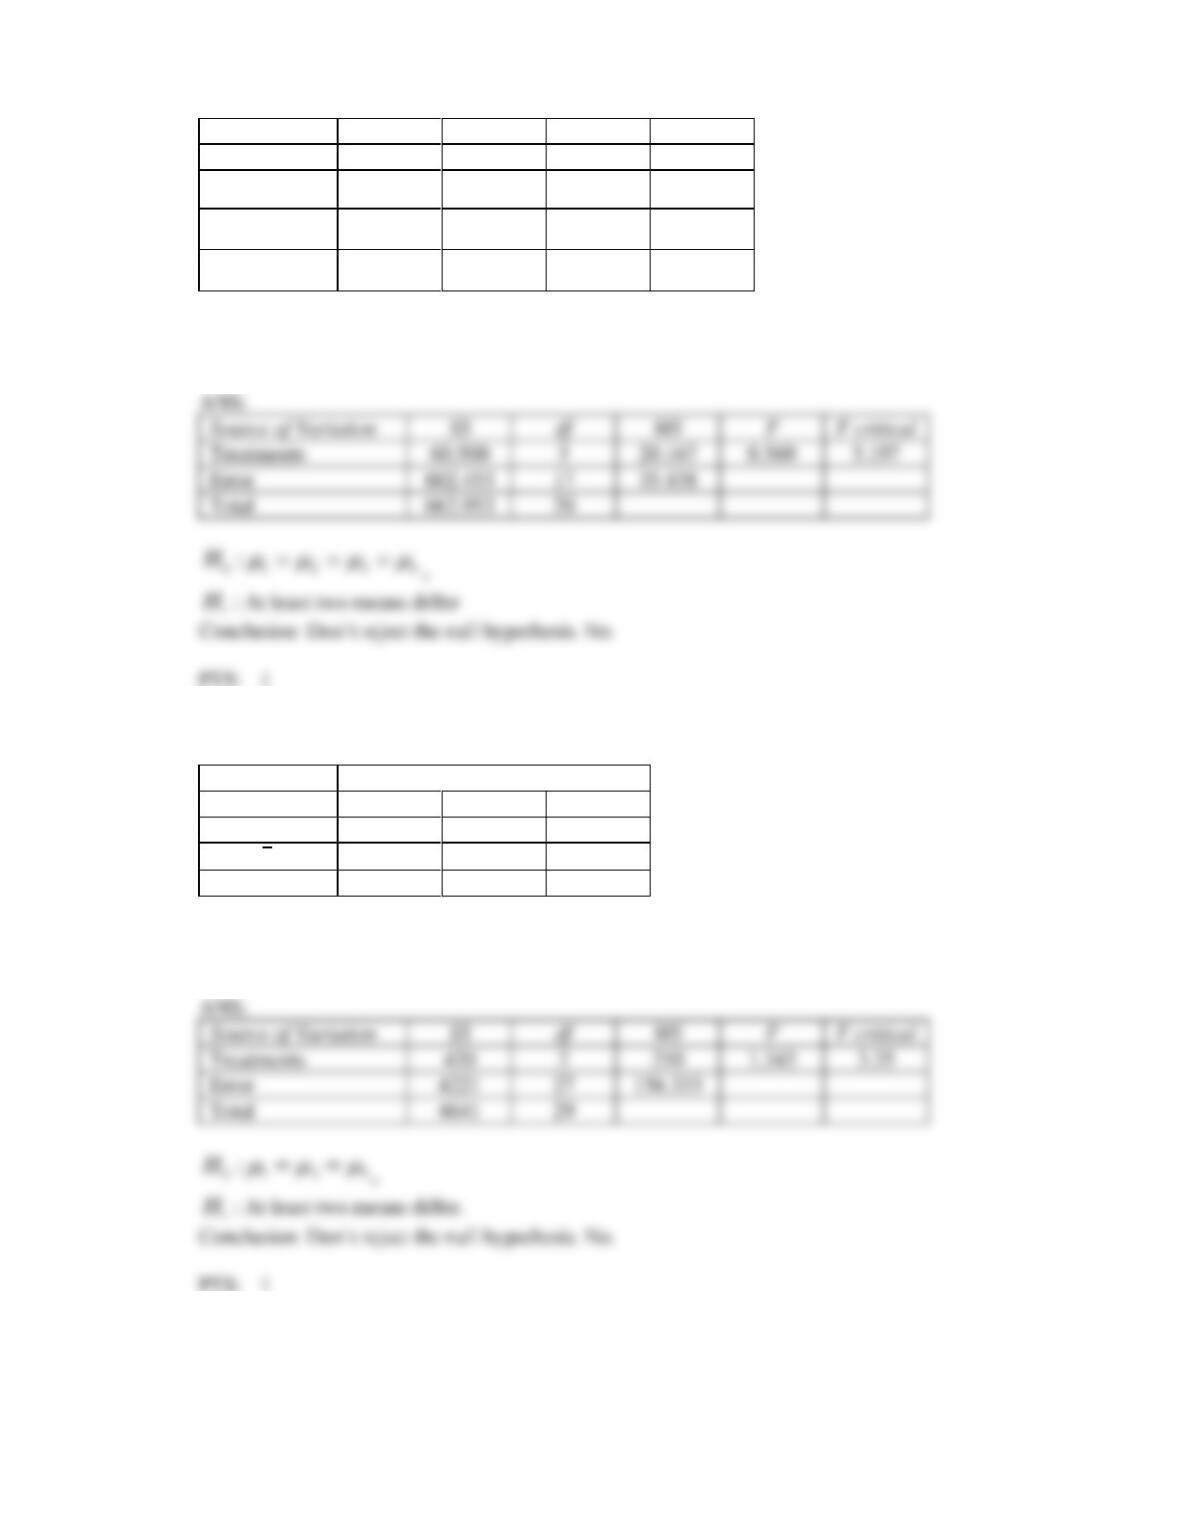
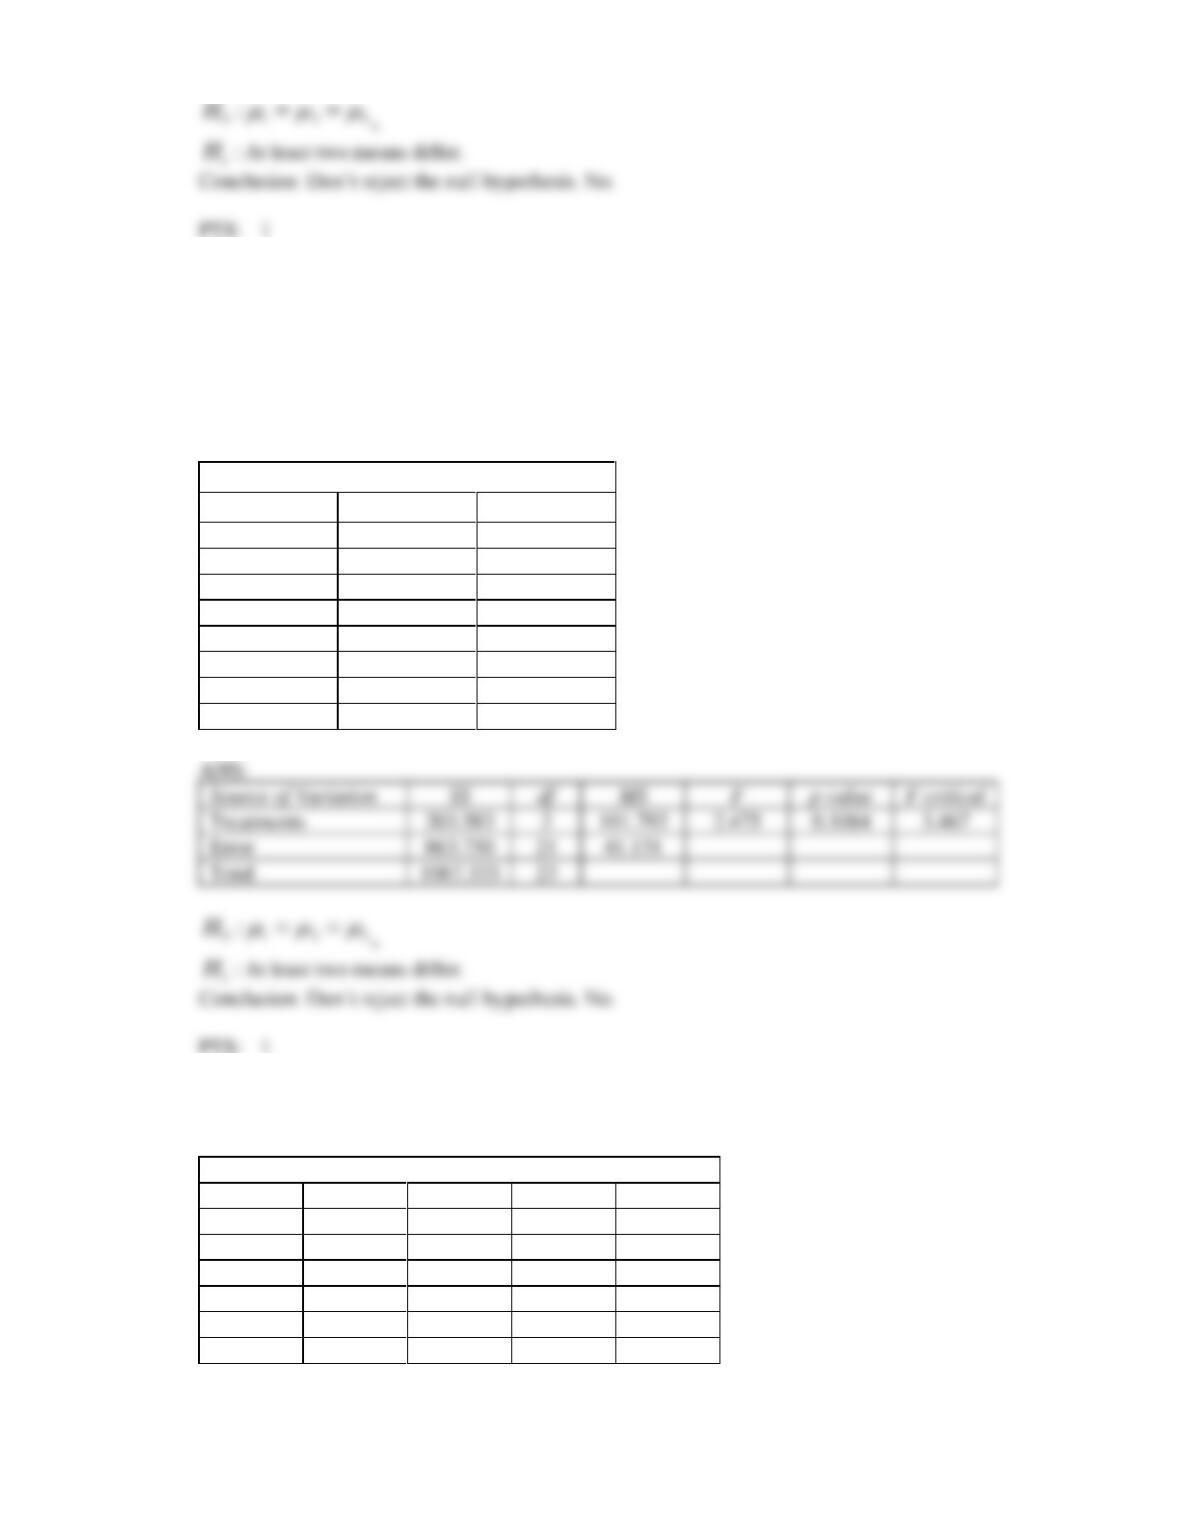
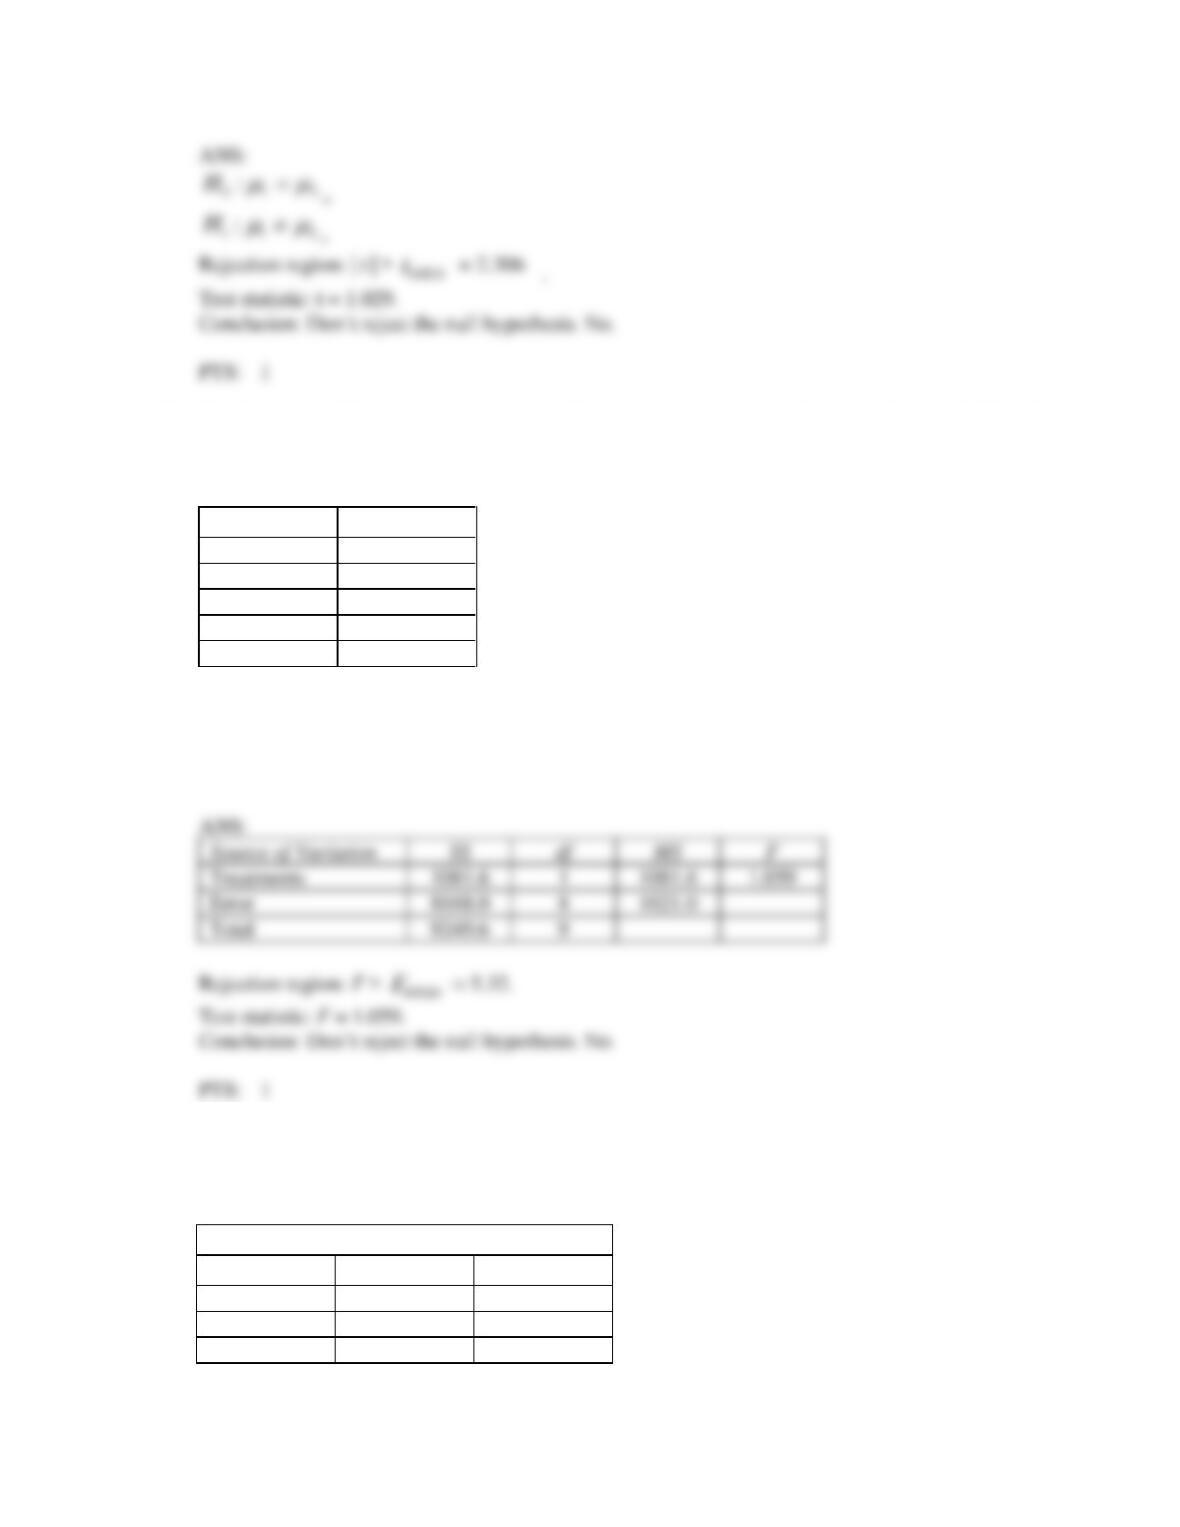
5. The following statistics were calculated based on samples drawn from three normal populations:
Treatment
Statistic
1
2
3
n
10
10
10
x
95
86
92
s
10
12
15
Set up the ANOVA table and test at the 5% level of significance to determine whether differences
exist among the population means.
2
29
6. Provide an example of a randomised block design with three treatments (k = 3) and four blocks (b = 4),
in which SSB = 0 and SST and SSE are not equal to zero.
3
17
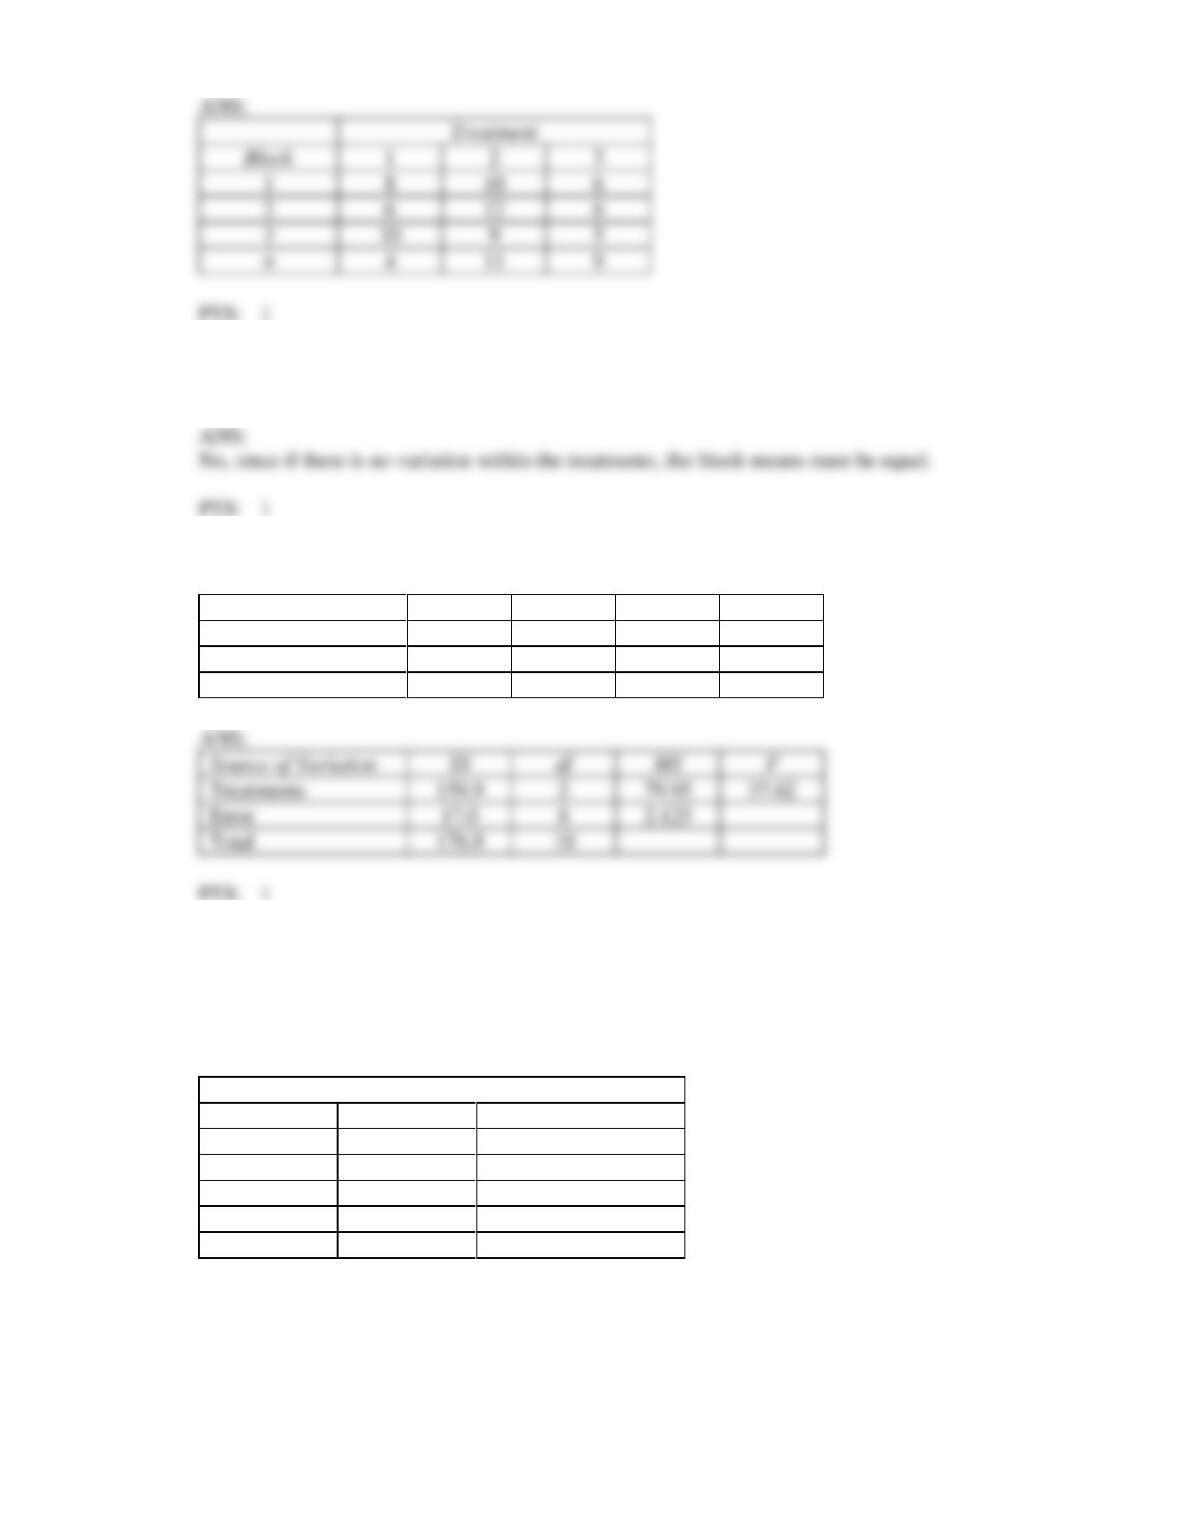
7. Is it possible to have a randomised block design of the analysis of variance in which SSE = 0 and SSB
is not equal to zero? Explain.
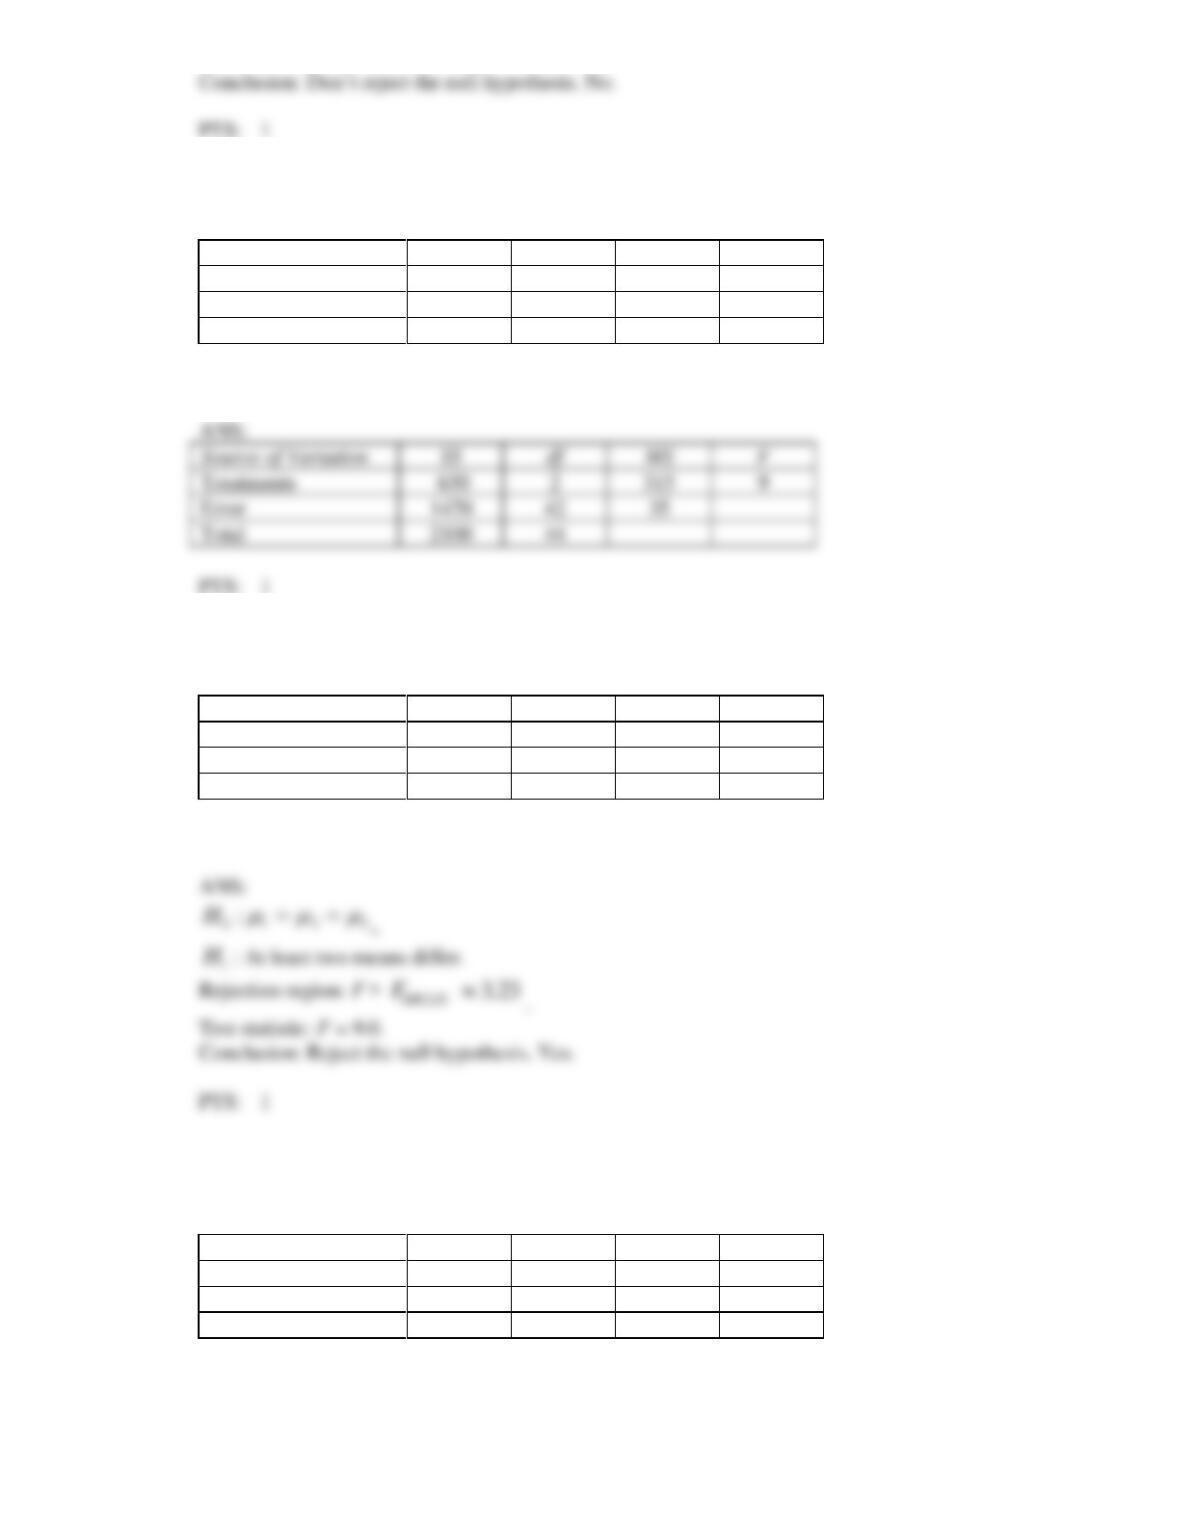
8. Fill in the blanks (identified by asterisks) in the following partial ANOVA table.
Source of Variation
SS
df
MS
F
Treatments
*
*
79.95
*
Error
17.0
*
*
Total
176.9
10
Treatments
159.9
2
79.95
37.62
Error
17.0
8
2.125
Total
176.9
9. A statistician employed by a television rating service wanted to determine whether there were
differences in television viewing habits among three different towns in NSW. She took a random
sample of five adults in each of the cities and asked each to report the number of hours spent watching
television in the previous week. From the data shown below, can she infer at the 5% significance level
that differences in hours of television watching exist among the three towns?
Hours spent watching television
Armidale
Newcastle
Wagga Wagga
25
28
23
31
33
18
18
35
21
23
29
17
27
36
15
1
2
3
8
10
6
6
6
9
5
4
11
9
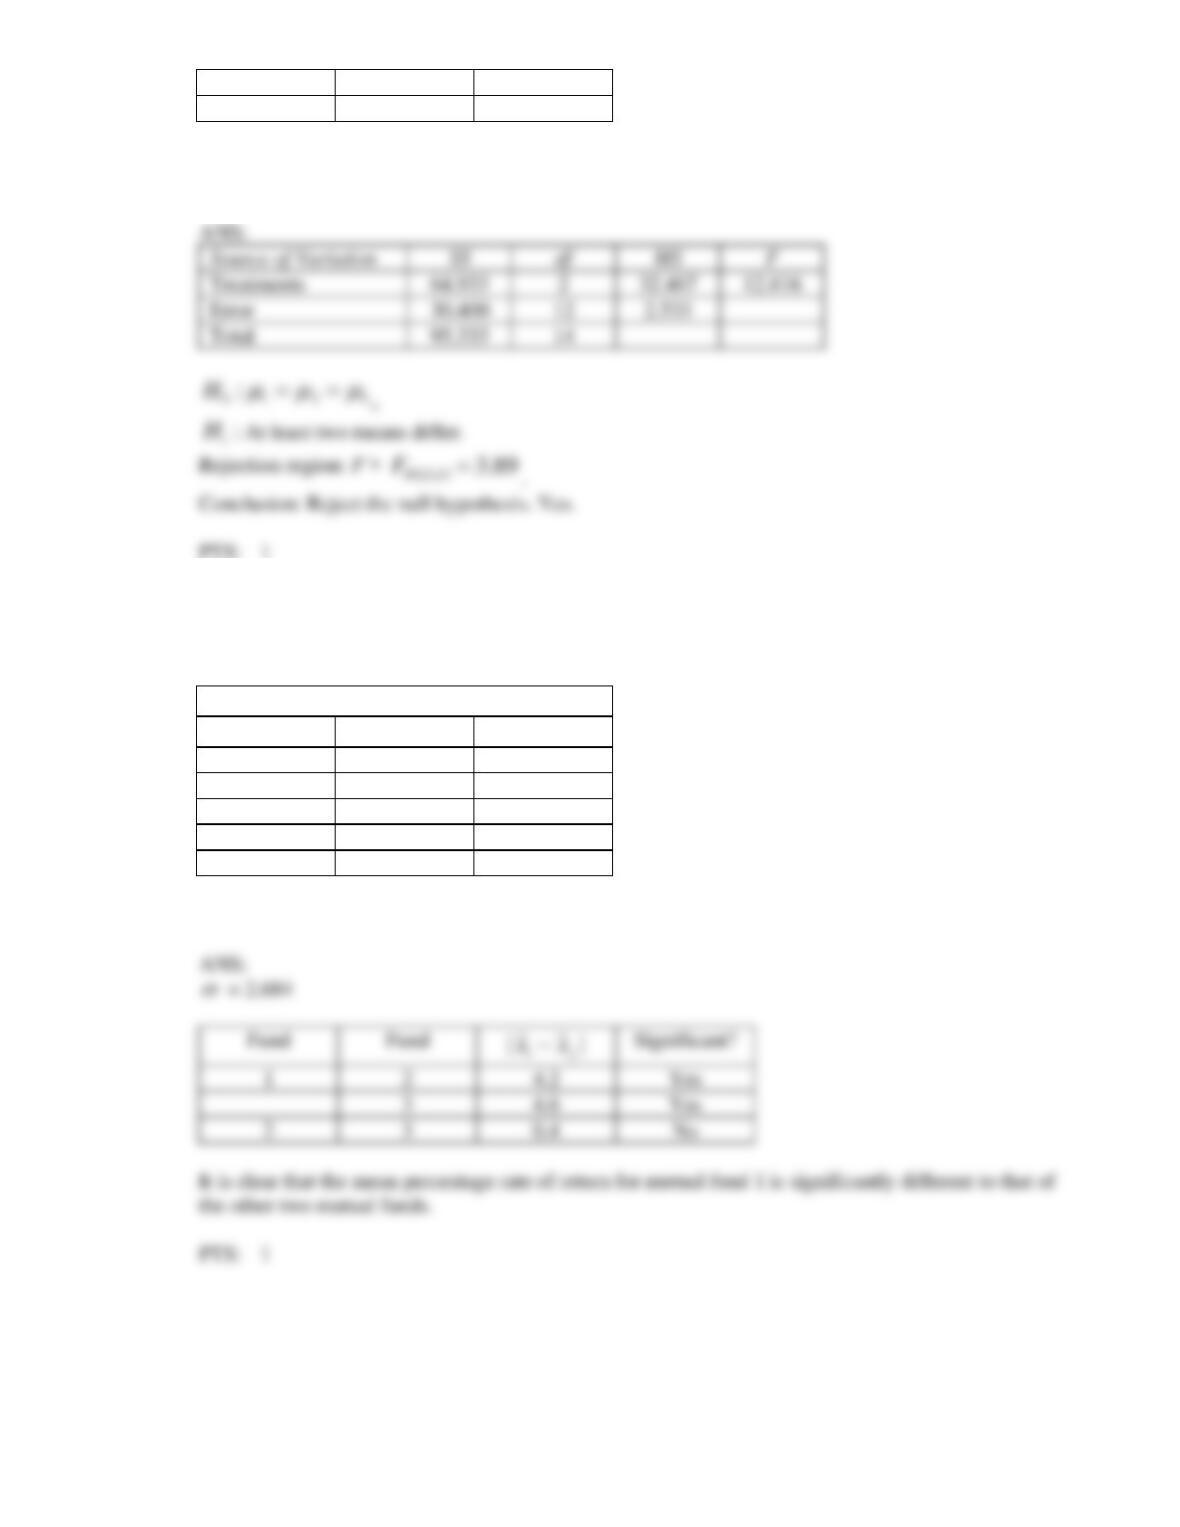
10. A pharmaceutical manufacturer has been researching new formulas to provide quicker relief of minor
pains. His laboratories have produced three different formulas, which he wanted to test. Fifteen people
who complained of minor pains were recruited for an experiment. Five were given formula 1, five
were given formula 2, and the last five were given formula 3. Each was asked to take the medicine and
report the length of time until some relief was felt. The results are shown below. Do these data provide
sufficient evidence to indicate that differences in the time of relief exist among the three formulas? Use
= 0.05.
Time in minutes until relief is felt
Formula 1
Formula 2
Formula 3
4
2
6
8
5
7
6
3
7
9
7
8
8
1
6
11. Automobile insurance appraisers examine cars that have been involved in accidental collisions and
estimate the cost of repairs. An insurance executive claims that there are significant differences in the
estimates from different appraisers. To support his claim he takes a random sample of six cars that
have recently been damaged in accidents. Three appraisers then estimate the repair costs of all six cars.
From the data shown below, can we infer at the 5% significance level that the executive’s claim is
true?
Estimated repair cost
Car
Appraiser 1
Appraiser 2
Appraiser 3
1
650
600
750
2
930
910
1010
3
440
450
500
4
750
710
810
5
1190
1050
1250
6
1560
1270
1450
12. The strength of a weld depends to some extent on the metal alloy used in the welding process. A
scientist working in the research laboratory of a major automobile manufacturer has developed three
new alloys. In order to test their strengths, each alloy is used in several welds. The strengths of the
welds are then measured, with the results shown below. Can the scientist conclude at the 5%
significance level that differences exist among the strengths of the welds with the different alloys?
Strength of welds
Alloy 1
Alloy 2
Alloy 3
15
17
25
23
21
27
16
19
24
29
25
31
28
23
19
13. In recent years the irradiation of food to reduce bacteria and preserve the food longer has become more
common. A company that performs this service has developed four different methods of irradiating
food. To determine which is best, it conducts an experiment where different foods are irradiated and
the bacteria count is measured. As part of the experiment the following foods are irradiated: beef,
chicken, turkey, eggs, and milk. The results are shown below. Can the company infer at the 1%
significance level that differences in the bacteria count exist among the four irradiation methods?
Bacteria count
Food
Method 1
Method 2
Method 3
Method 4
Beef
47
53
36
68
Chicken
53
61
48
75
Turkey
68
85
55
45
Eggs
25
24
20
27
Milk
44
48
38
46
14. In recent years a controversy has arisen in major league baseball in the US. Some players have been
accused of ‘doctoring’ their bats to increase the distance the ball travels. However, a physics professor
claims that the effect of doctoring is negligible. A major league manager decides to test the professor’s
claim. He doctors two bats by inserting cork into one and rubber into another. He then tells five
players on his team to hit a ball with an undoctored bat and with the doctored bats. The distances are
measured, and are listed below. Do these data provide sufficient evidence at the 5% level of
significance to refute the professor’s claim?
Distance ball travels (feet)
Player
Undoctored bat
Bat with cork
Bat with rubber
1
275
265
280
2
315
335
320
3
425
435
440
4
380
375
370
5
450
460
450
Treatments
Blocks
Error
Total
Treatments
Blocks
Error
Total
15. The marketing manager of a pizza chain is in the process of examining some of the demographic
characteristics of her customers. In particular, she would like to investigate the belief that the ages of
the customers of pizza parlours, hamburger emporiums and fast-food chicken restaurants are different.
As an experiment, the ages of eight customers of each of the restaurants are recorded and listed below.
Do these data provide enough evidence at the 5% significance level to infer that there are differences
in ages among the customers of the three restaurants? From previous analyses we know that the ages
are normally distributed.
Customer age
Pizza
Hamburger
Chicken
23
26
25
19
20
28
25
18
36
17
35
23
36
33
39
25
25
27
28
19
38
31
17
31
16. In order to examine the differences in age of teachers among five school districts, an educational
statistician took random samples of six teachers’ ages in each district. The data are listed below.
Ages of teachers among five school districts
1
2
3
4
5
42
23
45
31
37
22
52
48
45
40
33
32
50
33
45
32
44
45
38
61
26
39
37
29
50
24
33
49
46
50
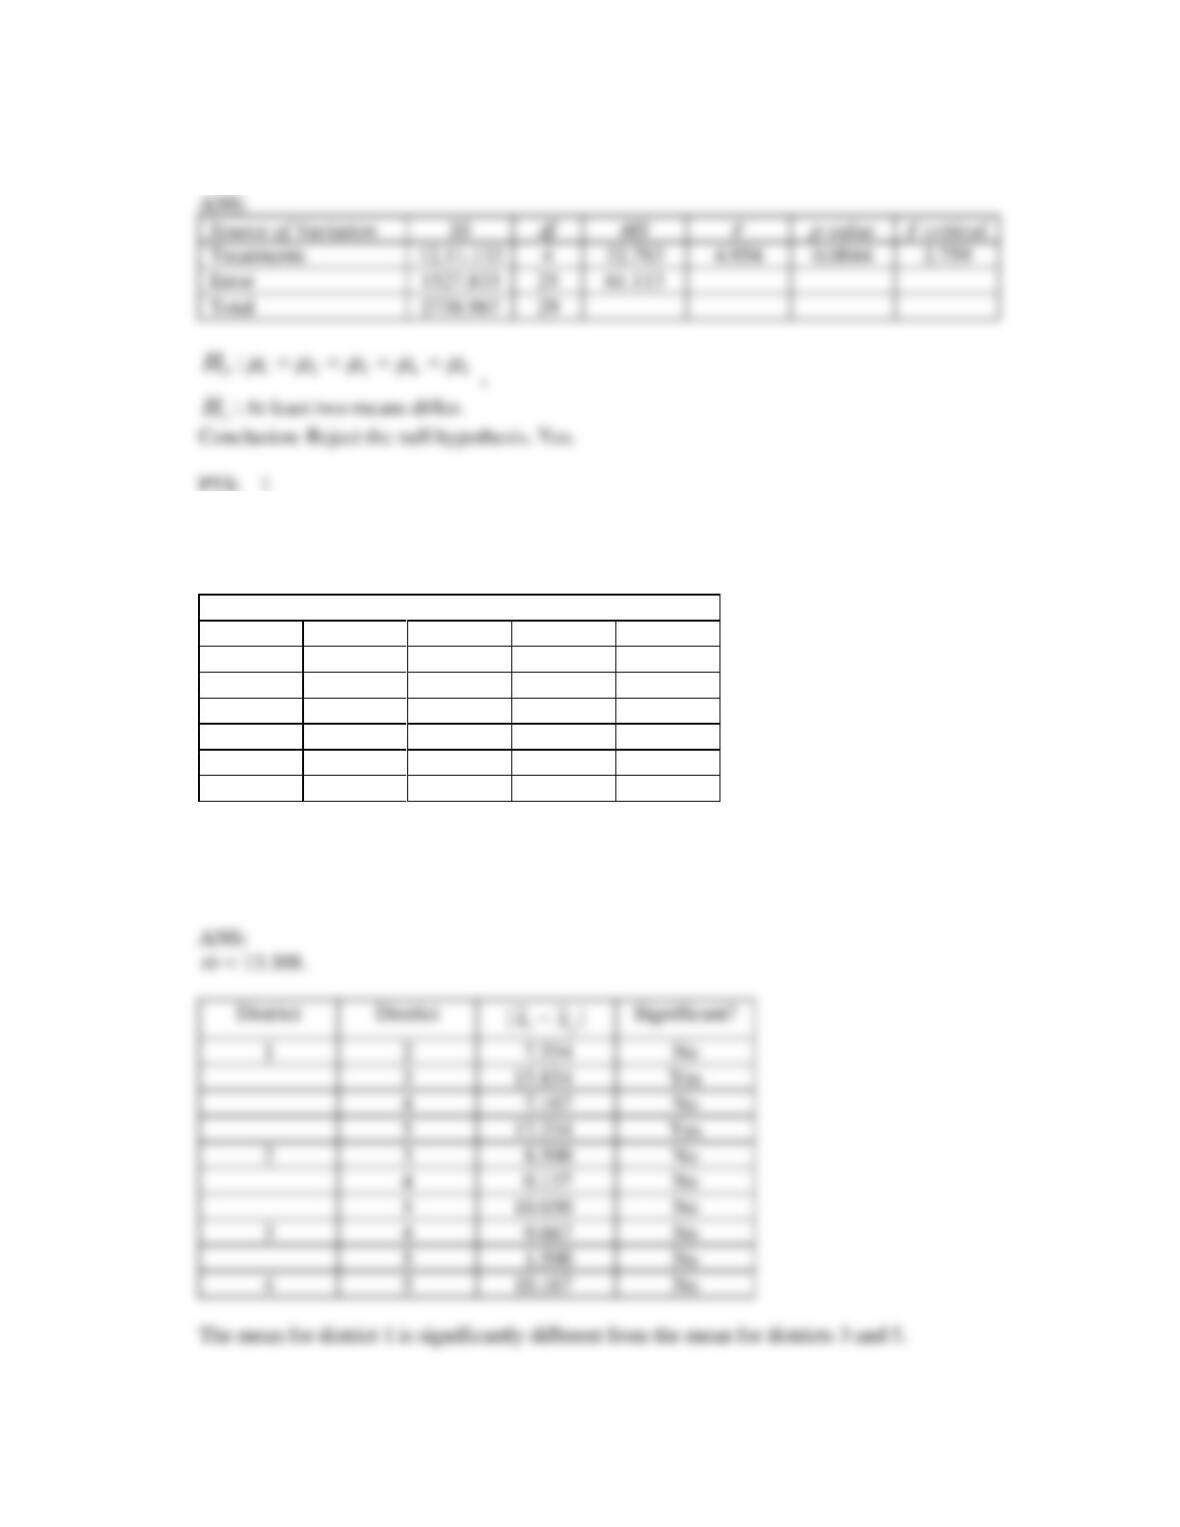
Assume that ages of teachers are normally distributed.
Test at the 5% significance level to determine whether differences in teachers’ ages exist among the
five districts.
17. In order to examine the differences in age of teachers among five school districts, an educational
statistician took random samples of six teachers’ ages in each district. The data are listed below.
Ages of teachers among five school districts
1
2
3
4
5
42
23
45
31
37
22
52
48
45
40
33
32
50
33
45
32
44
45
38
61
26
39
37
29
50
24
33
49
46
50
Assume that ages of teachers are normally distributed.
Use Tukey’s multiple comparison method to determine which means differ.
8.500
9.667
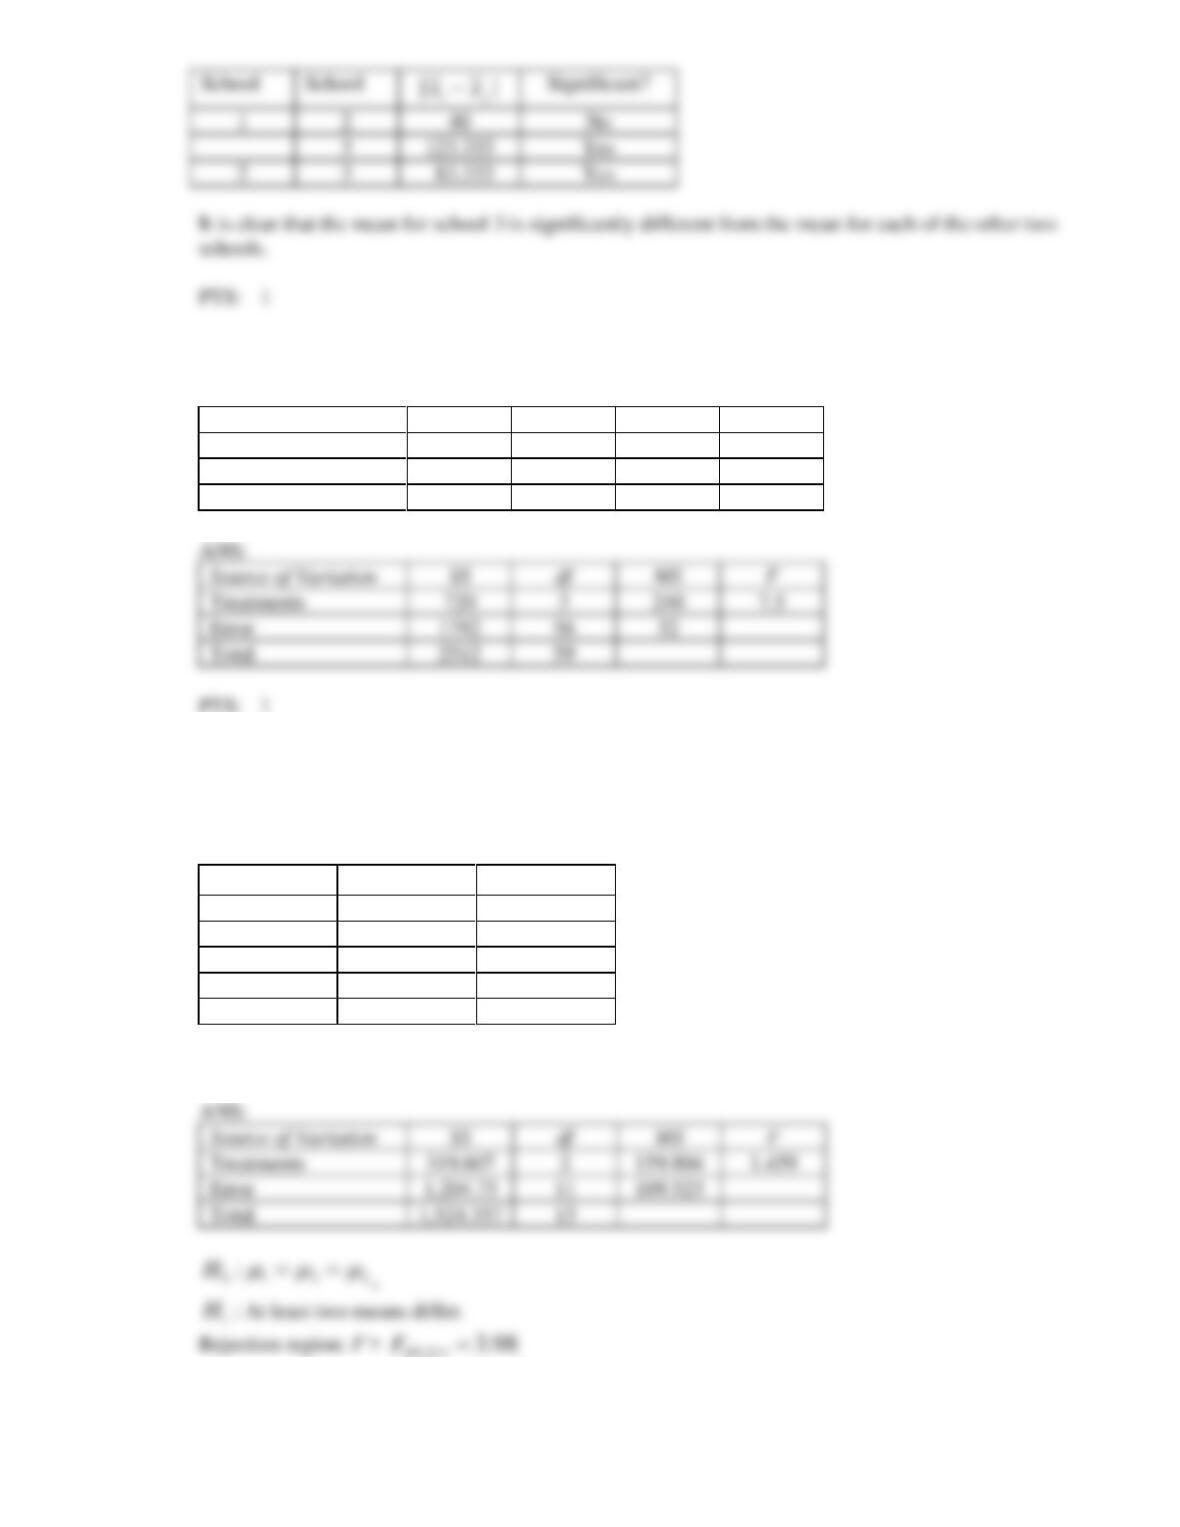
18. A recent college graduate is in the process of deciding which one of three US graduate schools he
should apply to. He decides to judge the quality of the schools on the basis of the Graduate
Management Admission Test (GMAT) scores of those who are accepted into the school. A random
sample of six students in each school produced the following GMAT scores.
GMAT Scores
School 1
School 2
School 3
650
510
590
620
550
510
630
700
520
580
630
500
710
600
490
690
650
530
Assuming that the data are normally distributed, can he infer at the 10% significance level that the
GMAT scores differ among the three schools?
19. A recent college graduate is in the process of deciding which one of three US graduate schools he
should apply to. He decides to judge the quality of the schools on the basis of the Graduate
Management Admission Test (GMAT) scores of those who are accepted into the school. A random
sample of six students in each school produced the following GMAT scores.
GMAT Scores
School 1
School 2
School 3
650
510
590
620
550
510
630
700
520
580
630
500
710
600
490
690
650
530
Use Tukey’s method with
=0.05 to determine which population means differ.
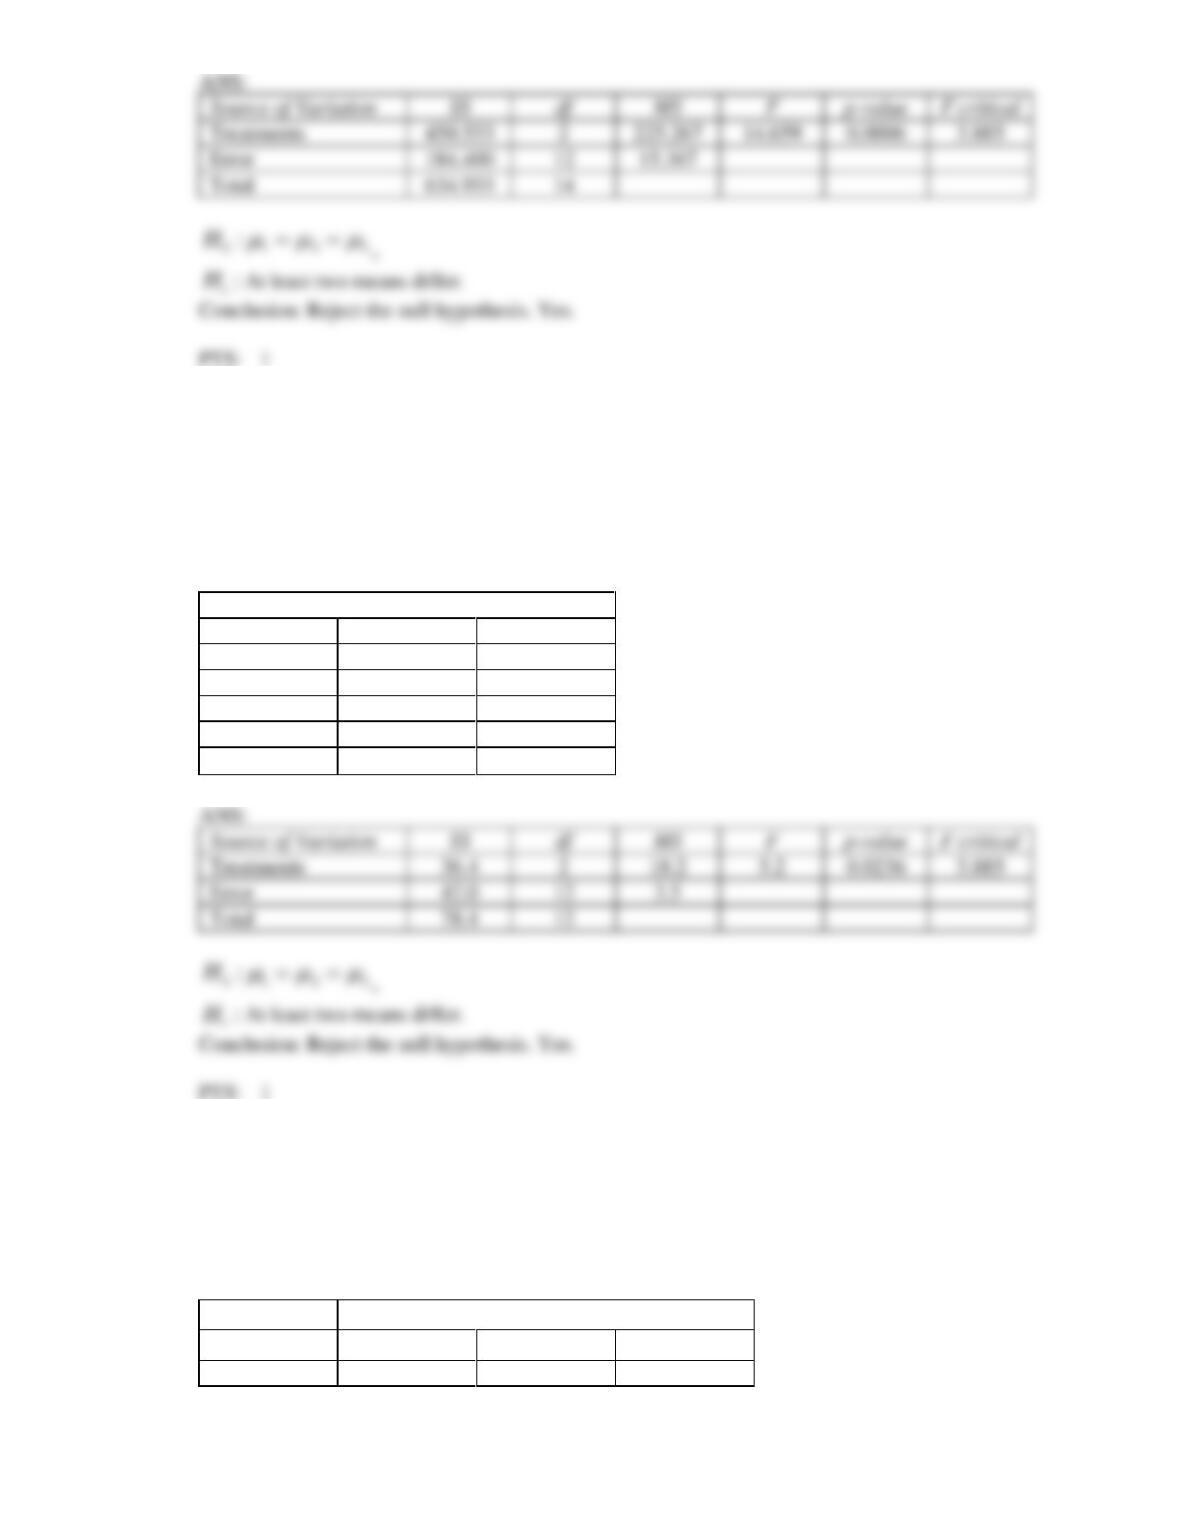
20. In a completely randomised design, 15 experimental units were assigned to each of four treatments.
Fill in the blanks (identified by asterisks) in the partial ANOVA table shown below.
Source of Variation
SS
df
MS
F
Treatments
*
*
240
*
Error
*
*
*
Total
2512
*
Treatments
3
Error
1792
Total
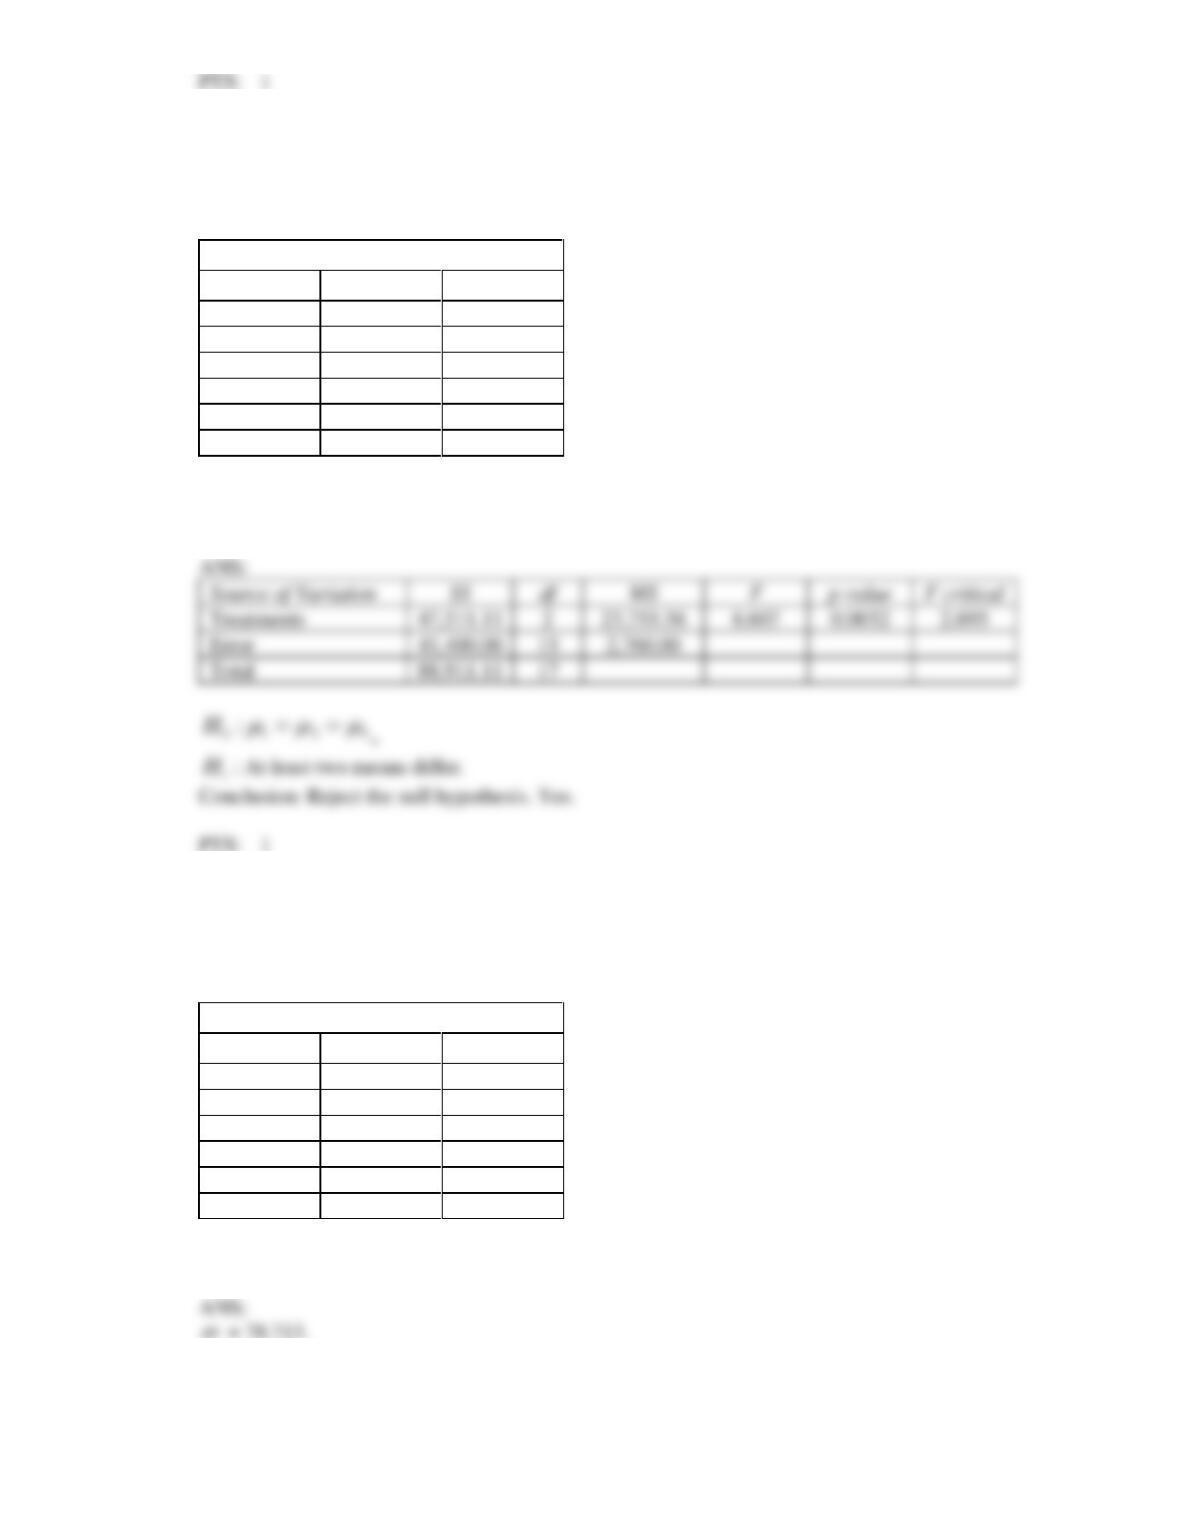
21. A statistics professor has carried out a study to compare different teaching methods used in three
different sections of an elementary statistics course. A sample of students has been randomly selected
from each section, and their grades in the final test, as shown below, are used to determine whether the
teaching methods used made any difference.
Method 1
Method 2
Method 3
84
78
97
70
85
89
72
93
81
67
66
73
99
77
Can we infer at the 5% significance level that the population means of the three methods differ?
Source of Variation
SS
df
F
Treatments
Error
Total
1,524.357
.
22. In a completely randomised design, 12 experimental units were assigned to the first treatment, 15 units
to the second treatment, and 18 units to the third treatment. A partial ANOVA table is shown below:
Source of Variation
SS
df
MS
F
Treatments
*
*
*
9
Error
*
*
35
Total
*
*
Fill in the blanks (identified by asterisks) in the above ANOVA table.
Source of Variation
df
F
Treatments
Error
Total
23. In a completely randomised design, 12 experimental units were assigned to the first treatment, 15 units
to the second treatment, and 18 units to the third treatment. A partial ANOVA table is shown below:
Source of Variation
SS
df
MS
F
Treatments
*
*
*
9
Error
*
*
35
Total
*
*
Test at the 5% significance level to determine if differences exist among the three treatment means.
24. In a completely randomised design, 7 experimental units were assigned to the first treatment, 13 units
to the second treatment, and 10 units to the third treatment. A partial ANOVA table for this experiment
is shown below.
Source of Variation
SS
df
MS
F
Treatments
*
*
*
1.50
Error
*
*
4
Total
*
*
Fill in the blanks (identified by asterisks) in the above ANOVA table.
25. In a completely randomised design, 7 experimental units were assigned to the first treatment, 13 units
to the second treatment, and 10 units to the third treatment. A partial ANOVA table for this experiment
is shown below.
Source of Variation
SS
df
MS
F
Treatments
*
*
*
1.50
Error
*
*
4
Total
*
*
Test at the 5% significance level to determine whether differences exist among the three treatment
means.
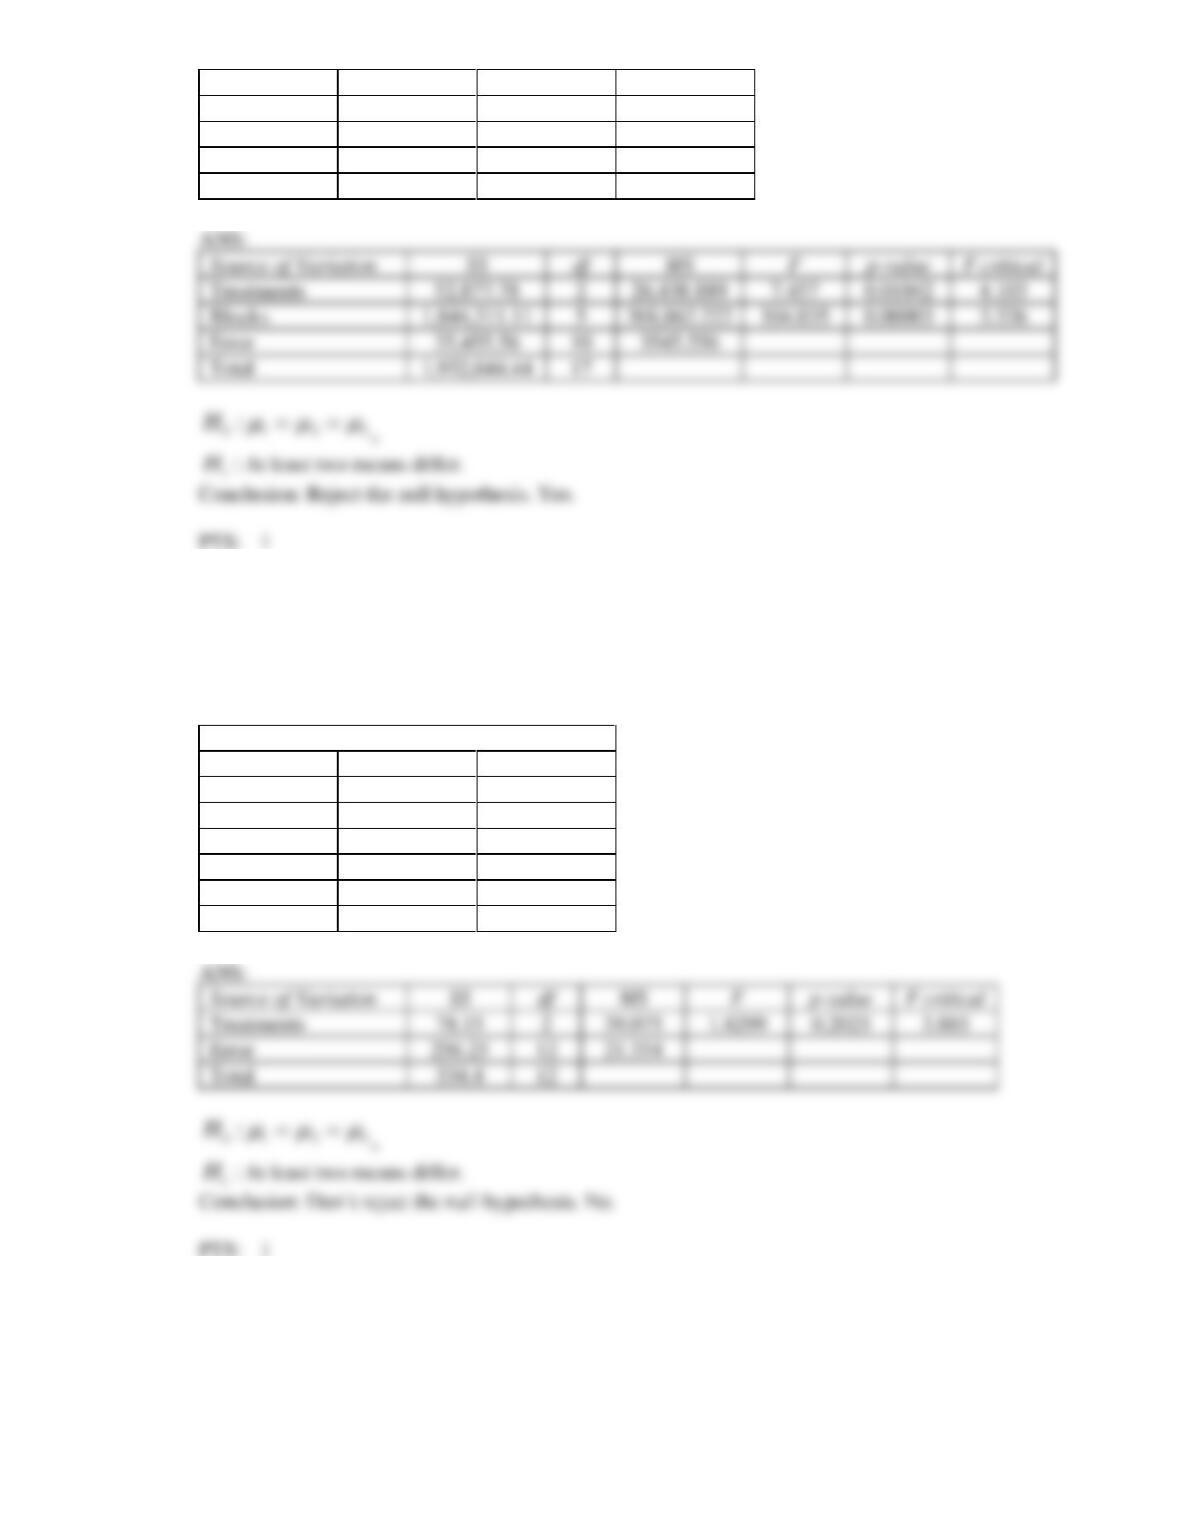
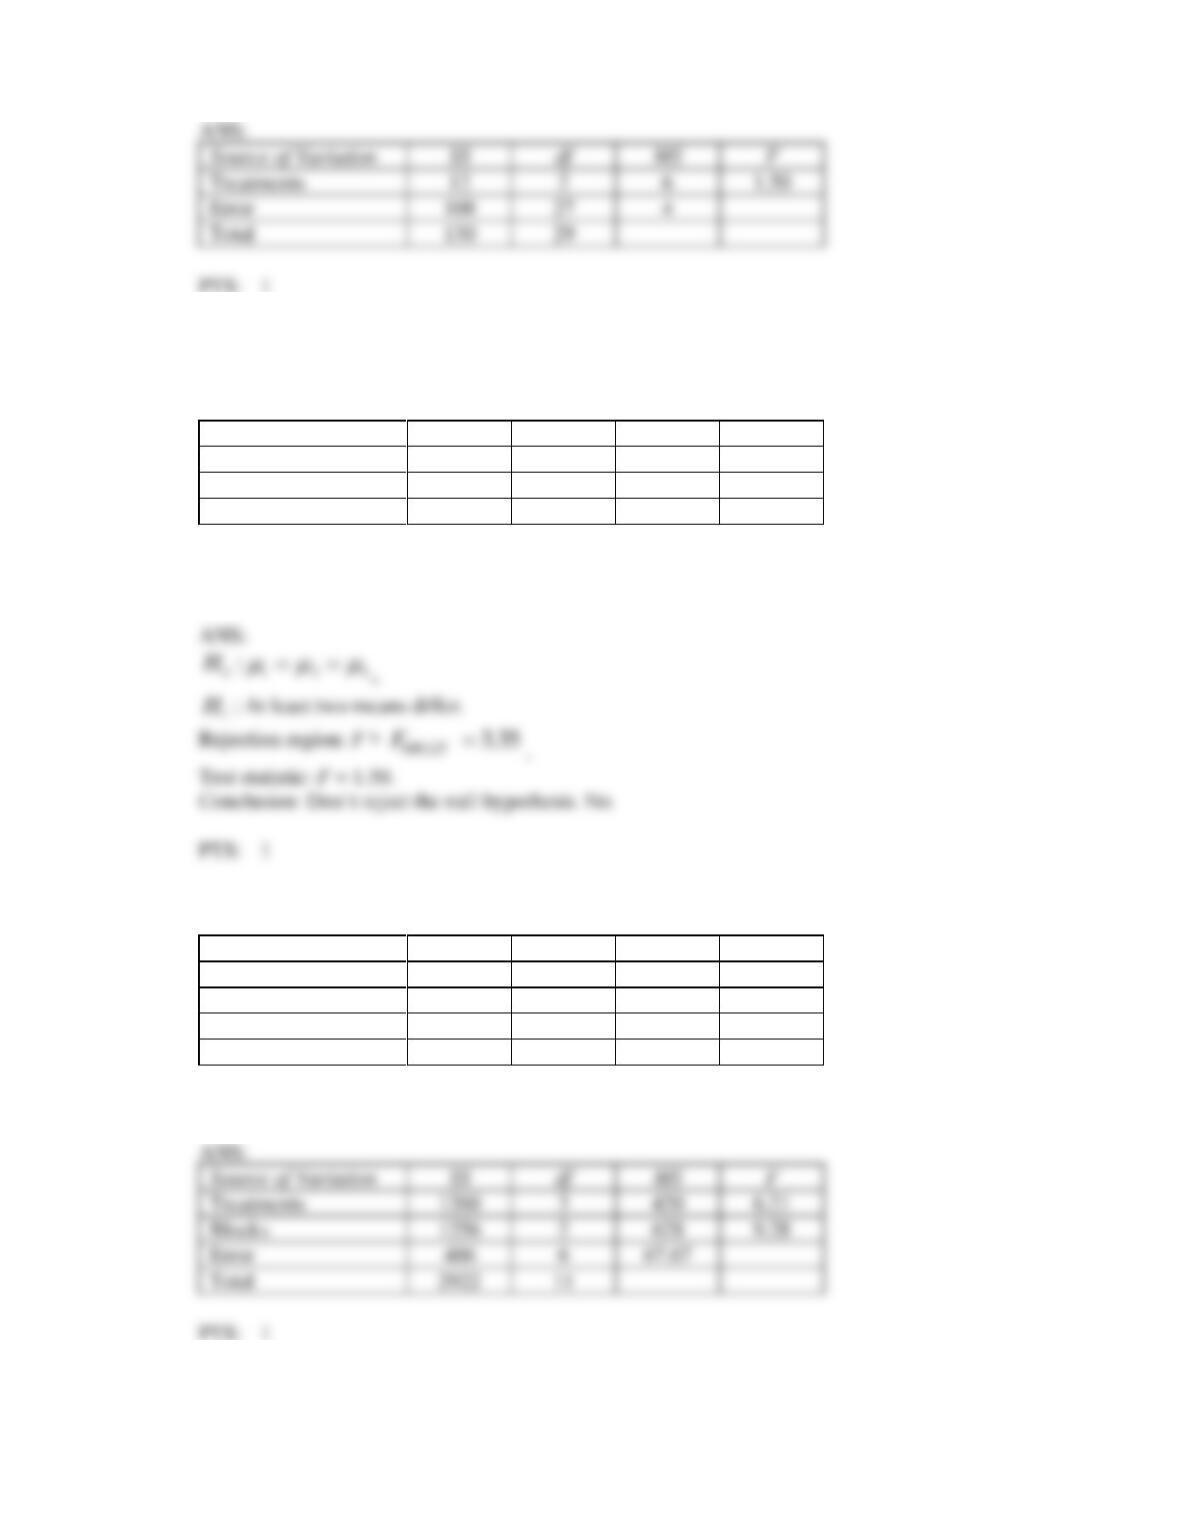
26. A partial ANOVA table in a randomised block design is shown below.
Source of Variation
SS
df
MS
F
Treatments
*
3
*
*
Blocks
1256
2
*
*
Error
*
*
67.67
Total
2922
11
Fill in the missing values (identified by asterisks) in the above ANOVA table.
Treatments
1260
3
6.21
Blocks
1256
2
9.28
Error
6
Total
2922
Source of Variation
SS
df
MS
F
Treatments
2
6
1.50
Error
27
4
Total
27. A partial ANOVA table in a randomised block design is shown below.
Source of Variation
SS
df
MS
F
Treatments
*
3
*
*
Blocks
1256
2
*
*
Error
*
*
67.67
Total
2922
11
Can we infer at the 5% significance level that the treatment means differ?
28. A partial ANOVA table in a randomised block design is shown below.
Source of Variation
SS
df
MS
F
Treatments
*
3
*
*
Blocks
1256
2
*
*
Error
*
*
67.67
Total
2922
11
Can we infer at the 5% significance level that the block means differ?
29. The following table shows the average weekly losses of worker hours due to accidents in 2009 at five
randomly selected manufacturing firms in New South Wales and at five randomly selected
manufacturing firms in Victoria.
NSW
Victoria
45
57
73
83
46
34
124
26
33
17
Assume that the weekly losses of worker hours are normally distributed.
Perform an equal-variances t-test at the 5% significance level to determine whether the population
means differ.
30. The following table shows the average weekly losses of worker hours due to accidents in 2009 at five
randomly selected manufacturing firms in New South Wales and at five randomly selected
manufacturing firms in Victoria.
NSW
Victoria
45
57
73
83
46
34
124
26
33
17
Assume that the weekly losses of worker hours are normally distributed.
Perform an F-test for one-way ANOVA at the 5% significance level to determine whether the
population means differ.
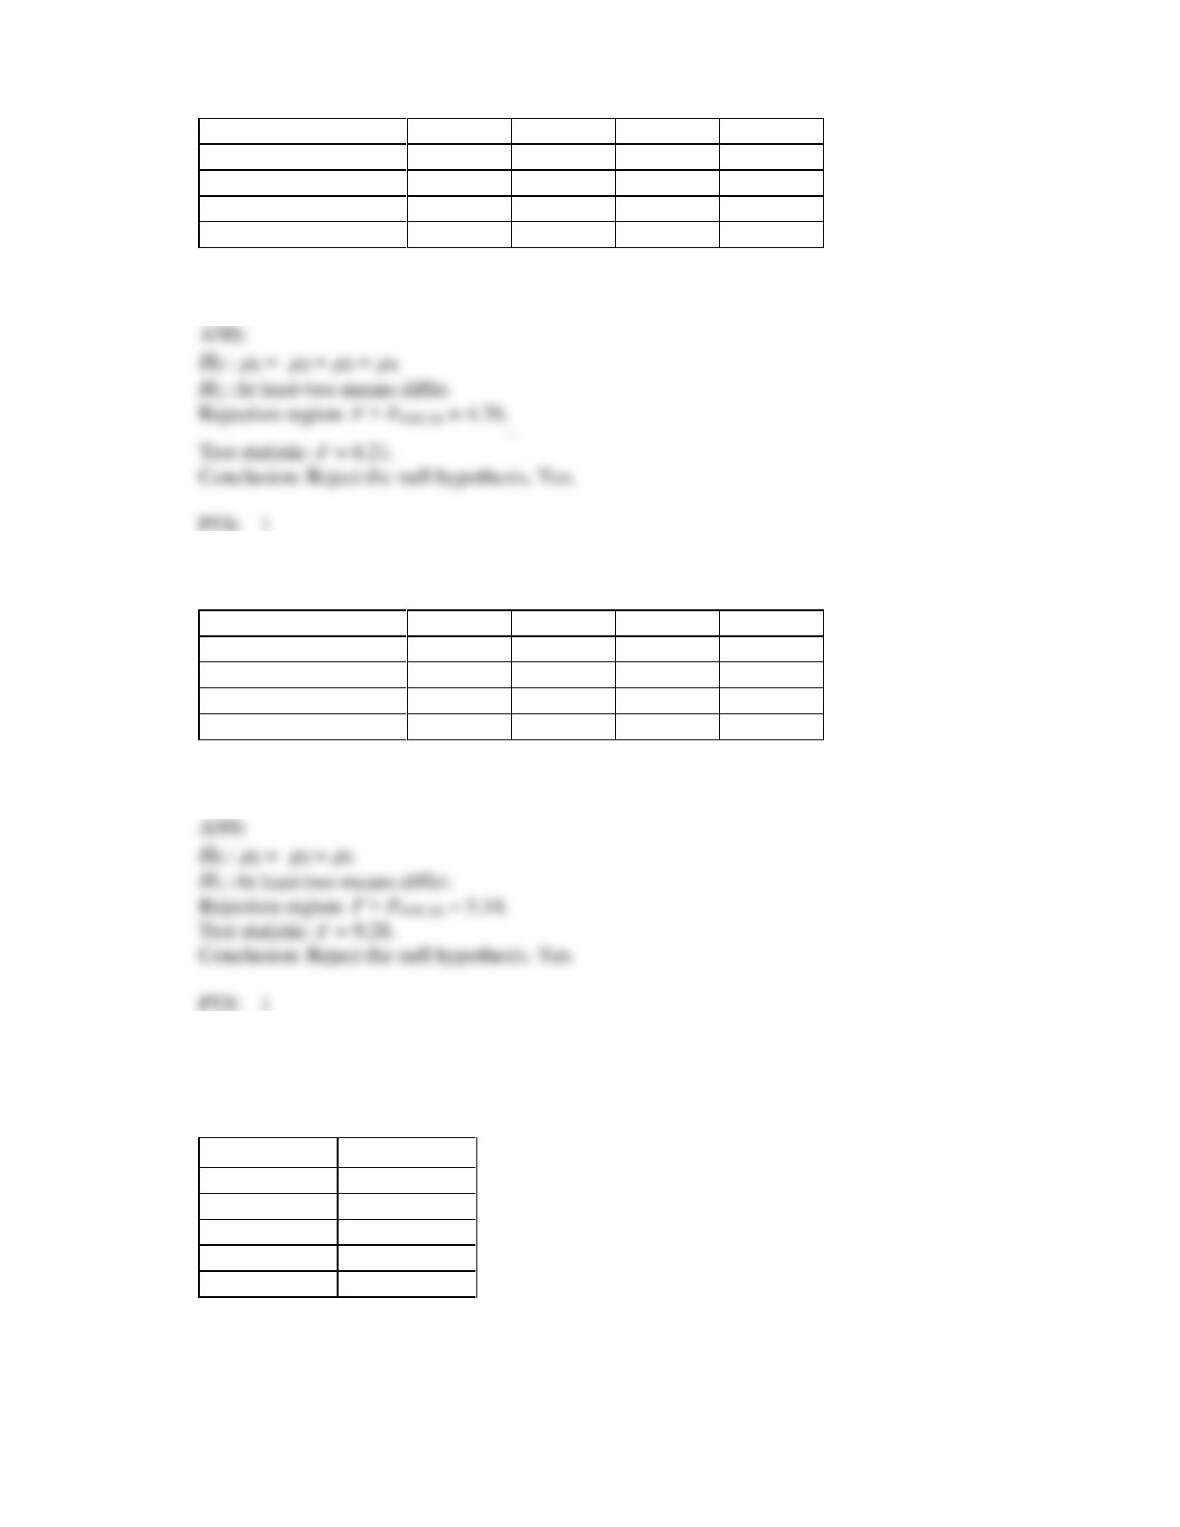
31. An investor studied the percentage rates of return of three different types of mutual funds. Random
samples of percentage rates of return for four periods were taken from each fund. The results appear in
the table below.
Mutual Funds Percentage Rates
Fund 1
Fund 2
Fund 3
12
4
9
15
8
3
13
6
5
14
5
7
17
4
4
Test at the 5% significance level to determine whether the mean percentage rates for the three funds
differ.
32. An investor studied the percentage rates of return of three different types of mutual funds. Random
samples of percentage rates of return for four periods were taken from each fund. The results appear in
the table below.
Mutual Funds Percentage Rates
Fund 1
Fund 2
Fund 3
12
4
9
15
8
3
13
6
5
14
5
7
17
4
4
Use Tukey’s method with
=.05 to determine which population means differ.
1
2
3
2
3
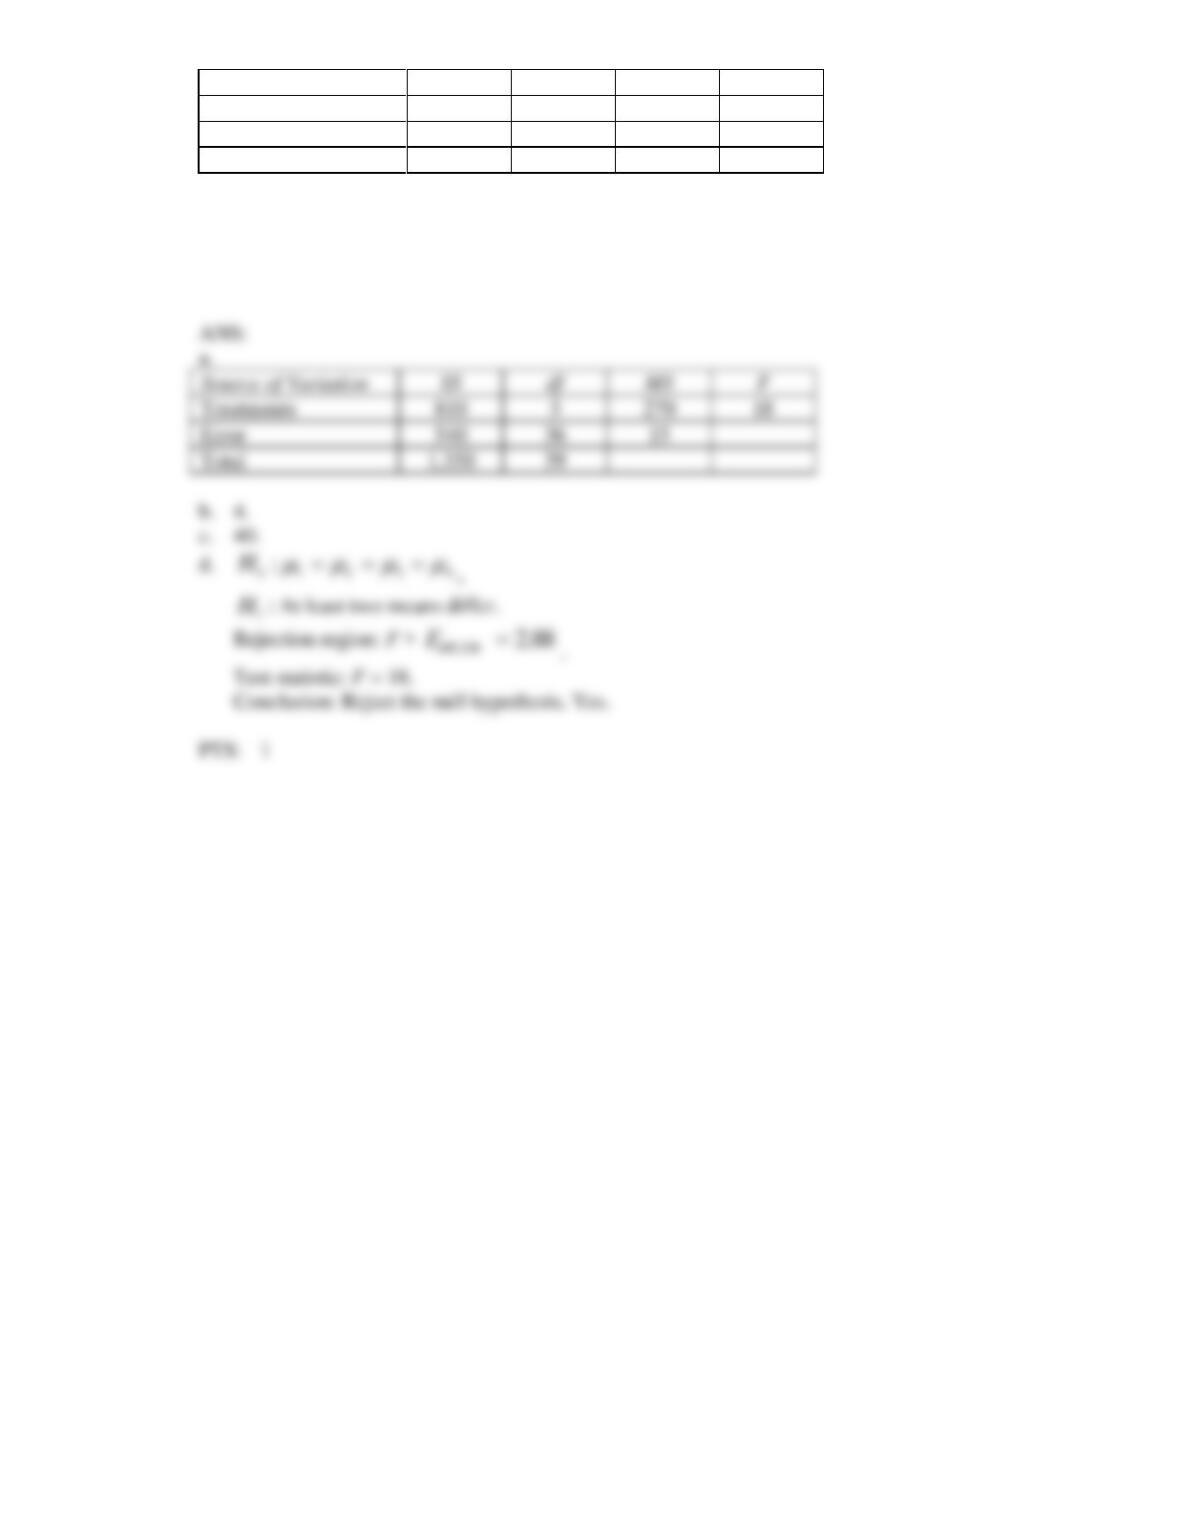
33. A random sample of 10 observations was selected from each of four normal populations. A partial
one-way ANOVA table is shown below:
Source of Variation
SS
df
MS
F
Treatments
*
*
270
*
Error
*
*
*
Total
1,350
*
a. Complete the missing entries (identified by asterisks) in the ANOVA table.
b. How many groups were in this study?
c. How many experimental units were in this study?
d. At the 5% significance level, can we infer that the means of the populations differ?
Treatments
Error
Total