Chapter 25—Time-series analysis and forecasting
MULTIPLE CHOICE
1. A time series is:
A.
a set of measurements on a variable collected at the same time or approximately the same
period of time.
B.
a set of measurements on a variable taken over some time period in sequential order.
C.
a model that attempts to analyse the relationship between a dependent variable and one or
more independent variables.
D.
a model that attempts to forecast the future value of a variable.
2. The time-series component that reflects a long-term, relatively smooth pattern or direction exhibited
by a time series over a long time period (more than one year) is called:
A.
trend.
B.
cyclical.
C.
seasonal.
D.
random variation.
3. The time-series component that reflects variability over short repetitive time periods and has duration
of less than one year is called:
A.
trend.
B.
cyclical.
C.
seasonal.
D.
random variation.
4. The time-series component that reflects the irregular changes in a time series that are not caused by
any other component, and tends to hide the existence of the other, more predictable components, is
called:
A.
trend.
B.
cyclical.
C.
seasonal.
D.
random variation.
5. The time-series component that reflects a wavelike pattern describing a long-term trend that is
generally apparent over a number of years is called:
A.
trend.
B.
cyclical.
C.
seasonal.
D.
random variation.

6. The term ‘seasonal variation’ may refer to:
A.
the four traditional seasons.
B.
systematic patterns that occur during the period of one week.
C.
systematic patterns that occur over the course of one day.
D.
All of the above are correct statements.
7. Which of the four time-series components is most likely to exhibit the steady growth of the population
of Australia from 1945 to 1995?
A.
Trend.
B.
Cyclical.
C.
Seasonal.
D.
Random variation.
8. Which of the four time-series components is most likely to exhibit the changes in stock market prices
at particular times during the course of one day?
A.
Trend.
B.
Cyclical.
C.
Seasonal.
D.
Random variation.
9. We calculate the three-period moving averages for a time series for all time periods except the:
A.
first and last period.
B.
first two periods.
C.
last two periods.
D.
first and last two periods.
10. We calculate the five-period moving average for a time series for all time periods except the:
A.
first five periods.
B.
last five periods.
C.
first and last period.
D.
first two and last two periods.
11. Which of the following methods may be used to smooth a time series sufficiently to remove the
random variation and to discover the existence of the other time-series components?
A.
Moving averages and exponential smoothing.
B.
Exponential smoothing and deseasonalising.
C.
Deseasonalising and mean absolute deviation.
D.
Mean absolute deviation and the percentage of trend.
12. In an exponentially smoothed time series, the smoothing constant w is chosen on the basis of how
much smoothing is required. In general:
A.
a small value of w, such as w = 0.1, results in very little smoothing, while a large value,
such as w = 0.8, results in too much smoothing.
B.
a small value of w, such as w = 0.1, results in too much smoothing, while a large value
such as w = 0.8, results in very little smoothing.
C.
a small value of w, such as w = 0.1, and a large value, such as w = 0.8, may both result in
very little smoothing.
D.
a small value of w, such as w = 0.1, and a large value, such as w = 0.8, may both result in
too much smoothing.
13. In measuring the cyclical effect of a time series, cycles need to be isolated. The measure we use to
identify cyclical variation is the:
A.
mean absolute deviation.
B.
trend value ŷ.
C.
percentage of trend.
D.
ratio of the time series divided by the moving average.
14. In measuring the seasonal and random variation of a time series with no cyclical effect, we may use:
A.
the ratio of the time series divided by the moving average.
B.
the ratio of the time series divided by the predicted values.
C.
the trend value ŷ.
D.
both A and B.
15. The most commonly used measures of forecast accuracy are the:
A.
mean absolute deviation and the sum of squares for forecast errors.
B.
sum of squares for forecast error and seasonal indexes.
C.
seasonal indexes and the percentage of trend.
D.
All of the above statements are correct.
16. Which of the following will not be present in a deseasonalised time series?
A.
Trend effects.
B.
Cyclical variation.
C.
Seasonal variation.
D.
Random variation.
17. The number of four-period centred moving averages of a time series with 28 time periods is:
A.
28.
B.
24.
C.
22.
D.
26.
18. The mean absolute deviation averages the absolute differences between the actual values of the time
series at time t and the forecast values at time:
A.
t + 1.
B.
t.
C.
t – 1.
D.
t – 2.
19. In general, it is easy to identify the trend component of a time series by using:
A.
exponential smoothing.
B.
moving averages.
C.
regression analysis.
D.
seasonally adjusted time series.
20. If we wanted to measure the seasonal variations on stock market performance by quarter, we would
need:
A.
four indicator variables.
B.
three indicator variables.
C.
two indicator variables.
D.
one indicator variable.
21. The linear model for long-term trend is
++= ty 10
, where t is the time period. The trend is
indicated by:
A.
0
.
B.
1
.
C.
y
.
D.
t
.
22. The term
1
b
in the equation
34231210
öQbQbQbtbbyt++++=
, where ŷt represents the predicted
value of y at time t, is:
A.
the time trend.
B.
the seasonal trend.
C.
an indicator variable.
D.
a value between 0 and 4.
23. If we wanted to measure the seasonal variations on stock market performance by month, we would
need:
A.
50 indicator variables, since the stock market has a 5-day working week.
B.
12 indicator variables to represent the 12 months.
C.
11 indicator variables.
D.
55 indicator variables.
24. The stock market has a 5-day working week. If we wanted to measure the impact of the day of the
week on stock market performance, we would need:
A.
seven indicator variables.

B.
six indicator variables.
C.
five indicator variables.
D.
four indicator variables.
25. The level of construction employment in Sydney is lowest during the winter. A model designed to
forecast construction employment in Sydney should use:
A.
a time trend.
B.
a moving average.
C.
a seasonal indicator variable.
D.
an autoregressive model.
26. Which method would you recommend to your statistics lecturer in selecting the appropriate forecasting
model if avoiding large errors is extremely important to him or her?
A.
Mean absolute deviation (MAD).
B.
Sum of squares for forecast error (SSE).
C.
Either A or B.
D.
Neither A nor B.
27. Which of the following will be reflected by a deseasonalised time series?
A.
Trend effects.
B.
Cyclical effects.
C.
Random variation.
D.
All of the above.
28. Which of the following statements is not correct?
A.
A moving average for a time period is the simple arithmetic average of the values in that
time period and those close to it.
B.
A value of the smoothing constant w close to 1 results in a very large smoothing, where as
a value of w close to zero results in very little smoothing.
C.
The accuracy of the forecast with exponential smoothing decreases rapidly for predictions
of the time series more than one period into the future.
D.
A moving average ‘forgets’ most of the previous time-series values, and is considered a
relatively crude method of removing the random variation.
29. Which of the following is not true in regard to the weights used in exponential smoothing?
A.
The last weight is always the smallest.
B.
They are all positive.
C.
They add up to 1.
D.
They decrease exponentially into the past.
30. If data for a time-series analysis are collected on a monthly basis only, which component of the time
series may be ignored?
A.
Long-term trend.
B.
Cyclical variation.

C.
Seasonal variation.
D.
Random variation.
31. The time-series multiplicative model is used for forecasting, where
,,, ttt SCT
and
t
R
are respectively
the trend, cyclical, seasonal and random variation components of the time series, and
t
y
is the value
of the time series at time t. The following estimates are obtained:
ˆ
t
T
= 125,
ˆt
C
= 1.03,
ˆt
S
= 1.02,
ˆt
R
= 0.97.
The model will produce a forecast of:
A.
122.659.
B.
131.325.
C.
118.980.
D.
127.385.
32. Which of the following methods is appropriate for forecasting a time series when the trend, cyclical
and seasonal components of the series are not significant?
A.
Moving averages.
B.
Exponential smoothing.
C.
Mean absolute deviation.
D.
Seasonal indexes.
33. Time-series forecasting with exponential smoothing uses the following formula:`
1
)1( −
−+= ttt SwwyS
.
where
t
S
is the exponentially smoothed time series at time t,
t
y
is the value of the time series at time
t, and w is the smoothing constant. The forecast value at time t + 1, where w = 0.3, is given by:
A.
Ft+1 = 0.3yt+1 + 0.7St+1.
B.
Ft+1 = 0.3yt + 0.7St-1.
C.
Ft+1 = 0.3yt + 0.7St.
D.
Ft+1 = 0.3yt-1 + 0.7St.
34. Which of the following equations will deseasonalise a time series, where T, C, S and R are respectively
the trend, cyclical, seasonal and random variation components of the time series?
A.
(T
C
S
R) / T = C
S
R.
B.
(T
C
S
R) / C = T
S
R.
C.
(T
C
S
R) / S = T
C
R.
D.
(T
C
S
R) / R = T
C
S.
35. The following trend line was calculated from quarterly data for 2006–2010:
ŷ = 2.35 + 0.12t, where t = 1 for the first quarter of 2006. The trend value for the third quarter of the
year 2011 is:
A.
5.110.
B.
4.990.
C.
5.230.

D.
None of the above answers is correct.
36. The following trend line was calculated from quarterly data for 2006–2010:
ŷ = 2.35 + 0.12t, where t = 1 for the first quarter of 2006. The seasonal indexes computed from the
trend line for the four quarters of the year 2011 are 0.88, 0.93, 1.04, and 1.17, respectively. The
seasonalised forecast for the third quarter of the year 2011 is:
A.
5.314.
B.
6.119.
C.
4.286.
D.
4.641.
37. If summer 2010 sales were $16 600 and the summer seasonal index was 1.17, then the deseasonalised
2010 summer sales value would be:
A.
$19 422.
B.
$13 675.
C.
$14 188.
D.
$18 720.
38. The following are the values of a time series for the first four time periods:
t
1
2
3
4
t
y
23
25
28
24
Using exponential smoothing, with w = 0.25, the forecast value for time period 5 is:
A.
18.352.
B.
23.500.
C.
24.469.
D.
23.000.
39. The following linear trend was estimated using a time series with 36 time periods:
ŷ = 76.80 + 3.14t.
The forecast value for time period 37 is:
A.
116.18.
B.
192.98.
C.
189.84.
D.
2957.78.
40. Forecasts based on trend and seasonality are generated by:
A.
identifying and removing the seasonal effect.
B.
extrapolating the linear trend.
C.
adjusting the forecasts to the seasonal effect.
D.
All of the above are correct.

41. Suppose that we calculate the four-period moving average of the following time series:
t
1
2
3
4
5
6
t
y
18
28
23
17
26
14
The centred moving average for period 4 is:
A.
20.00.
B.
22.50.
C.
23.50.
D.
21.75.
42. The mean absolute deviation (MAD) and the sum of squares for forecast error (SSE) are the most
commonly used measures of forecast accuracy. The model that forecasts the data best will usually
have the:
A.
lowest MAD and highest SSE.
B.
highest MAD and lowest SSE.
C.
lowest MAD and SSE.
D.
highest MAD and SSE.
43. The model that assumes the time-series value at time t is the sum of the four time-series components is
referred to as the:
A.
additive model.
B.
multiplicative model.
C.
moving averages model.
D.
forecast model.
44. The model that assumes the time-series value at time t is the product of the four time-series
components is referred to as the:
A.
additive model.
B.
forecast model.
C.
moving averages model.
D.
multiplicative model.
45. One measure of the accuracy of a forecasting model is the:
A.
deseasonalised time series.
B.
four-period moving average.
C.
mean absolute deviation.
D.
smoothing constant.

46. Smoothing time-series data by the moving average method or exponential smoothing method is an
attempt to remove the effect of the:
A.
trend component.
B.
cyclical component.
C.
seasonal component.
D.
random variation component.
47. Of the four components of the multiplicative time-series model, the ratio of the time series to the
moving average isolates the:
A.
trend and cyclical components.
B.
cyclical and seasonal components.
C.
seasonal and random variation components.
D.
four components.
48. Which of the following smoothing constants causes the most rapid reaction to a change in the current
time-series value?
A.
0.40.
B.
0.48.
C.
0.43.
D.
0.37.
49. In determining monthly seasonal indexes for petrol consumption, the sum of the 12 means for petrol
consumption as a percentage of the moving average is 1230. To get the seasonal indexes, each of the
12 monthly means is to be multiplied by:
A.
1200 / 1230.
B.
1230 / 1200.
C.
(1230 + 1200) / 2.
D.
(1230 + 1200) / 12.
50. In determining weekly seasonal indexes for petrol consumption, the sum of the 52 means for petrol
consumption as a percentage of the moving average is 5050. To get the seasonal indexes, each weekly
mean is to be multiplied by:
A.
5200 / 5050.
B.
(5200 + 5050) / 52.
C.
(5050 + 52) / 5200.
D.
5050 / 5200.
51. The trend equation for quarterly sales data (in millions of dollars) for 2001–2005 is
tyt2.18.6
ö+=
,
where t = 1 for the first quarter of 2001. The seasonal index for the third quarter of 2006 is 1.25. The
forecast sales for the third quarter of 2006 is:
A.
34.40.
B.
27.52.
C.
43.00.
D.
35.65.

52. The trend equation for annual sales data (in millions of dollars) is
tyt5.265
ö+=
, where t = 1 for
2000. The monthly seasonal index for December is 0.97. The forecast sales for December of 2009 is:
A.
90.0.
B.
7.28.
C.
7.50.
D.
7.69.
53. The results of a quadratic model fit to time-series data were ŷt = 7.5 − 0.2t + 2.8t2, where t = 1 for
2002. The forecast value for 2011 is:
A.
289.5.
B.
285.5.
C.
236.1.
D.
232.5.
54. The regression trend line for annual energy consumption for 1985–2005 is given by
ŷt = 70 + 0.53t, where t = 1 for 1985. If the annual energy consumption for 2000 was 82.5, then the
percentage of trend for 2000 was:
A.
105.122%.
B.
95.127%.
C.
104.321%.
D.
98.462%.
55. Which of the following models might be appropriate to describe a new product that has experienced a
rapid early growth rate followed by the inevitable levelling-off?
A.
The autoregressive model.
B.
The linear model for long-term trend.
C.
The quadratic model for long-term trend.
D.
All of the above models are appropriate.
56. Which of the following is true?
A.
In trend analysis, the independent variable is time only if the equation is linear.
B.
The number of time periods in a centred moving average is always even.
C.
If the seasonal index for December sales is 120, this means that December sales tend to be
120% higher than the ‘average’ month.
D.
The cyclical component of a time series refers to repeating patterns that have a period of a
year or less.
57. The high level of airline ticket sales that travel agencies experience during summer is an example of
which component of a time series?
A.
Trend.
B.
Cyclical.
C.
Seasonal.
D.
Random variation.
58. In determining monthly seasonal indexes, the first step is to construct a centred moving average with a
period of:
A.
24 months.
B.
12 months.
C.
6 months.
D.
3 months.
59. For which of the following values of the smoothing constant w will the smoothed series catch up most
quickly whenever the original time series changes direction?
A.
0.10.
B.
0.50.
C.
0.30.
D.
0.70.
TRUE/FALSE
1. Any variable that is measured over time in sequential order is called a time series.
2. The most commonly used measures of forecast accuracy are the mean absolute deviation (MAD) and
the sum of squares for forecast error (SSE).
3. The purpose of using the moving average is to take away the short-term seasonal and random
variation, leaving behind a combined trend and cyclical movement.
4. The cyclical variation component of a time series measures the overall general directional movement
over a long period of time.
5. Smoothing time-series data by the moving-average method or exponential method is an attempt to
dampen the effects of seasonal variation.
6. A trend is one of the four different components of a time series. It is a long-term, relatively smooth
pattern or direction exhibited by a series, and its duration is more than one year.
7. A time series can consist of four different components: long-term trend, cyclical variation, seasonal
variation, and random variation.
8. In forecasting, we use data from the past in predicting the future value of the variable of interest.
9. The effect that business recessions and prosperity have on time-series values is an example of the
disaster component of a time series.
10. The equation Ft+1 = wyt + (1−w)St-1 (for t 2) refers to a time series forecast prepared by exponential
smoothing.
11. Cycle is one of the four different components of a time series. It has a wavelike pattern over short,
repetitive calendar periods and, by definition, has duration of less than one year.
12. In determining monthly seasonal indexes for natural gas consumption, the sum of the 12 means for gas
consumption as a percentage of the moving average is 1195. To get the seasonal indexes, each
monthly mean is to be multiplied by (1195 / 1200).
13. In determining weekly seasonal indexes for natural gas consumption, the sum of the 52 means for gas
consumption as a percentage of the moving average is 5195. To get the seasonal indexes, each
monthly mean is to be multiplied by (5200 / 5195).
14. The time-series component that reflects a long-term, relatively smooth pattern or direction exhibited
by a time series over a long time period is called trend.
15. We calculate the three-period moving average for a time series for all time periods except the first.
16. To calculate the five-period moving average of a time series for a given time period, we average the
value in that time period and the values in the four preceding periods.
17. The term ‘seasonal variation’ may refer to the four traditional seasons, or to systematic patterns that
occur during a month, a week, or even one day.
18. In an exponentially smoothed time series, the smoothing constant w is chosen on the basis of how
much smoothing is required. In general, a small value of w such as 0.1 results in a great deal of
smoothing, while a large value of w, such as 0.9, results in very little smoothing.
19. The time-series component that reflects the irregular changes in a time series that are not caused by
any other component, and tends to hide the existence of the other, more predictable components, is
called random variation.
20. The mean absolute deviation averages the absolute differences between the actual values of the time
series at time t and the forecast values at time t + 1.
21. Random variation is one of the four different components of a time series. It is caused by irregular and
unpredictable changes in a time series that are not caused by any other component. It tends to mask the
existence of the other, more predictable components.
22. The trend line ŷt = 14.13 − 0.54t was calculated from quarterly data for 2006–2010, where t = 1 for the
first quarter of 2006. The trend value for the fourth quarter of the year 2011 is 1.170.
23. If summer 2010 sales were $26 800 and the summer seasonal index was 1.15, the deseasonalised 2010
summer sales value is $30 820.
24. Seasonal variations will not be present in a deseasonalised time series.
25. The time-series component that reflects a wavelike pattern describing a long-term trend that is
generally apparent over a number of years is called seasonal.
26. Smoothing time-series data by the moving average method or exponential smoothing method is an
attempt to remove the effect of the random variation component.
27. The result of a quadratic model fit to time-series data was
2
8.5 0.25 2.5
ö
t
y t t= − +
, where t = 1 for
1994. The forecast value for 2001 is 129.25.
28. One of the simplest ways to reduce random variation is to smooth the time series via moving averages
and exponential smoothing.
29. Of the four different components of a time series, the seasonal variation is the one most likely to
exhibit the relatively steady growth of the population of the Australian from about 10 million in 1960
to about 20 million in 2000.
30. Of the four different components of a time series, cyclical variation is the one most likely to exhibit the
long-term direction of the data.
31. We compute the five-period moving averages for all time periods except the first two and the last two.
32. We compute the three-period moving averages for all time periods except the first and last.
33. The easiest way of measuring the long-term trend is through regression analysis, where time is the
dependent variable.
34. To measure the seasonal variation, we compute seasonal indexes, which gauge the degree to which the
seasons differ from one another.
35. One application of seasonal indexes is to remove the seasonal variation in a time series. The process is
called deseasonalising, and the result is called a seasonally adjusted time series.
SHORT ANSWER
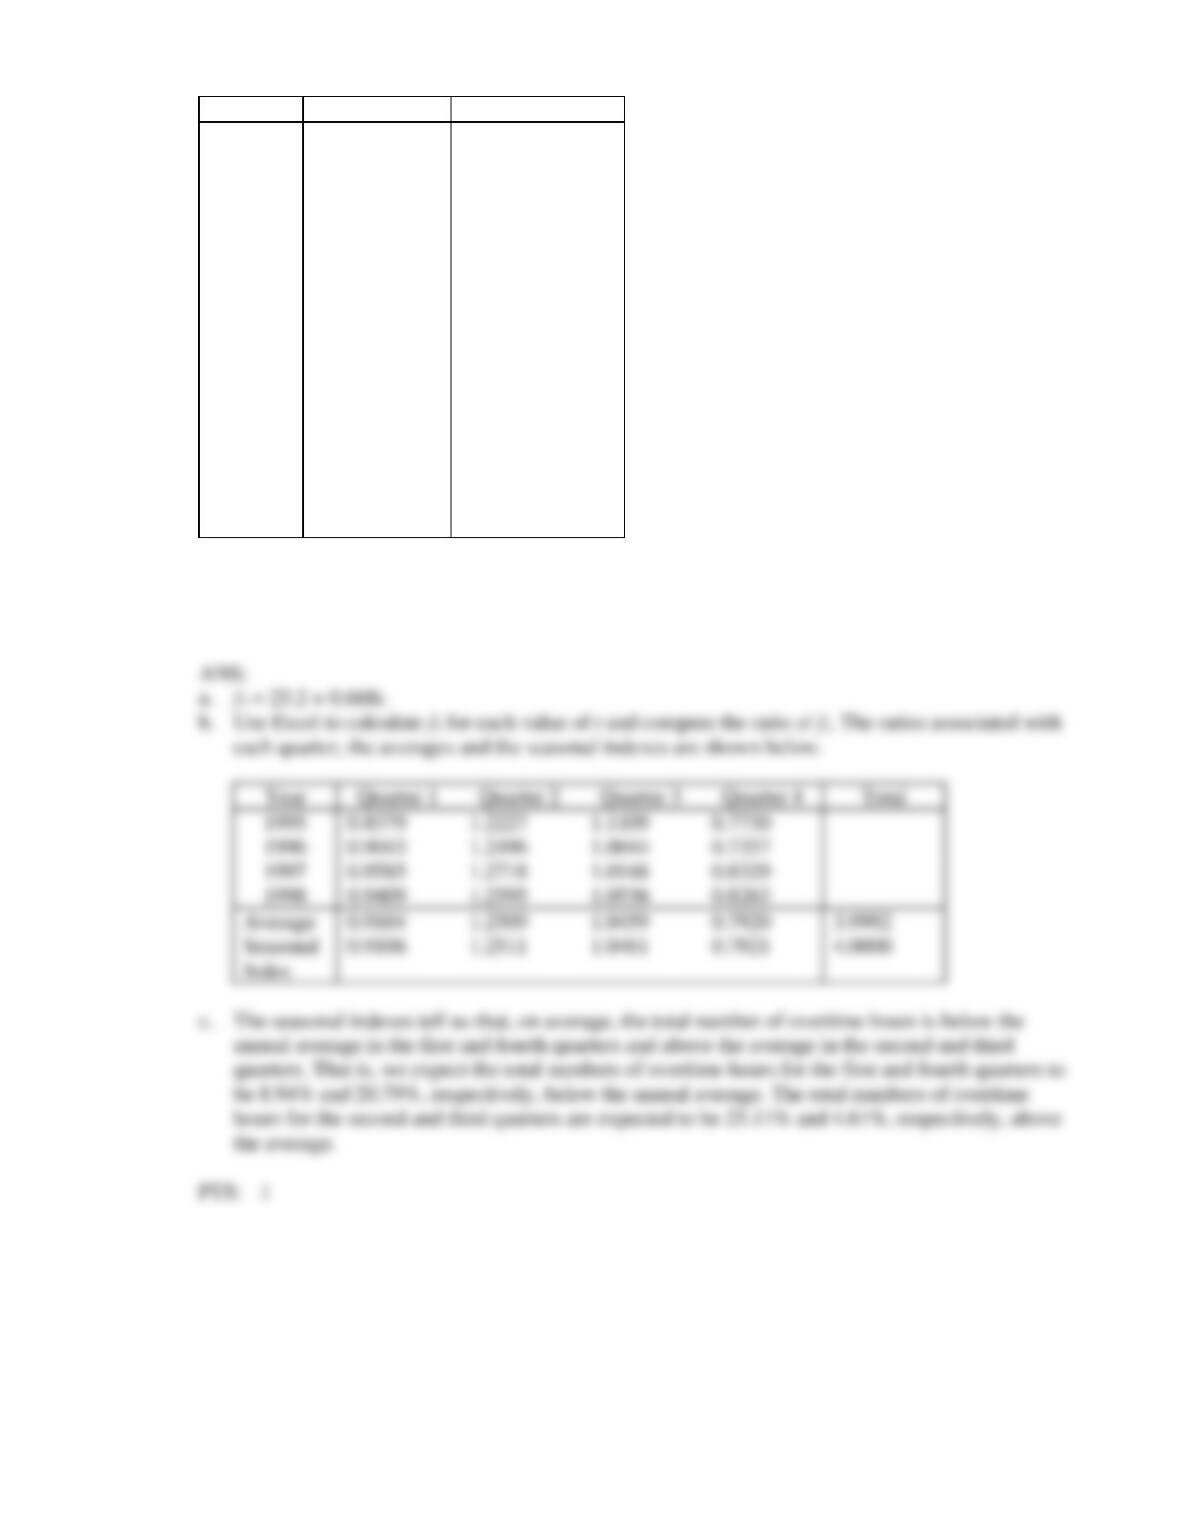
1. The total number of overtime hours (in 1000s) worked in a large steel mill was recorded for 16
quarters, as shown below.
Year
Quarter
Overtime hours
2007
1
20
2
30
3
28
4
20
2008
1
24
2
34
3
28
4
21
2009
1
28
2
38
3
31
4
26
2010
1
30
2
41
3
35
4
28
a. Use the regression technique to calculate the linear trend line.
b. Calculate the seasonal indexes based on the regression trend line in part (a).
c. What do the seasonal indexes tell us?
2. Given the following time series, compute the seasonal (quarterly) indexes, using the four-quarter
centred moving averages.
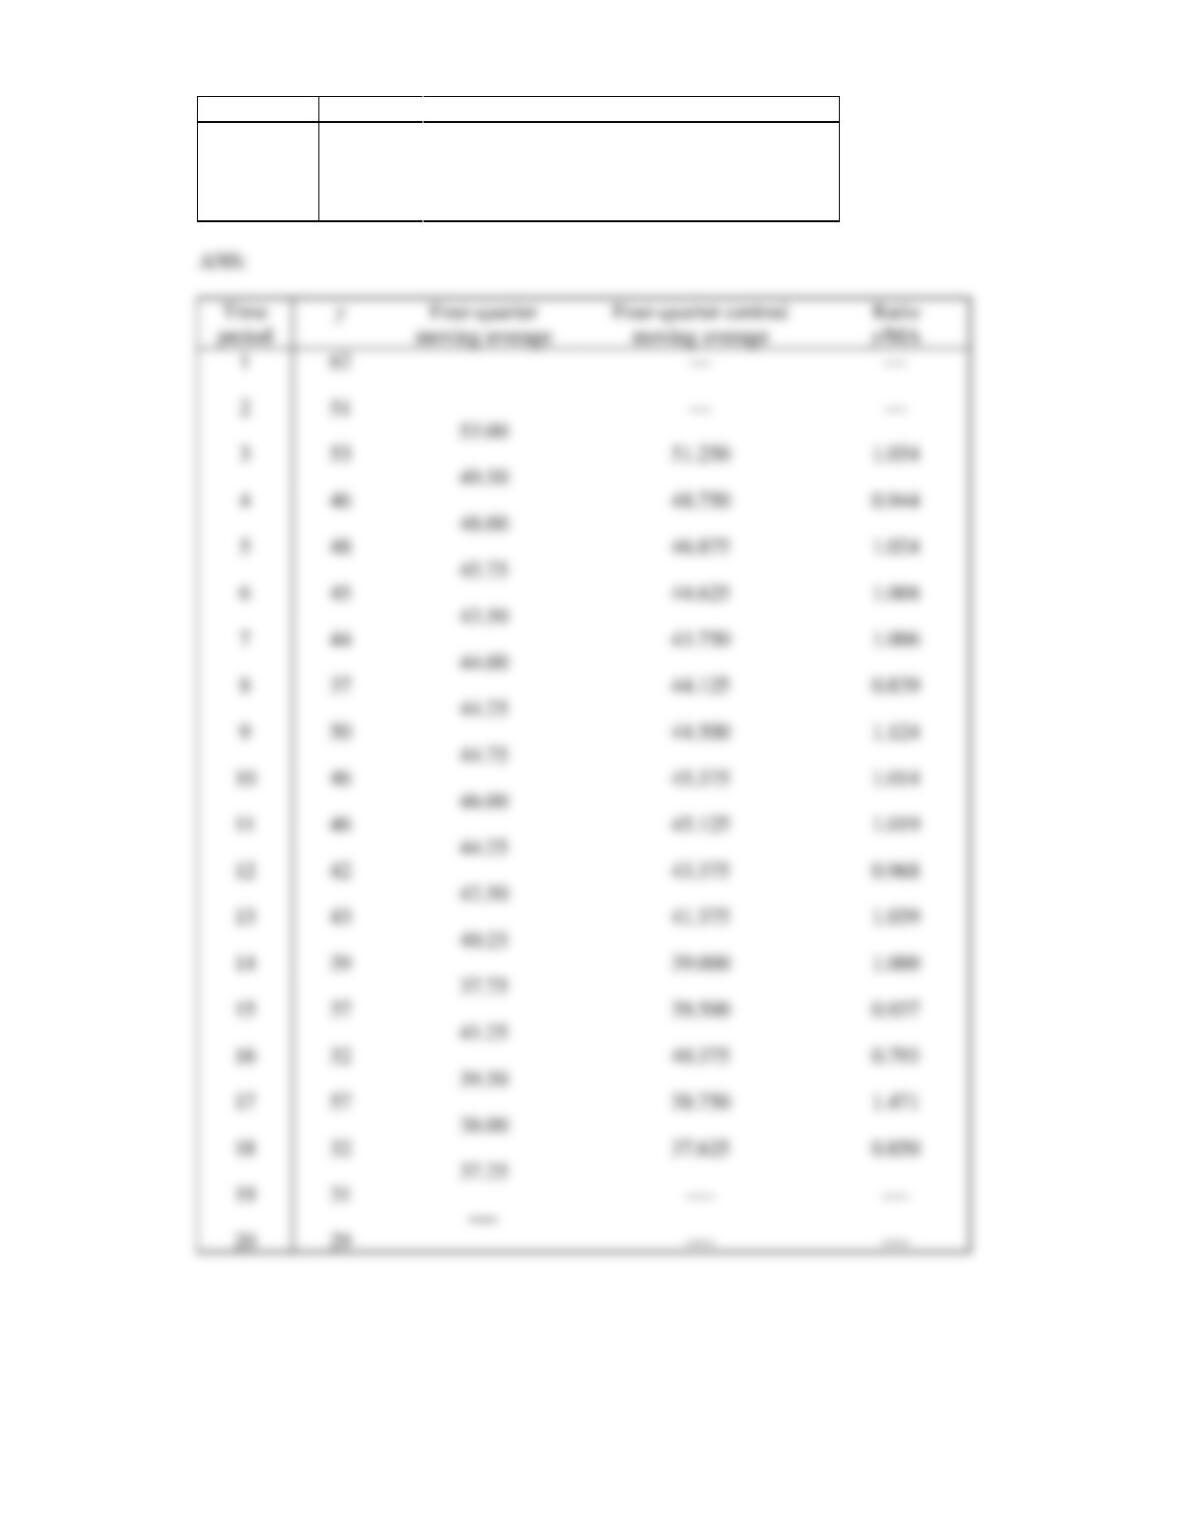
Quarter
1993
1994
1995
1996
1997
1
62
48
50
43
57
2
51
45
46
39
32
3
53
44
46
37
31
4
46
37
42
32
29
3. The following trend line and seasonal indexes were computed from four weeks of daily observations.
tyt66.1145
ö+=
.
Day
t
SI
Sunday
1.403
Monday
0.517
Tuesday
0.515
Wednesday
0.621
Thursday
0.675
Friday
1.145
Saturday
2.124
Forecast the seven values for the next week.
tyt66.1145
ö+=
t
SI
Sunday
270.98
Monday
100.71
Tuesday
101.18
Wednesday
123.03
Thursday
134.85
Friday
230.65
Saturday
431.38
4. The following autoregressive model was developed: ŷt = 29 + 0.79yt-1.
Forecast the next value of the time series if the last observation was 119.
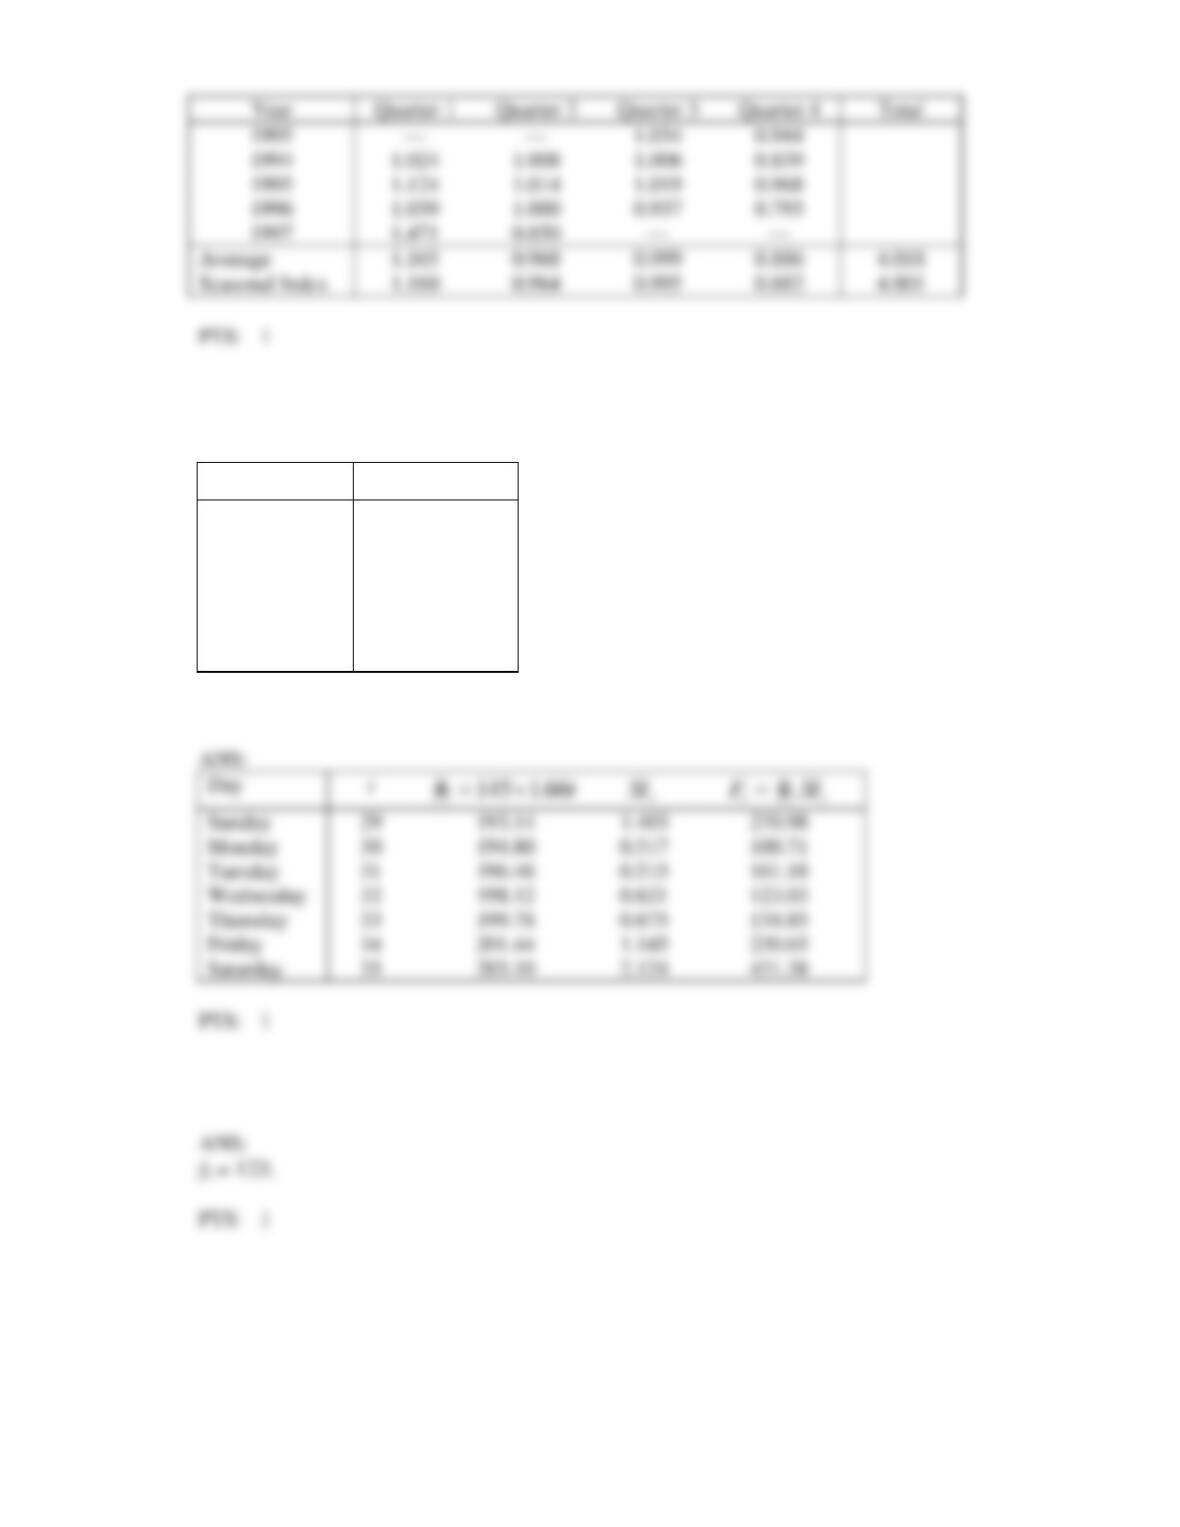
5. Weekly toy sales (in $1000s) in a department store for the past three months are shown below.
Month
Week
Sales
1
1
14
2
22
3
20
4
16
2
1
18
2
20
3
24
4
20
3
1
22
2
26
3
24
4
18
Compute the four-week centred moving averages.
6. The daily sales figures below have been recorded in a medium-sized insurance company.
Week
Day
1
2
3
4
Monday
38
46
35
59
Tuesday
40
36
52
53
Wednesday
17
32
25
28
Thursday
20
17
28
33
Friday
26
20
32
20
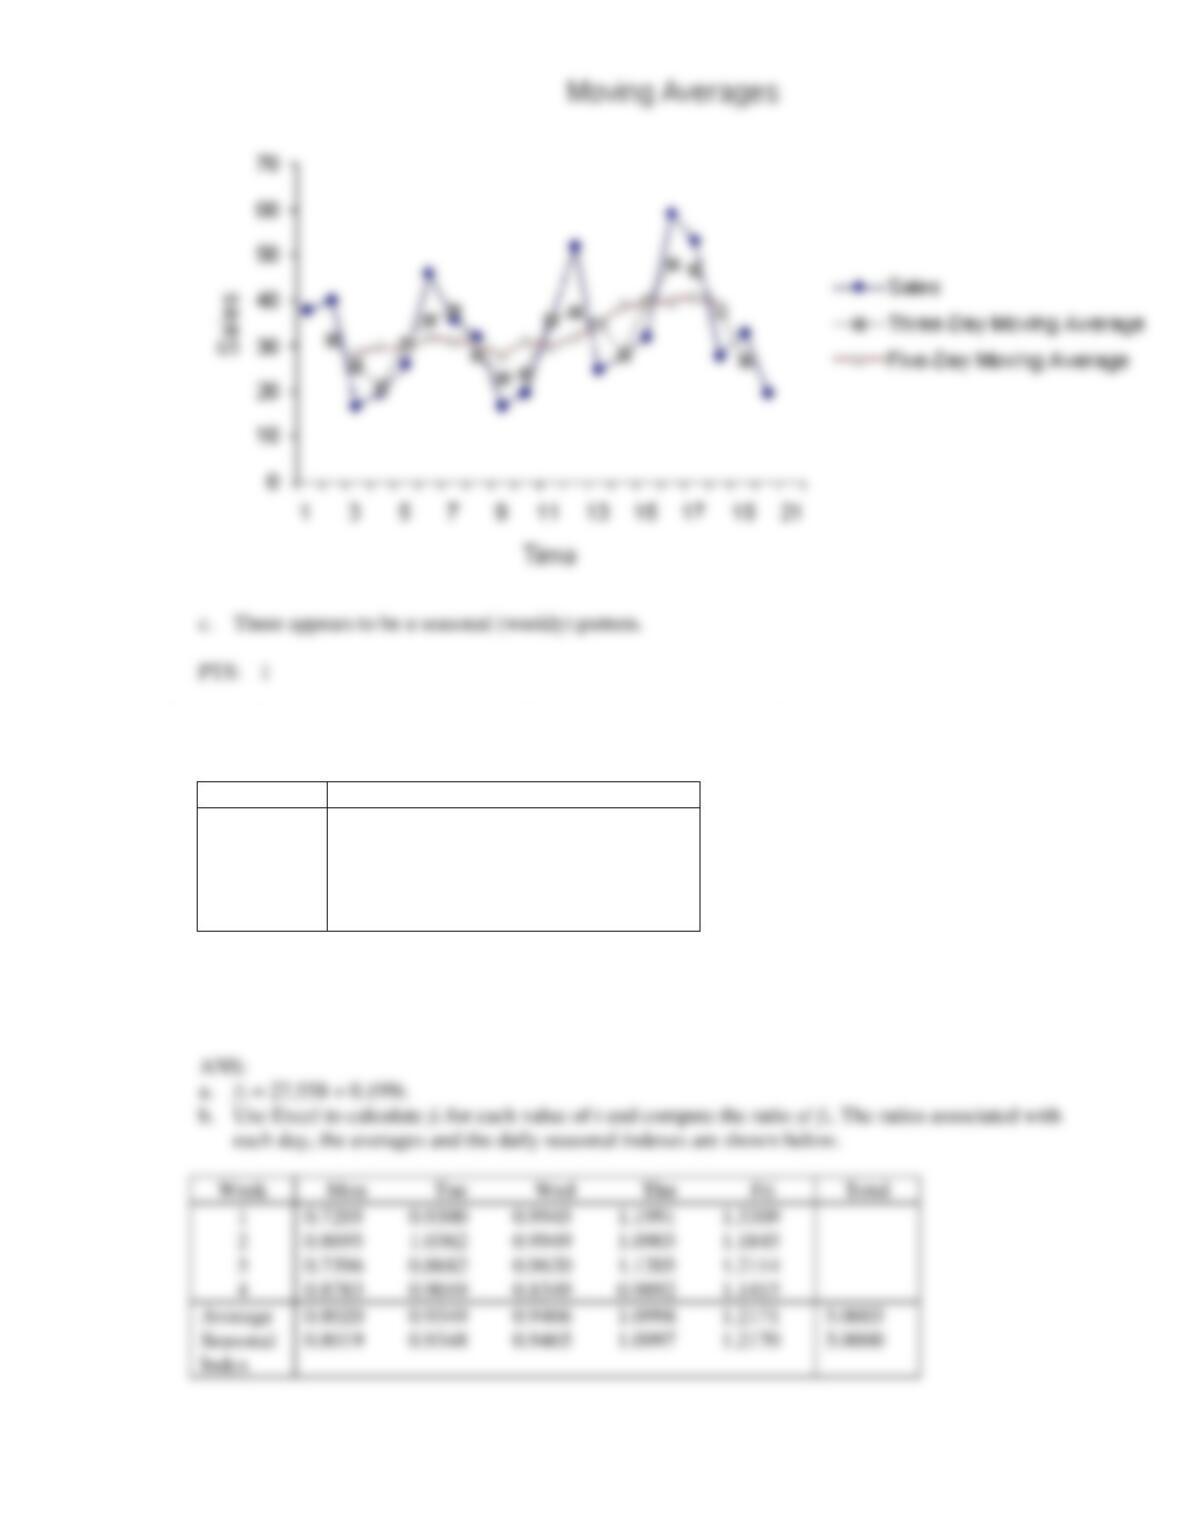
a. Compute the three-day and five-day moving averages.
b. Plot the series and the moving averages on the same graph.
c. Does there appear to be a seasonal (weekly) pattern?
2
40
4
20
5
26
7
36
9
17
10
11
35
12
52
13
14
28
15
16
59
17
53
18
19
33
20
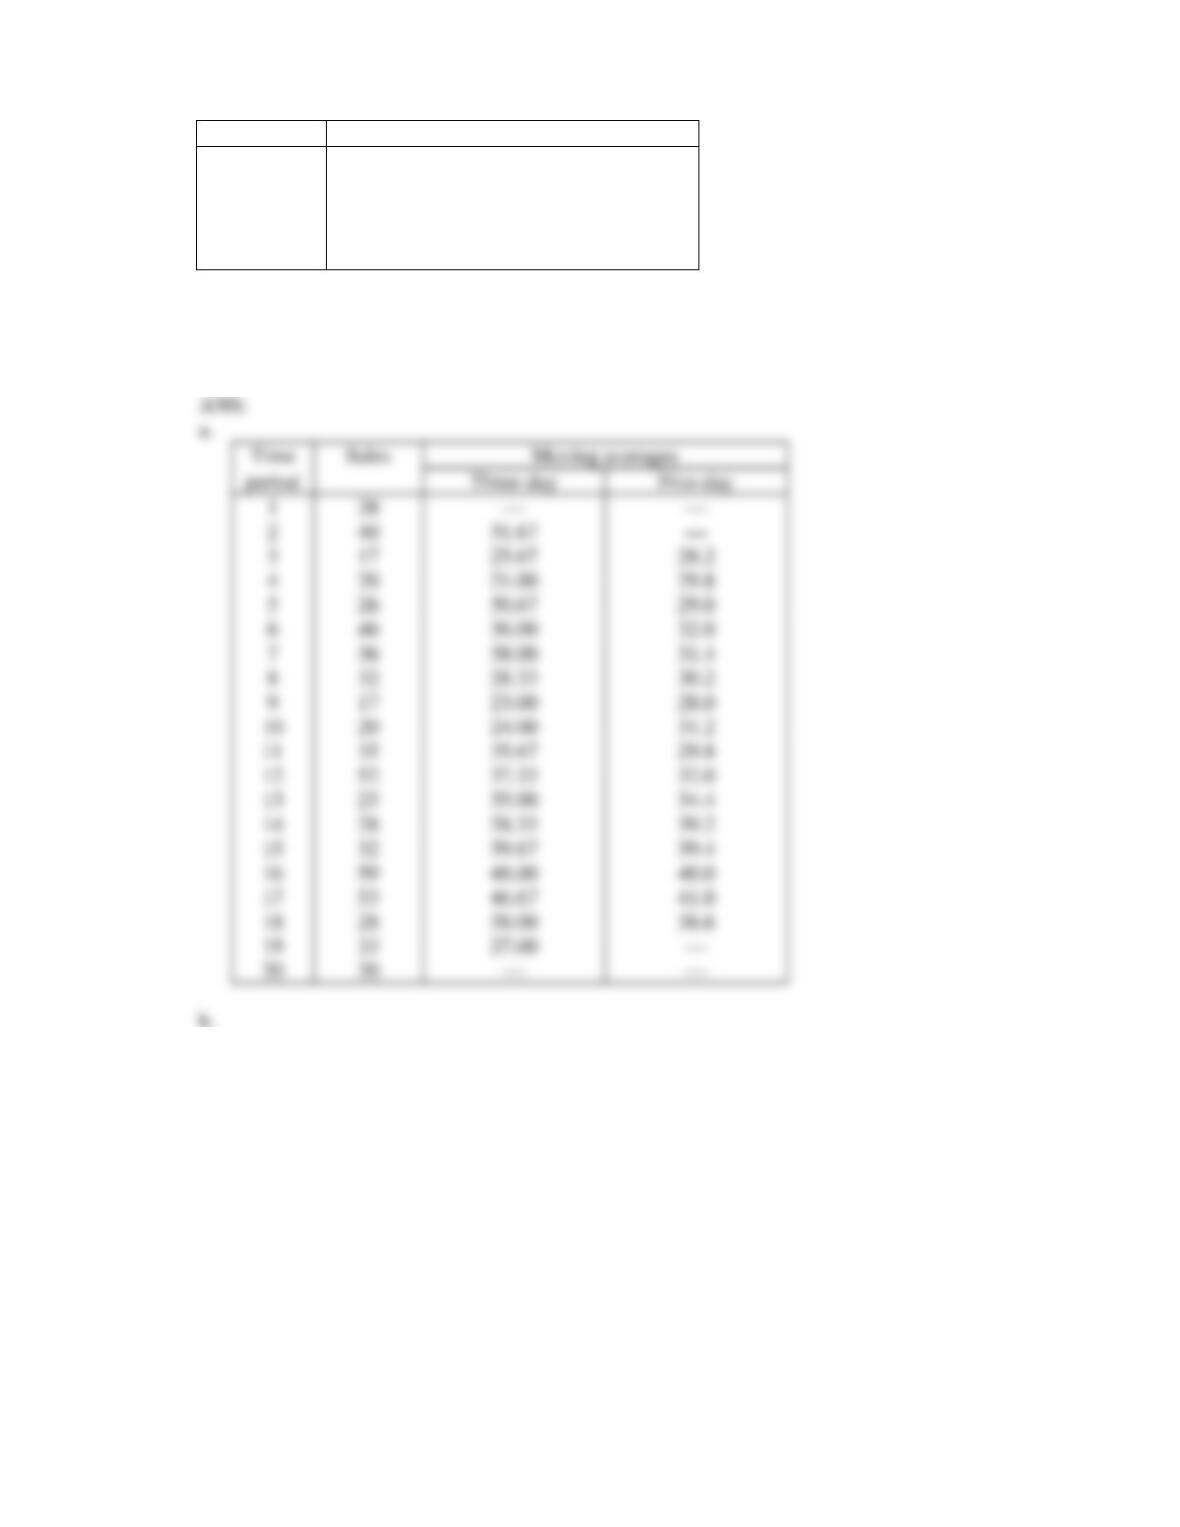
7. A retailing outlet has been keeping daily sales records over the past four weeks, as shown below.
Week
Day
1
2
3
4
Monday
20
25
22
27
Tuesday
26
30
26
28
Wednesday
28
29
29
26
Thursday
34
32
34
31
Friday
38
35
37
36
a. Use the regression technique to calculate the linear trend line.
b. Calculate the daily indexes based on the regression trend line in part (a).
c. What do the daily indexes tell us?
0.7205
0.7396
0.8783
Average
0.8020
5.0003