Archives: Solution Manual
Management Chapter 8 Homework Wasted Materials 31000 Downtime 30000 Inspection 25000
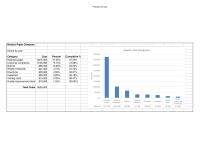
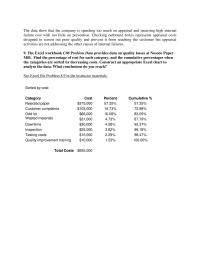
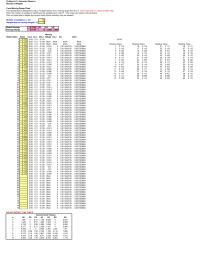
Problem 8.9.xlsx Nosoco Paper Company Sorted by cost: Category Cost Percent Cumulative % Rejected paper $375,000 57.25% 57.25% Customer complaints $103,000 15.73% 72.98% $350,000 $400,000 Quality Cost Categories Odd lot $66,000 10.08% 83.05% Wasted materials $31,000 4.73% 87.79% Downtime $30,000 […]
Management Chapter 8 Homework Checking outbound boxes for errors Incoming product inspection
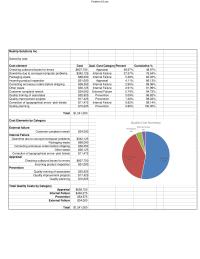
Problem 8.8.xlsx Reship Solutions Inc. Sorted by cost: Cost element Cost Qual. Cost Category Correcting erroneous orders before shipping $36,550 Other waste $36,125 Correction of typographical errors–pick tickets $11,475 Appraisal Checking outbound boxes for errors $607,750 Incoming product inspection $51,000 […]
Management Chapter 8 Homework Percent Quality Cost labor Cost
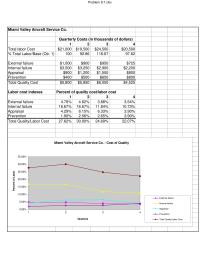
Problem 8.7.xlsx Miami Valley Aircraft Service Co. 1 2 3 4 Total labor Cost $21,000 $19,500 $24,500 $20,500 % Total Labor/Base (Qtr. 1) Appraisal 4.29% 6.15% 6.33% 3.90% Prevention 1.90% 2.56% 2.65% 3.90% Total Quality/Labor Cost 27.62% 30.00% 24.69% 22.07% […]
Management Chapter 8 Homework Quality Cost Percent Total Quality Cost 2430000
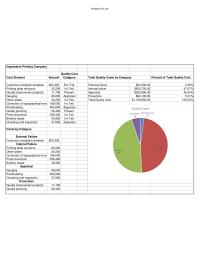
Problem 8.6.xlsx Impressive Printing Company Quality Cost Cost Element Amount Category Total Quality Costs by Category Percent of Total Quality Cost Customer complaint remakes $24,300 Ext. Fail. External failure $24,300.00 2.08% Costs by Category External Failure Customer complaint remakes $24,300 […]
Management Chapter 8 Homework Compute control limits for a p-chart for this process
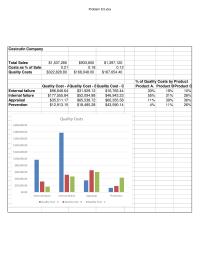
Problem 8.5.xlsx Costcutin Company Total Sales $1,537,280 $933,600 $1,397,120 % of Quality Costs by Product Quality Cost – A Quality Cost – B Quality Cost – C Product A. Product B Appraisal $35,511.17 $65,538.72 $60,355.58 11% 39% 36% Prevention $12,913.15 […]
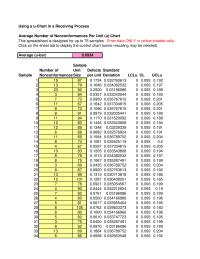
Management Chapter 8 Excel Using Uchart Receiving Process Average Number Nonconformances
Using a u-Chart in a Receiving Process This spreadsheet is designed for up to 75 samples. Enter data ONLY in yellow-shaded cells. Click on the sheet tab to display the control chart (some rescaling may be needed). Sample Number of […]
Management Chapter 8 Homework Upper Control Limit Center Line Sample Number
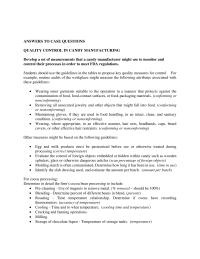
processing (correct temperature) • Evaluate the control of foreign objects embedded or hidden within candy such as wooden splinters, glass or otherwise dangerous articles (scan percentage of foreign objects) • Molding starch is often contaminated. Determine how long it has […]
Management Chapter 8 Homework this might be due to a festival at the resort, for instance
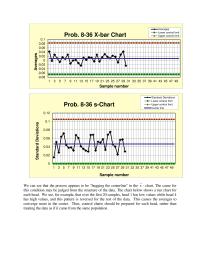
We can see that the process appears to be “hugging the centerline” in the x – chart. The cause for this condition may be judged from the structure of the data. The chart below shows a run chart for -0.08 […]
Management Chapter 8 Homework More Bin Frequency After Establishing The Control
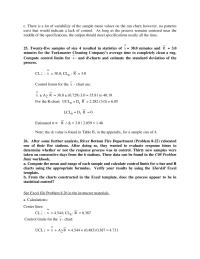
c. There is a lot of variability of the sample mean values on the run chart; however. no patterns exist that would indicate a lack of control. As long as the process remains centered near the middle of the specifications, […]
Management Chapter 8 Homework Formula 826 Formula 827 Substituting
9. The Excel workbook C08 Problem Data provides data on quality losses at Nosoco Paper Mill. Find the percentage of cost for each category, and the cumulative percentages when the categories are sorted by decreasing costs. Construct an appropriate Excel […]
Management Chapter 8 Homework To become aware of factors that must be understood in designing
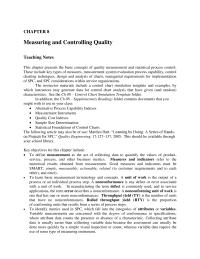
CHAPTER 8 Measuring and Controlling Quality Teaching Notes This chapter presents the basic concepts of quality measurement and statistical process control. These include key types of measures, measurement system evaluation process capability, control charting techniques, design and analysis of charts, […]
Management Chapter 8 Homework Sample Number Precision Piston Company Continued Revised
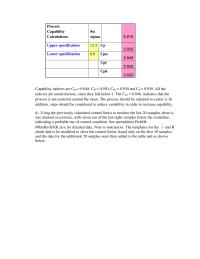
Process Capability Calculations Six sigma 6.815 Upper specification 12.4 Cp 0.939 Capability indexes are Cpu = 0.948, Cpl = 0.930, Cpk = 0.930 and Cp = 0.939. All the indexes are unsatisfactory, since they fall below 1. The Cpu = […]
Management Chapter 8 Homework There is one skilled operator who knows how
Problem 8-11-Instructor Reserve Ricardo’s Widgets X and Moving Range Chart This spreadsheet is designed for up to 75 observations and a moving range from 2 to 5. Enter data ONLY in yellow-shaded cells. Enter the number of samples in cell […]
Management Chapter 8 Homework Enter The Number Samples Cell And The
Problem 8-09B Babbage Chips Note: Formulas were altered to allow calculation of control limits based on the first 30 samples and plotting of 50 samples. This spreadsheet is designed for up to 50 samples, each of a constant sample size […]
Management Chapter 8 Homework Build partnerships with internal and external
Problem 8-08-Instructor Reserve Metropole Hospital Waiting Room This spreadsheet is designed for up to 50 samples, each of a constant sample size from 2 to 10. Enter data ONLY in yellow-shaded cells. Enter the number of samples in cell E6 […]
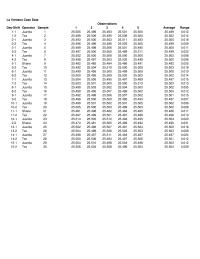
Management Chapter 8 Homework Ventana Case Data Dayshift 11
13-1 Juanita 25 25.502 25.496 25.507 25.491 25.504 25.500 0.016 13-2 Tex 26 25.504 25.498 25.506 25.503 25.503 25.503 0.008 14-1 Juanita 27 25.498 25.497 25.511 25.494 25.487 25.497 0.024 14-2 Tex 28 25.500 25.506 25.494 25.497 25.506 25.501 0.012 […]
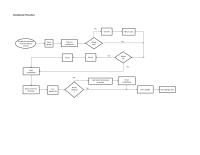
Management Chapter 8 Homework Start Snowblower Yes Get Broom Amp Cleaning
Snowblower Flowchart Decide that driveway must be cleared of snow Fill fuel tank No Open garage Take out snowblower Needs fuel? Yes Get fuel Put in garage Blow snow from driveway Needs cleaning ? Get broom & cleaning materials Clean […]
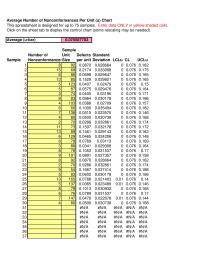
Management Chapter 8 Homework Average Number Nonconformances Per Unit U Chart
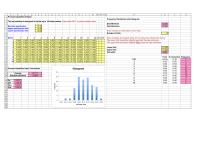
This spreadsheet is designed for up to 75 samples. Enter data ONLY in yellow-shaded cells. Click on the sheet tab to display the control chart (some rescaling may be needed). Sample Number of Unit Defects Standard Sample Nonconformances Size per […]
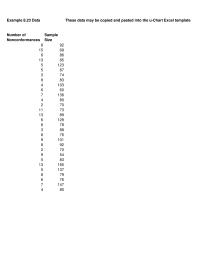
Management Chapter 8 Homework Excel Template Sample Size
9101 892 270 954 583 Example 8.23 Data These data may be copied and pasted into the u-Chart Excel template Number of Sample Nonconformances Size 892 15 69 686 13 85 5123 587 480 270 11 73 13 89 6129 […]
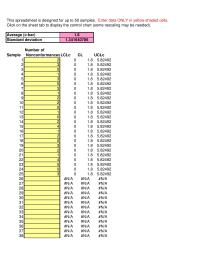
Management Chapter 8 Homework This Spreadsheet Designed For Samples Enter Data
This spreadsheet is designed for up to 50 samples. Enter data ONLY in yellow-shaded cells. Click on the sheet tab to display the control chart (some rescaling may be needed). Number of Sample Nonconformances 7 3 0 1.8 5.82492 8 […]
Management Chapter 8 Homework If the store manager wants to ensure at
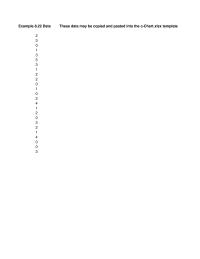
3 2 1 4 Example 8.22 Data These data may be copied and pasted into the c-Chart.xlsx template 2 3 0 1 2 0 1 0 2 4 1 2 0 0 0 3 3 5 3 1 2
Management Chapter 8 Homework Which one should be selected if the player
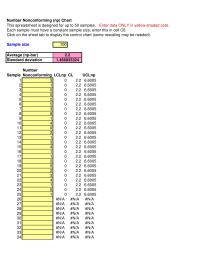
Number Nonconforming (np) Chart This spreadsheet is designed for up to 50 samples. Enter data ONLY in yellow-shaded cells. Each sample must have a constant sample size; enter this in cell C6. Click on the sheet tab to display the […]
Management Chapter 8 Homework Sample Fraction Sample Value Size Nonconforming
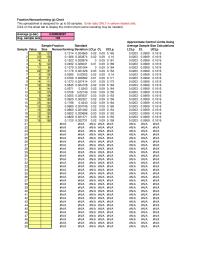
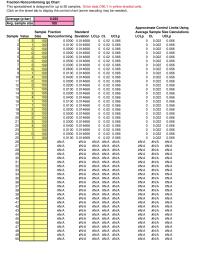
Fraction Nonconforming (p) Chart This spreadsheet is designed for up to 50 samples. Enter data ONLY in yellow-shaded cells. Click on the sheet tab to display the control chart (some rescaling may be needed). Average (p-bar) Sample Fraction Standard Average […]
Management Chapter 8 Homework These Data May Copied And Pasted Into
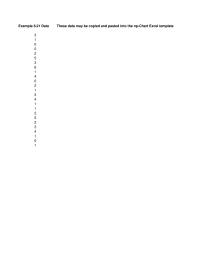
5 2 3 4 Example 8.21 Data These data may be copied and pasted into the np-Chart Excel template 3 1 0 0 2 2 1 3 4 1 1 2 1 0 1 5 3 6 1 4 0
Management Chapter 8 Homework Fraction Nonconforming P Chart This Spreadsheet Designed
Fraction Nonconforming (p) Chart This spreadsheet is designed for up to 50 samples. Enter data ONLY in yellow-shaded cells. Click on the sheet tab to display the control chart (some rescaling may be needed). Average (p-bar) Approximate Control Limits Using […]
Management Chapter 8 Homework Concurrent engineering involves multifunctional teams
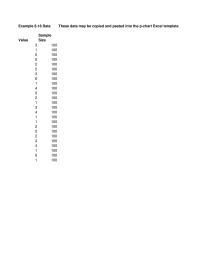
Example 8.18 Data These data may be copied and pasted into the p-chart Excel template 2100 5100 2100 3100 4100 1100 0100 1100 Sample Value Size 3100 1100 0100 0100 0100 2100 1100 3100 4100 1100 1100 2100 5100 3100 […]
Management Chapter 8 Homework Lead and inspire the organization to make
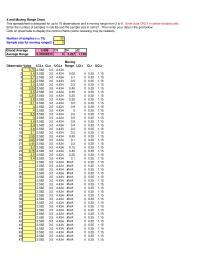
X and Moving Range Chart This spreadsheet is designed for up to 75 observations and a moving range from 2 to 5. Enter data ONLY in yellow-shaded cells. Enter the number of samples in cell E6 and the sample size […]
Management Chapter 8 Homework Repeatability and Reproducibility – R&R
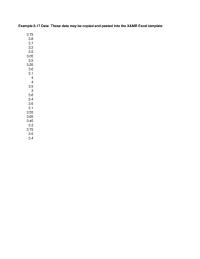
3.55 3.65 3.45 3.3 3.75 3.5 3.4 Example 8.17 Data These data may be copied and pasted into the X&MR Excel template 3.75 3.8 3.7 3.2 3.5 3.1 4 4 3.5 3 3.8 3.4 3.6 3.1 3.05 3.5 3.25 3.6
Management Chapter 8 Homework Discard values and recompute statistics.
Example 8.16 Data These data may be copied and pasted into the Xbar&S Excel template 1-2 0 1 -3 -6 -3 0 2 0 -3 -1 -1 -3 -1 -1 -2 0 0 1 1 -1 0 1 2 -3 […]
Management Chapter 8 Homework This spreadsheet is designed to handle up to 150 observations
6 7 8 Upper specification limit 10.90 Lower specification limit 10.55 Enter number of cells below (10 or less) Number of Cells 10 30 31 Cpu 0.7021 Cpk 0.6413 15 23 24 25 Process Capability Index Calculations 4 10.60 10.65 […]
Management Chapter 8 Homework To illustrate the analysis for constructing a control chart
Example 8.11 Data These data may be copied and pasted into the Process Capability Excel template 10.650 10.800 10.500 10.800 10.700 10.800 10.750 10.650 10.850 10.650 10.800 10.650 10.750 10.850 10.800 10.800 10.700 10.700 10.850 10.700 10.800 10.550 10.700 10.850 […]
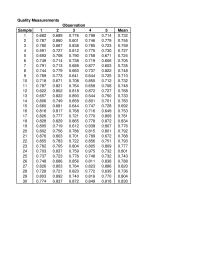
Management Chapter 8 Homework Quality Measurements Sample 0682
16 0.816 0.817 0.768 0.716 0.649 0.753 17 0.826 0.777 0.721 0.770 0.809 0.781 18 0.828 0.829 0.865 0.778 0.872 0.834 19 0.805 0.719 0.612 0.938 0.807 0.776 26 0.748 0.686 0.856 0.811 0.838 0.788 27 0.826 0.803 0.764 0.823 […]
Management Chapter 8 Homework any ranges beyond this limit may be the result
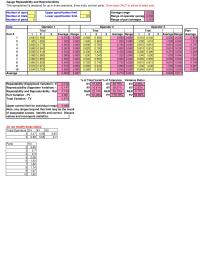
Gauge Repeatability and Reproducibility This spreadsheet is designed for up to three operators, three trials, and ten parts. Enter data ONLY in yellow shaded cells. Number of operators 3Upper specification limit 1Average range 0.029 Number of trials 2Lower specification limit […]
Management Chapter 8 Homework For example, to illustrate the effect of a shift in the mean
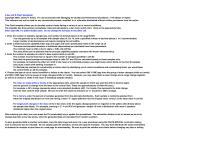
Copyright 2000: James R. Evans. For use exclusively with Managing for Quality and Performance Excellence , 11th Edition or higher. This software may not be used for any commercial purpose, modified, or or otherwise distributed without written permission from the […]
Management Chapter 8 Homework For Mean Range Shifts Trends The Appropriate
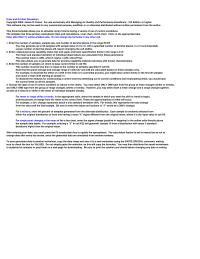
Copyright 2000: James R. Evans. For use exclusively with Managing for Quality and Performance Excellence, 11th Edition or higher. This software may not be used for any commercial purpose, modified, or or otherwise distributed without written permission from the author. […]
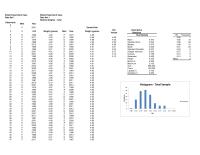
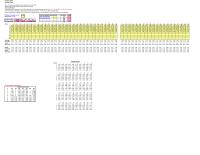
Management Chapter 8 Homework Nickel Experiment Case Data Set 1 – Sorted by Mint
Nickel Experiment Case Nickle Experiment Case Data Set 1 Data Set 1 Nickles Weights – Total Observatio n Mint Year 1 P 2001 Sorted Data 2 P 1999 Weight (grams) Mint Year Weight (grams) Bin Values Descriptive Statistics 3 D […]
Management Chapter 8 Homework This spreadsheet is designed for up to 50 samples
Morelia Mortgage Co. – with additional data NOTE THE MODIFICATIONS TO CELLS C12 AND C13 AS EXPLAINED IN THE TEXT SIDEBAR This spreadsheet is designed for up to 50 samples, each of a constant sample size from 2 to 10. […]
Management Chapter 8 Homework Create an empowered workforce that effectively uses
Morelia Mortgage Co. – Revised chart This spreadsheet is designed for up to 50 samples, each of a constant sample size from 2 to 10. Enter data ONLY in yellow-shaded cells. Enter the number of samples in cell E6 and […]
Management Chapter 8 Homework This spreadsheet is designed for up to 50 samples
Morelia Mortgage Co. – Original data This spreadsheet is designed for up to 50 samples, each of a constant sample size from 2 to 10. Enter data ONLY in yellow-shaded cells. Enter the number of samples in cell E6 and […]
Management Chapter 8 Designers must pay particular attention to cost, quality
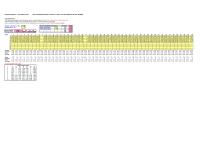
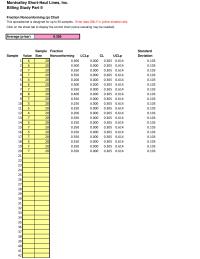
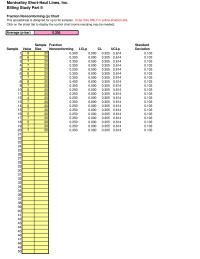
Montvalley Short-Haul Lines, Inc. Billing Study Part II Fraction Nonconforming (p) Chart This spreadsheet is designed for up to 50 samples. Enter data ONLY in yellow-shaded cells. Click on the sheet tab to display the control chart (some rescaling may […]
Management Chapter 8 A Samsung manager noted that 70 to 80 percent of quality
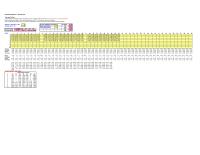
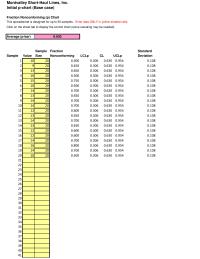
Montvalley Short-Haul Lines, Inc. Initial p-chart (Base case) Fraction Nonconforming (p) Chart This spreadsheet is designed for up to 50 samples. Enter data ONLY in yellow-shaded cells. Click on the sheet tab to display the control chart (some rescaling may […]
Management Chapter 8 Number Sample Defects Standard of Defects Size
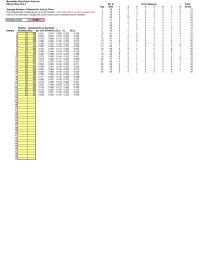
Montvalley Short-Haul Lines, Inc. Billing Study Part II No. of Error Category Total Day Bills 1 2 3 4 5 6 7 8 Errors Average Number of Defects Per Unit (u) Chart 156 22311315 18 This spreadsheet is designed for […]
Management Chapter 8 Mont valley Short haul Lines Inc Billing Study Part
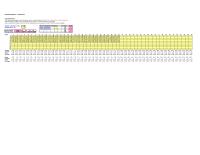
Montvalley Short-Haul Lines, Inc. Billing Study Part II Fraction Nonconforming (p) Chart This spreadsheet is designed for up to 50 samples. Enter data ONLY in yellow-shaded cells. Click on the sheet tab to display the control chart (some rescaling may […]
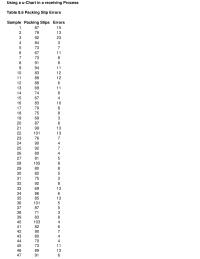
Management Chapter 8 Homework Using Uchart Receiving Process Table 86 Packing
24 90 4 25 92 7 26 80 4 27 81 5 28 105 8 29 80 8 Using a u-Chart in a receiving Process Table 8.6 Packing Slip Errors Sample Packing Slips Errors 187 15 279 13 392 23 […]
Management Chapter 8 Homework Click on the sheet tab to display the control chart
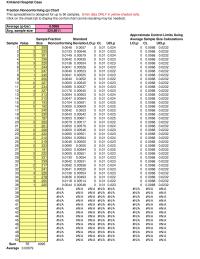
Kirkland Hospital Case Fraction Nonconforming (p) Chart This spreadsheet is designed for up to 50 samples. Enter data ONLY in yellow-shaded cells. Click on the sheet tab to display the control chart (some rescaling may be needed). Average (p-bar) Sample […]
Management Chapter 7 Homework Quality Practice Applying Qfd Managed Healthcare Direction
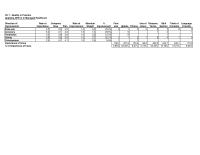
Ch 7 – Quality in Practice Applying QFD in in Managed Healthcare Direction of Rate of Company Rate of Absolute % Font Use of Glossary Q&A Table of Language Improvement Importance Now Plan Improvement Weight Improvement size Update Photos colors […]
Management Chapter 7 Homework Regression on number of units failed by month
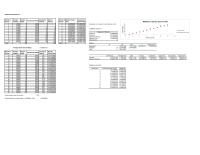
National Partamiento Co. Months in Service Number Installed Number Failed Number Not Failed Cumulative Failures Month x Failures Months in Service Monthly Failure Rate Cumulative Failure Rate 124440 124439 1 1 1 0.00004092 0.00004092 Regression on number of units failed […]
Management Chapter 7 Homework Whenever one falls out of formation
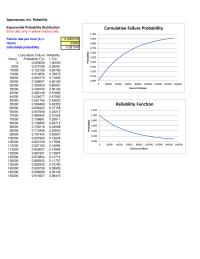
Spacescope, Inc. Reliability Exponential Probability Distribution Enter data only in yellow-shaded cells. 30000 0.390429 0.60957 35000 0.438700 0.56130 40000 0.483149 0.51685 45000 0.524077 0.47592 50000 0.561765 0.43823 55000 0.596468 0.40353 60000 0.628423 0.37158 65000 0.657848 0.34215 70000 0.684942 0.31506 0 […]
Management Chapter 7 Homework The next steps would include gathering
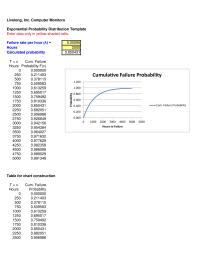
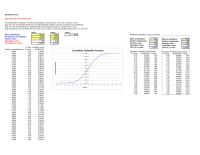
Livelong, Inc. Computer Monitors Exponential Probability Distribution Template Enter data only in yellow-shaded cells. Failure rate per hour (λ) = 0.00095 T = x Cum. Failure Hours Probability F(x) 1500 0.759492 1750 0.810336 2000 0.850431 2250 0.882051 2500 0.906986 2750 […]
Management Chapter 7 Homework What would your next steps be?
Broadtred Tire Co. Enter data only in the shaded cells This spreadsheet is designed to calculate the probability of values equal to, or less than, a desired x value, given the mean and standard deviation of a normally distributed variable. […]