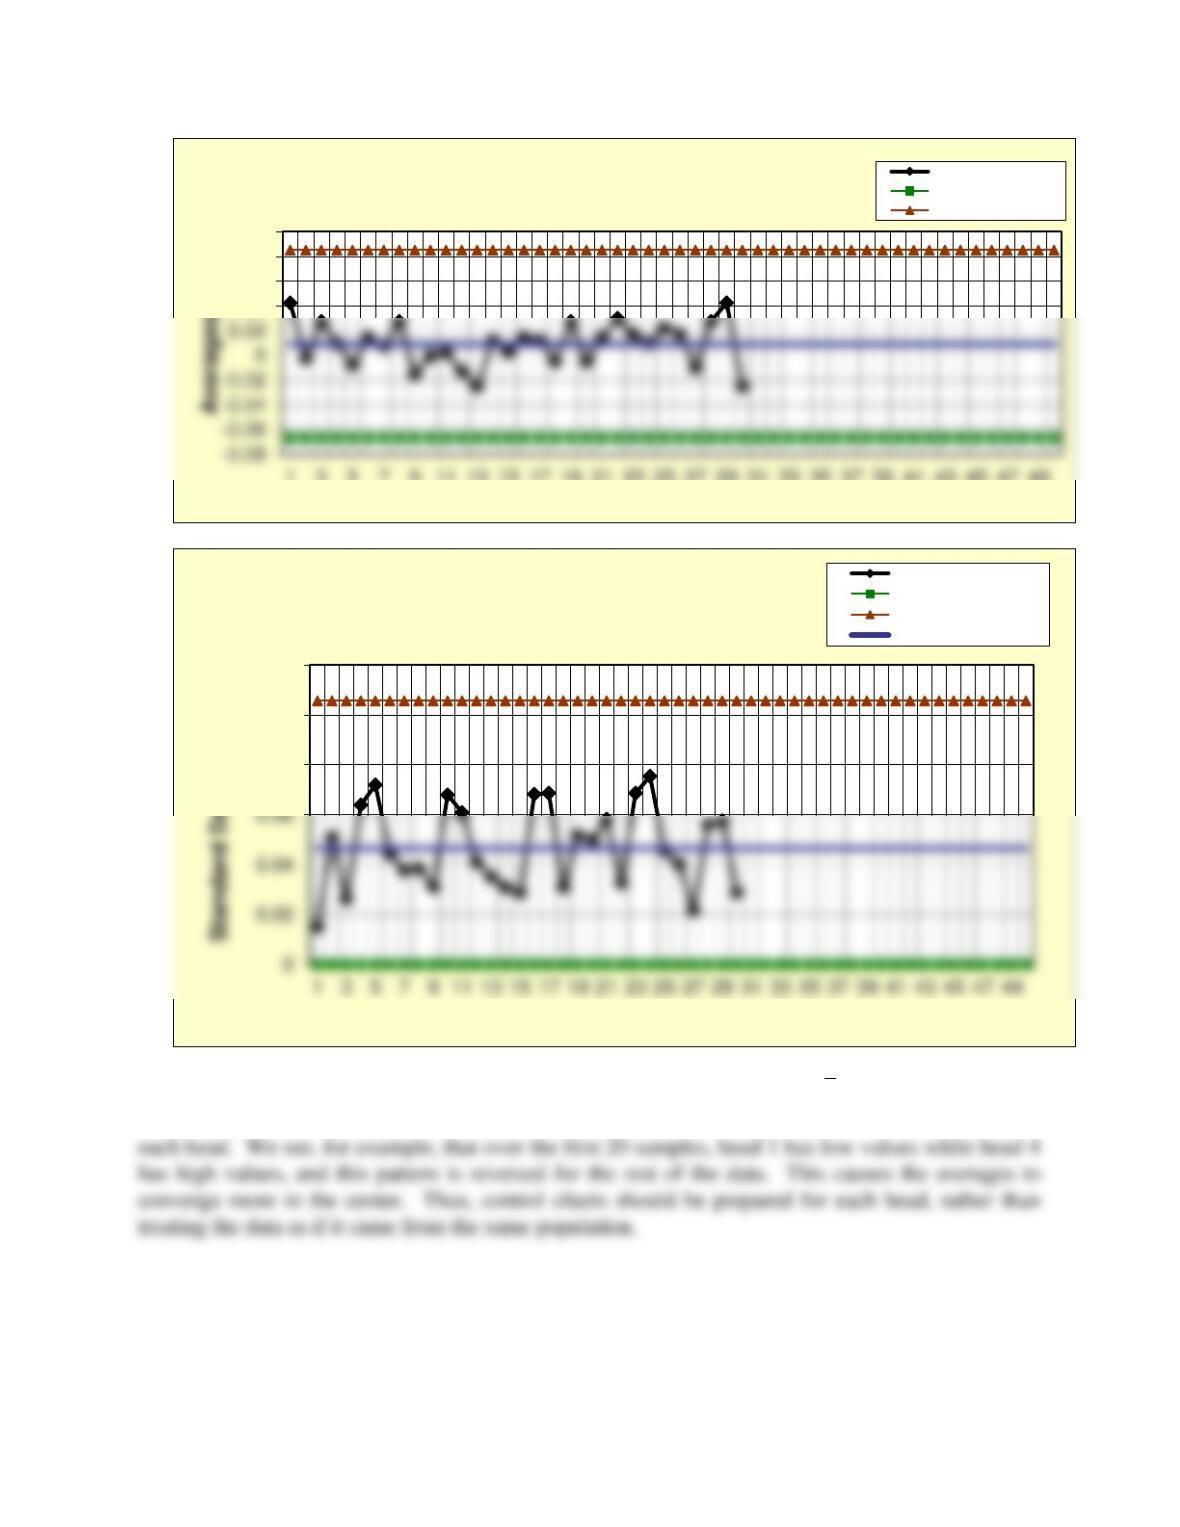
We can see that the process appears to be “hugging the centerline” in the
x
– chart. The cause for
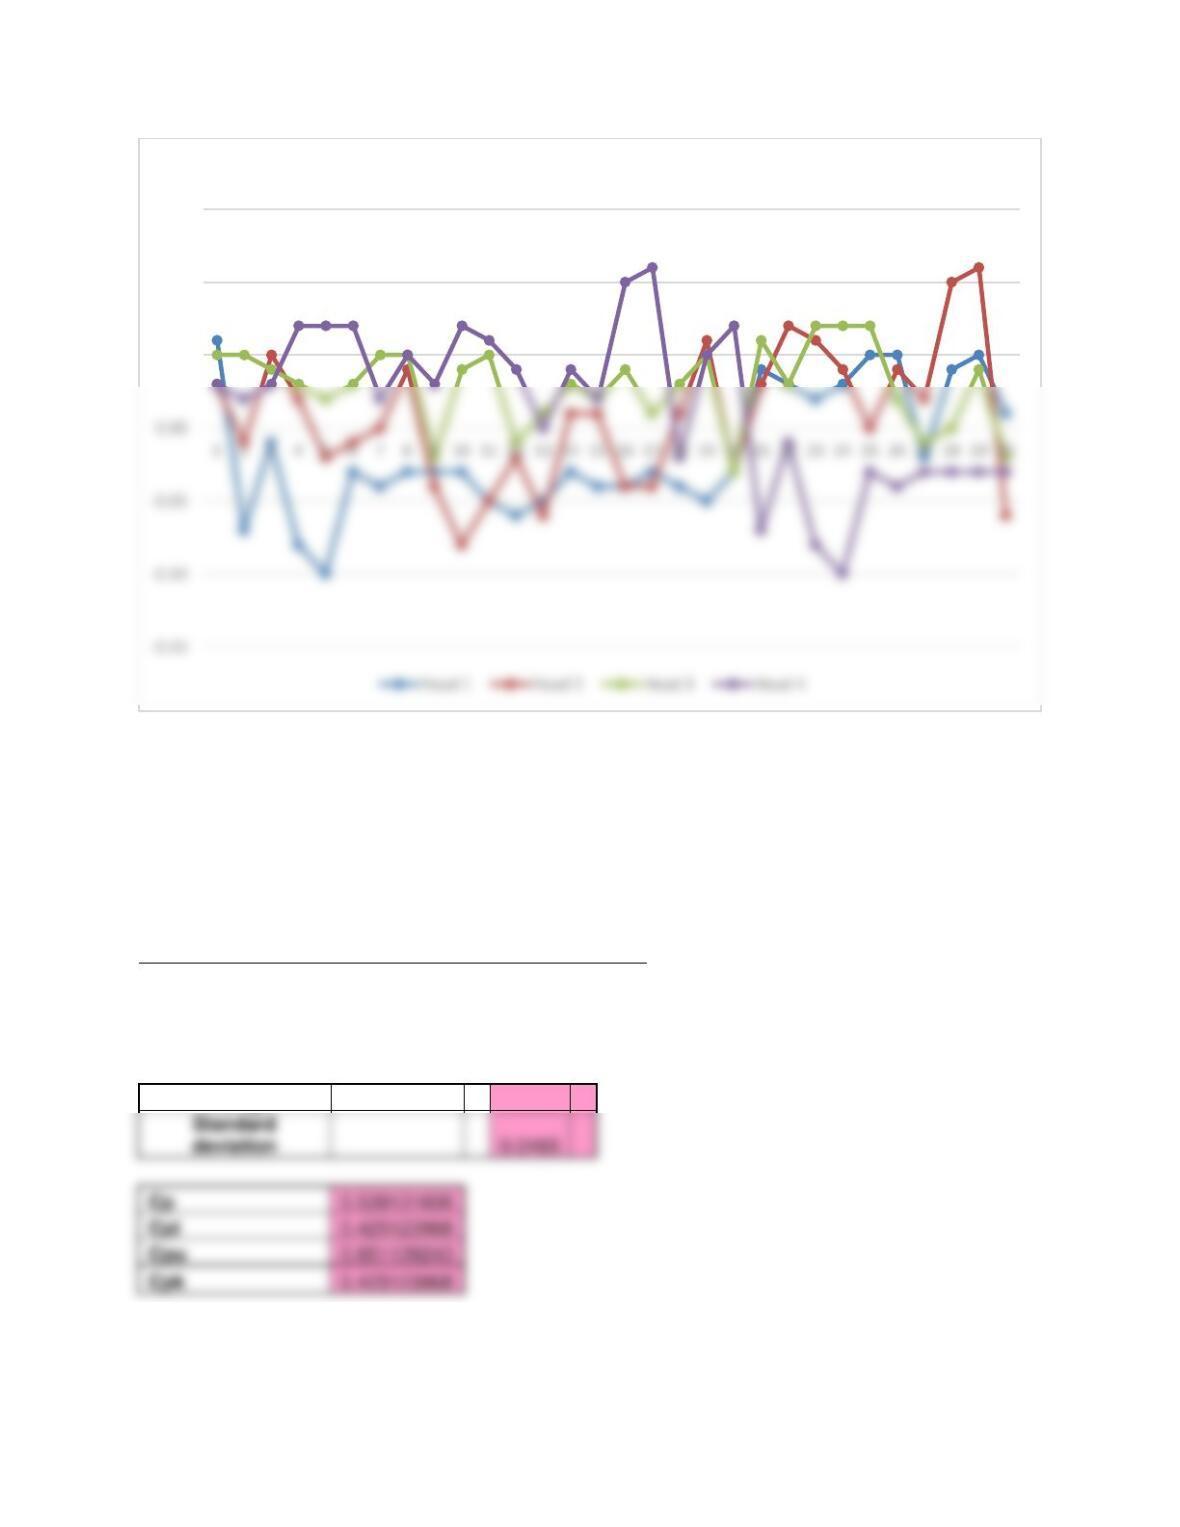
this condition may be judged from the structure of the data. The chart below shows a run chart for
0.04
0.06
0.08
0.1
1 3 5 7 9 11 13 15 17 19 21 23 25 27 29 31 33 35 37 39 41 43 45 47 49
Sample number
Prob. 8-36 X-bar Chart
Averages
Lower control limit
Upper control limit
0.08
0.1
0.12
Sample number
Prob. 8-36 s-Chart
Standard Deviations
Lower control limit
Upper control limit
Center line
37. Calculate the process capability statistics for the outside diameters of the bottles made
on the injection molding machine at the Moby Molding Co. in Problem 8.36. Use the
Process Capability Excel template with 0.1 as the upper tolerance limit and – 0.05 as the
lower tolerance limit for this important measure of process performance. What
recommendation would you make to management concerning the process, based on these
findings?
See Excel file Problem 8.37 in the instructor materials.
Process Capability Index Calculations
Average
0.0093
0.05
0.10
0.15
Run Chart for Individual Heads
0.0465
0.538131606
Cpl
0.425123968
Cpu
0.651139243
Cpk
0.425123968
38. Chief Henry Batter of the Gotham City Police Department is trying to reduce the time
required to answer the phone at police headquarters (in fractions of a minute). The data
are provided in the C08 Problem Data workbook, and represent time in fractions of
minutes for three individual readings taken at random for 25 days. Use the X&MR Excel
template with a 3-period moving range to construct an x– and moving range-chart for this
series of data and interpret the results. How does the estimate of the standard deviation
based on the average range, which is used in the x-chart, compare to the actual standard
deviation of the data?
See Excel file Problem 8.38 in the instructor materials.
20
25
30
35
40
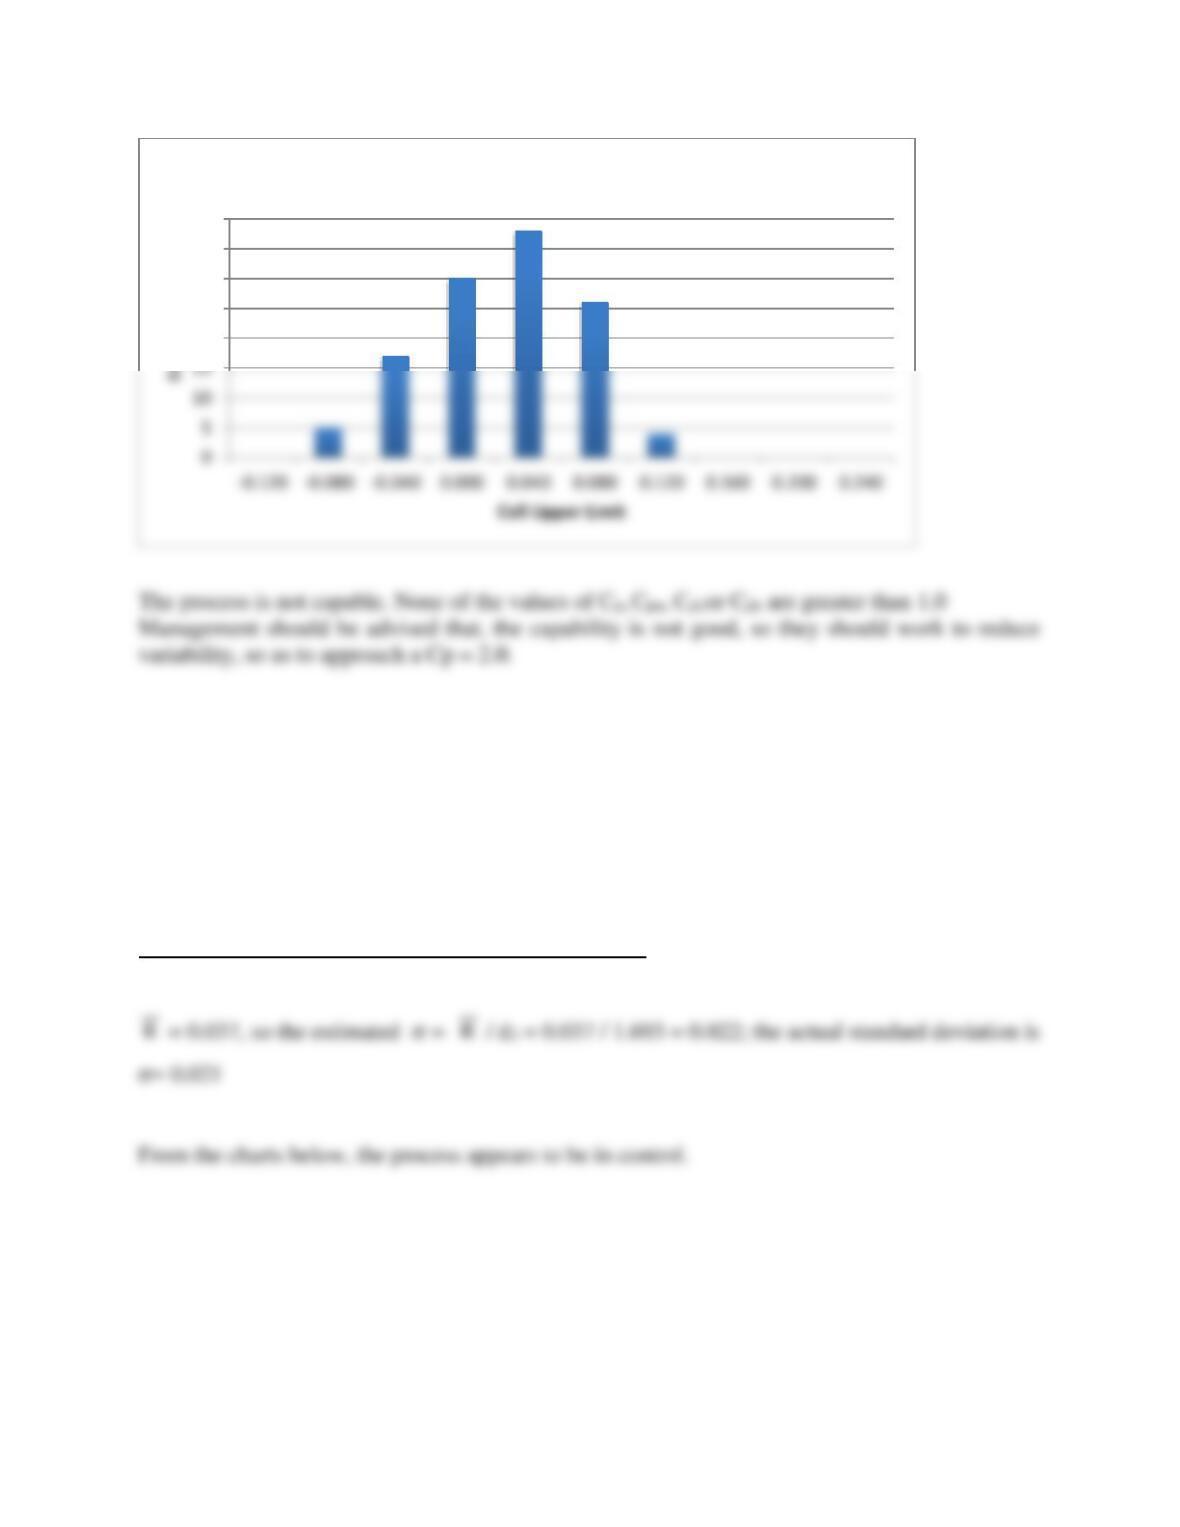
Histogram
0.65
0.81
0.83
0.85
1 4 7 10 13 16 19 22 25 28 31 34 37 40 43 46 49 52 55 58 61 64 67 70 73
Observation number
Prob. 8-38 – Individuals (X) Chart
Individuals
Upper control limit
Center line
Lower control limit
0.08
0.09
0.1
Observation number
Prob. 8-38 Moving Range Chart
Moving ranges
Lower control limit
Center line
Upper control limit
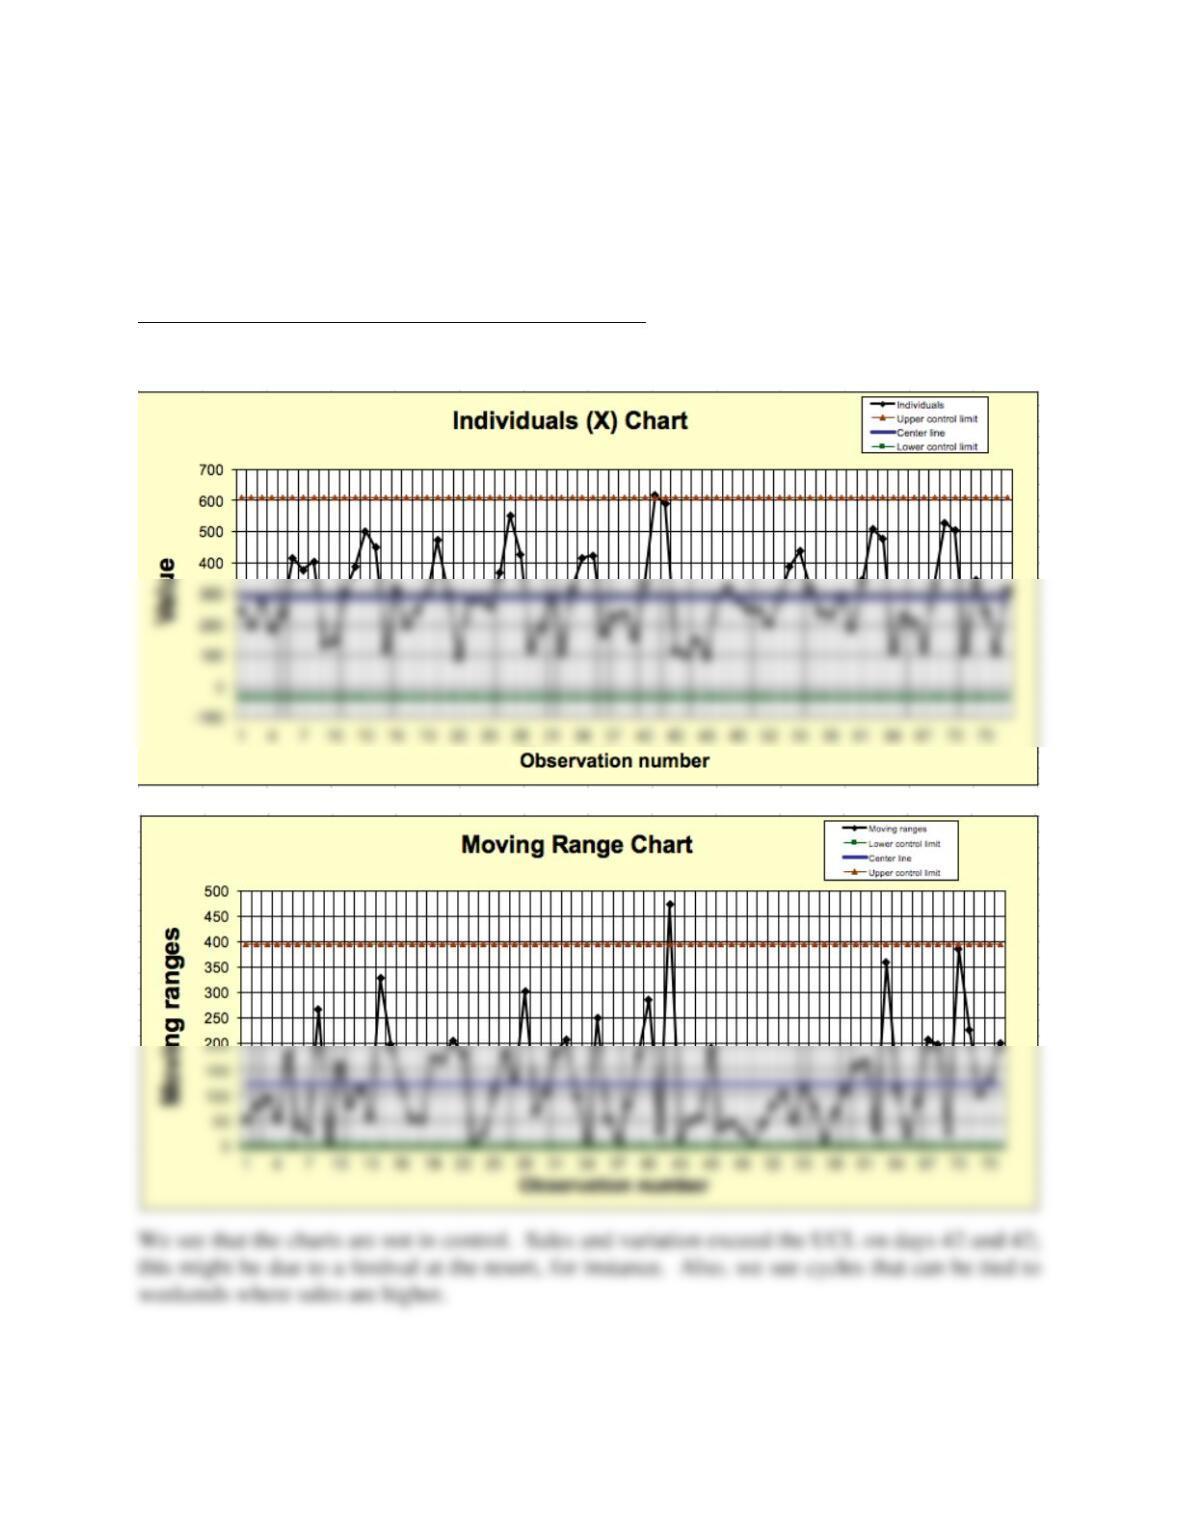
39. Charlie’s China Emporium sells a variety of imported items at a seaside resort. The
store owner wants to monitor daily sales, which are provided for 75 days in the C08
Problem Data workbook. Use the X&MR Excel template to construct an x– and moving
range-chart for this series of data and interpret the results. Compare a 2-period and 5-
period moving range and comment on the results.
See Excel file Problem 8.39 in the instructor materials.
Two-period moving range:
Five-period moving range:
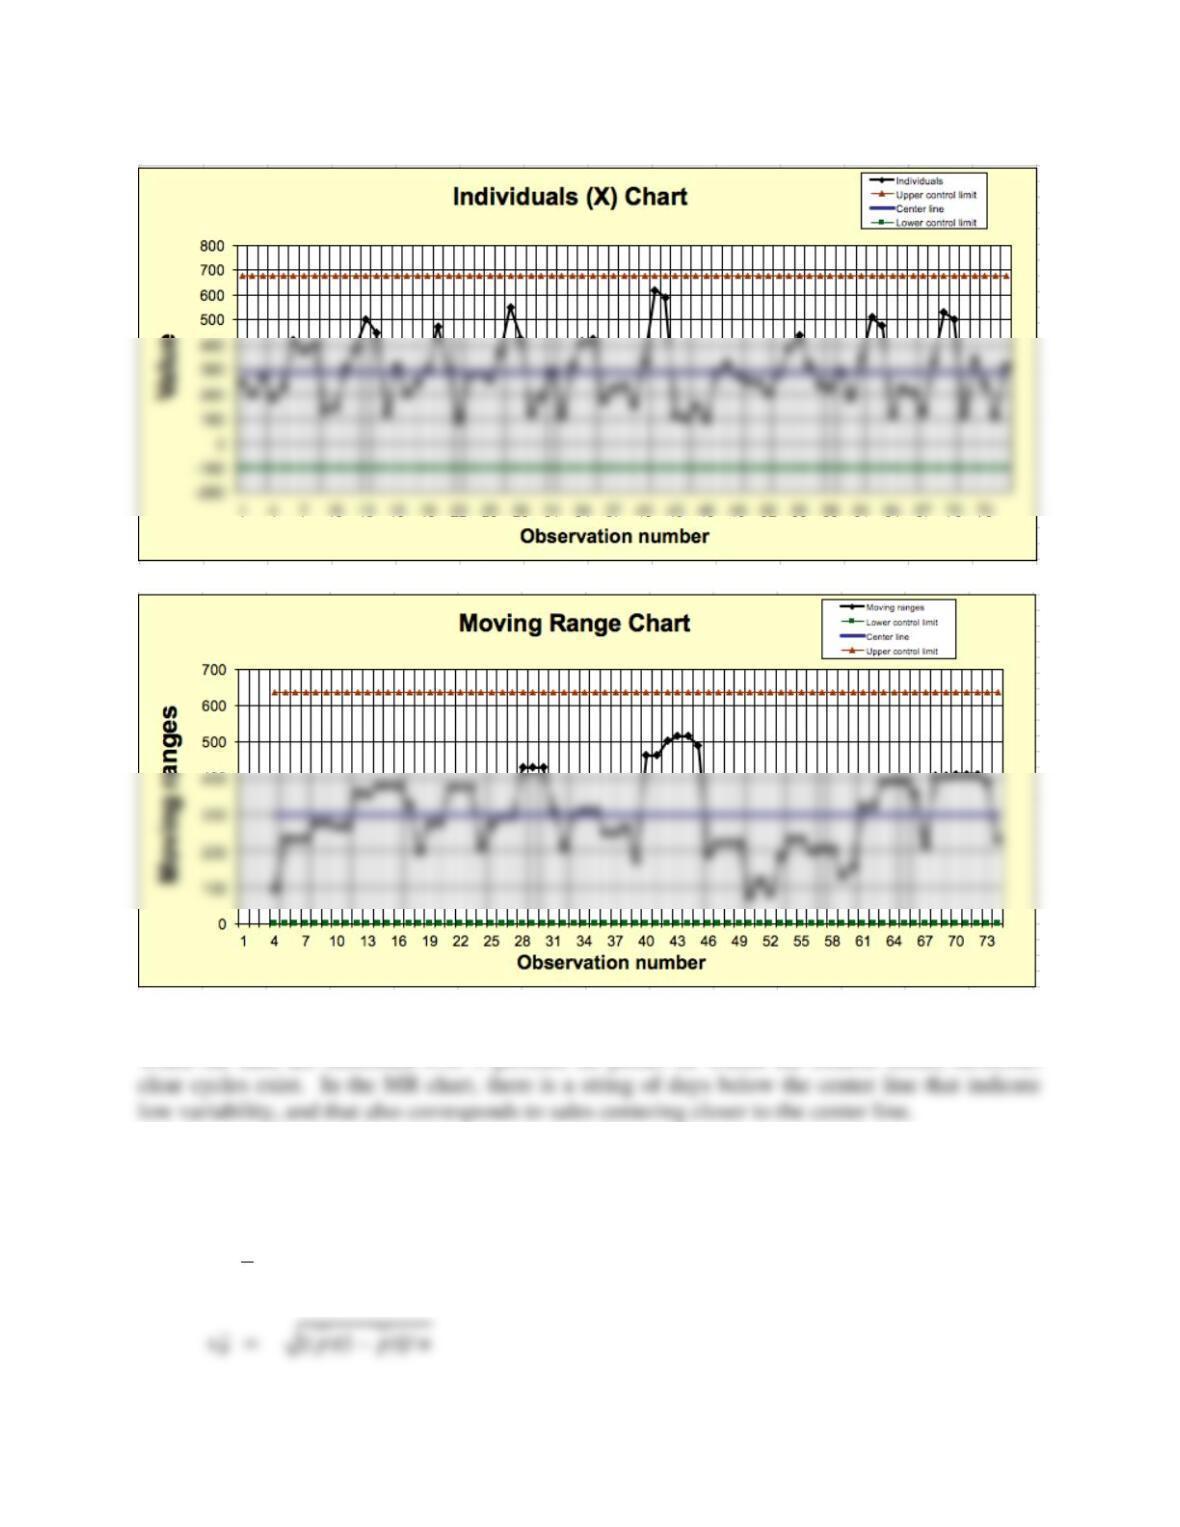
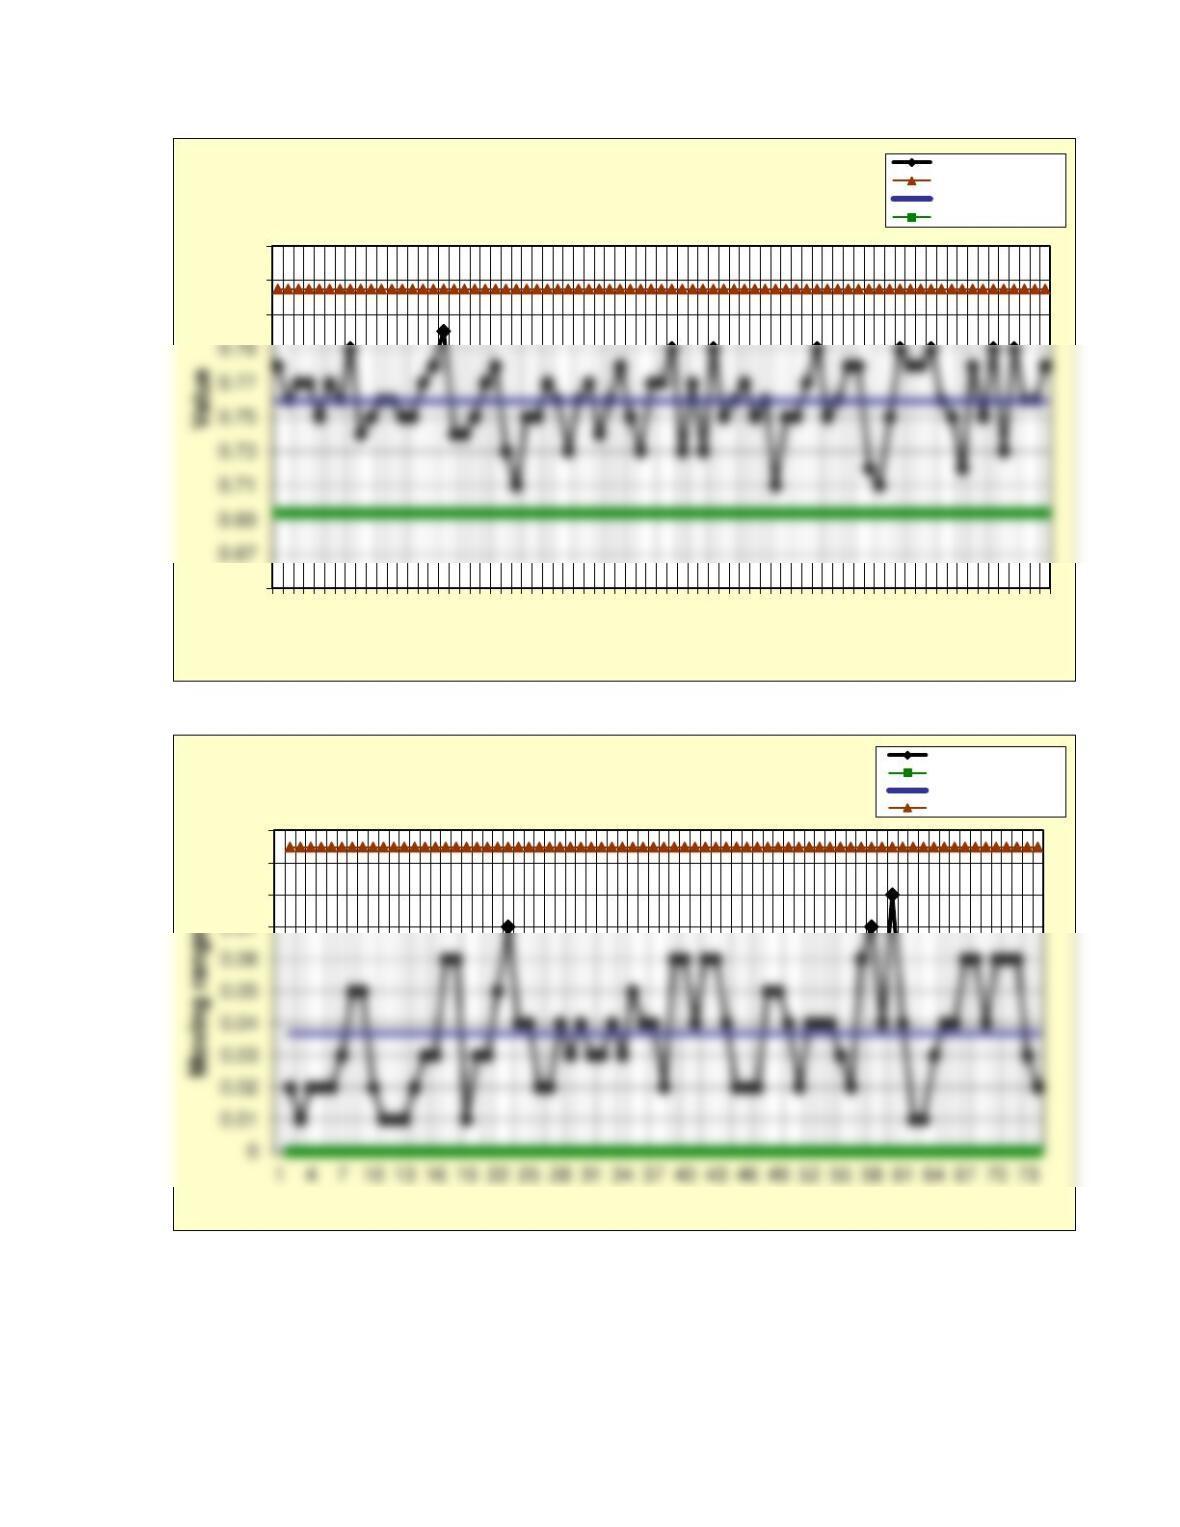
When the data are smoothed over 5 periods, all points lie within the control limits; however,
40. Thirty samples of 100 items each were inspected at the Rummy Candy Company and
150 items were found to be defective. Compute control limits for a p-chart for this process.
CL
p
= 150/3000 = 0.0500
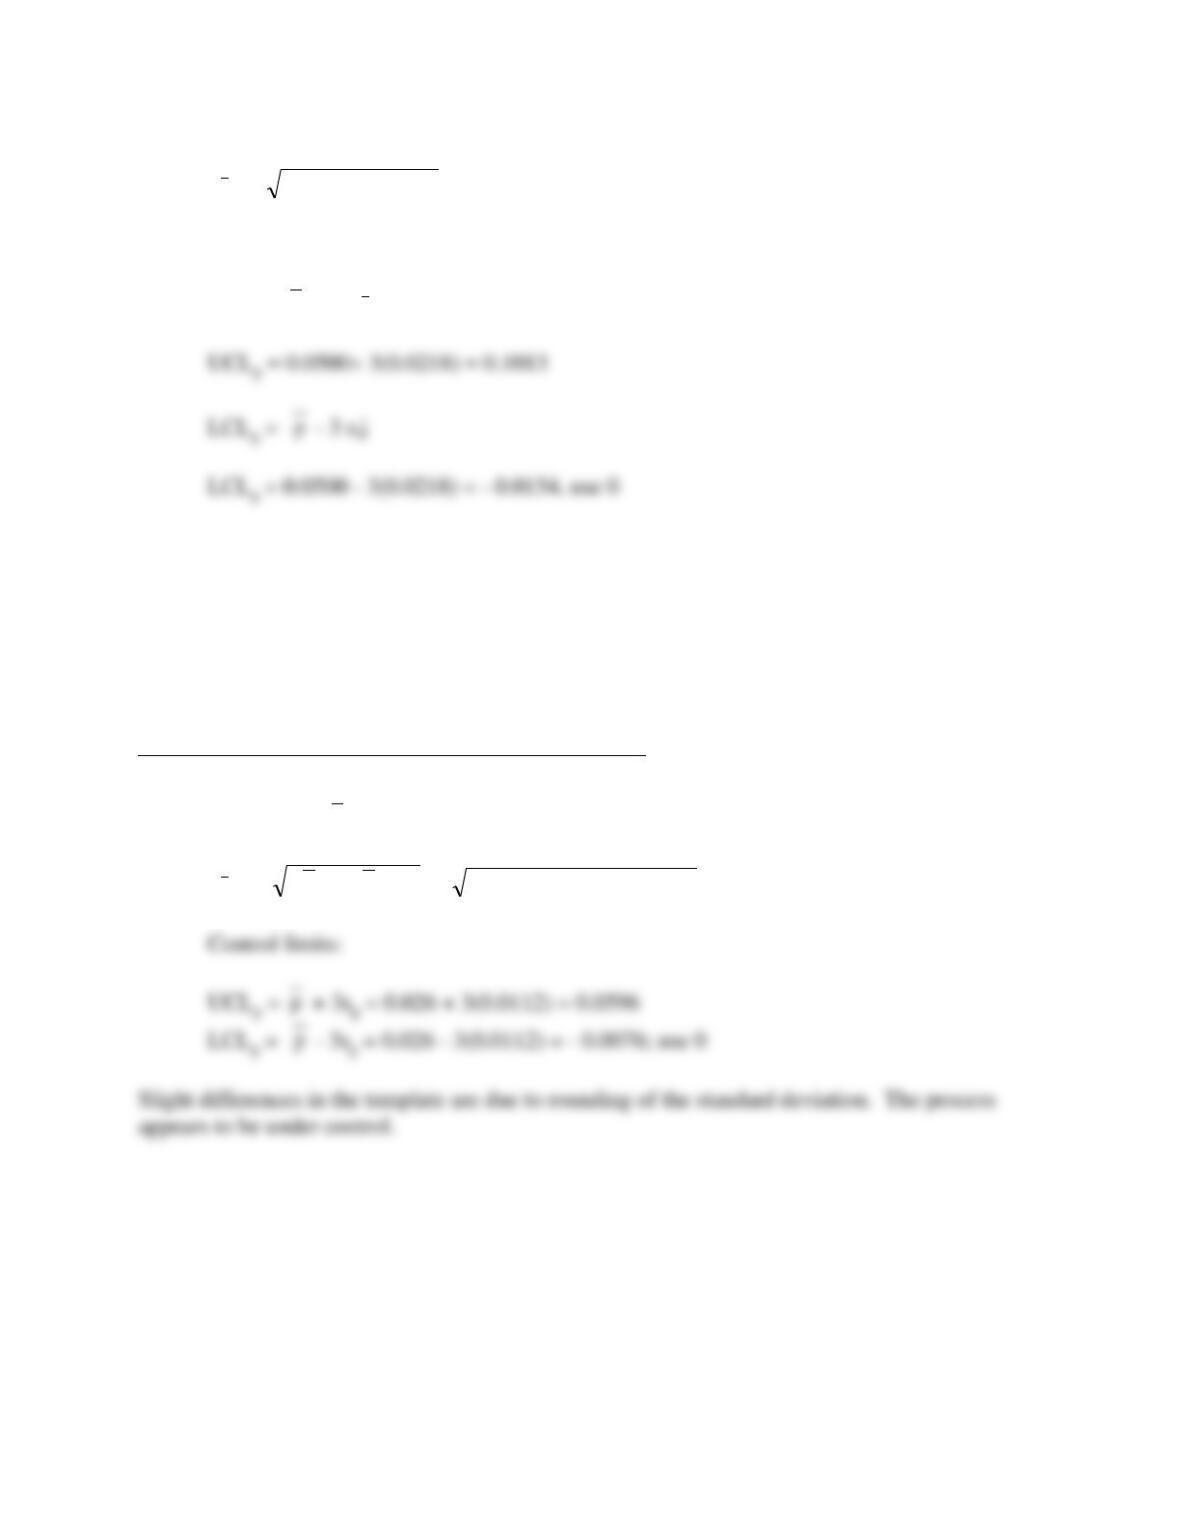
s
p
=
(0.95)/100 (0.05)
= 0.0218
Control limits:
UCLp =
p
+ 3 s
p
41. Samples of package orders were taken at the Altodiez Package Co. to determine if the
orders were prepared correctly. The number of orders with errors for each of 25 days are
given in the C08 Problem Data workbook. Two hundred orders are inspected each day.
Compute the control limits for a p-chart using the appropriate formulas and then verify
your calculations using the p-chart Excel template. Examine the p-chart and interpret the
results.
See Excel file Problem 8.41 in the instructor materials.
Center line:
p
= 0.026
s
p
=
[( )( )] /p p n1−
=
00(0.974)]/2 [(0.026)
= 0.0112
p
p
42. One hundred insurance claim forms are inspected daily at Full Life Insurance Co. over
25 working days, and the number of forms with errors have been recorded as shown in the
C08 Problem Data workbook. Construct a p-chart using the Excel template. If any points
occur outside the control limits, assume that assignable causes have been determined. Then
construct a revised chart.
See Excel file Problem 8.42 in the instructor materials.
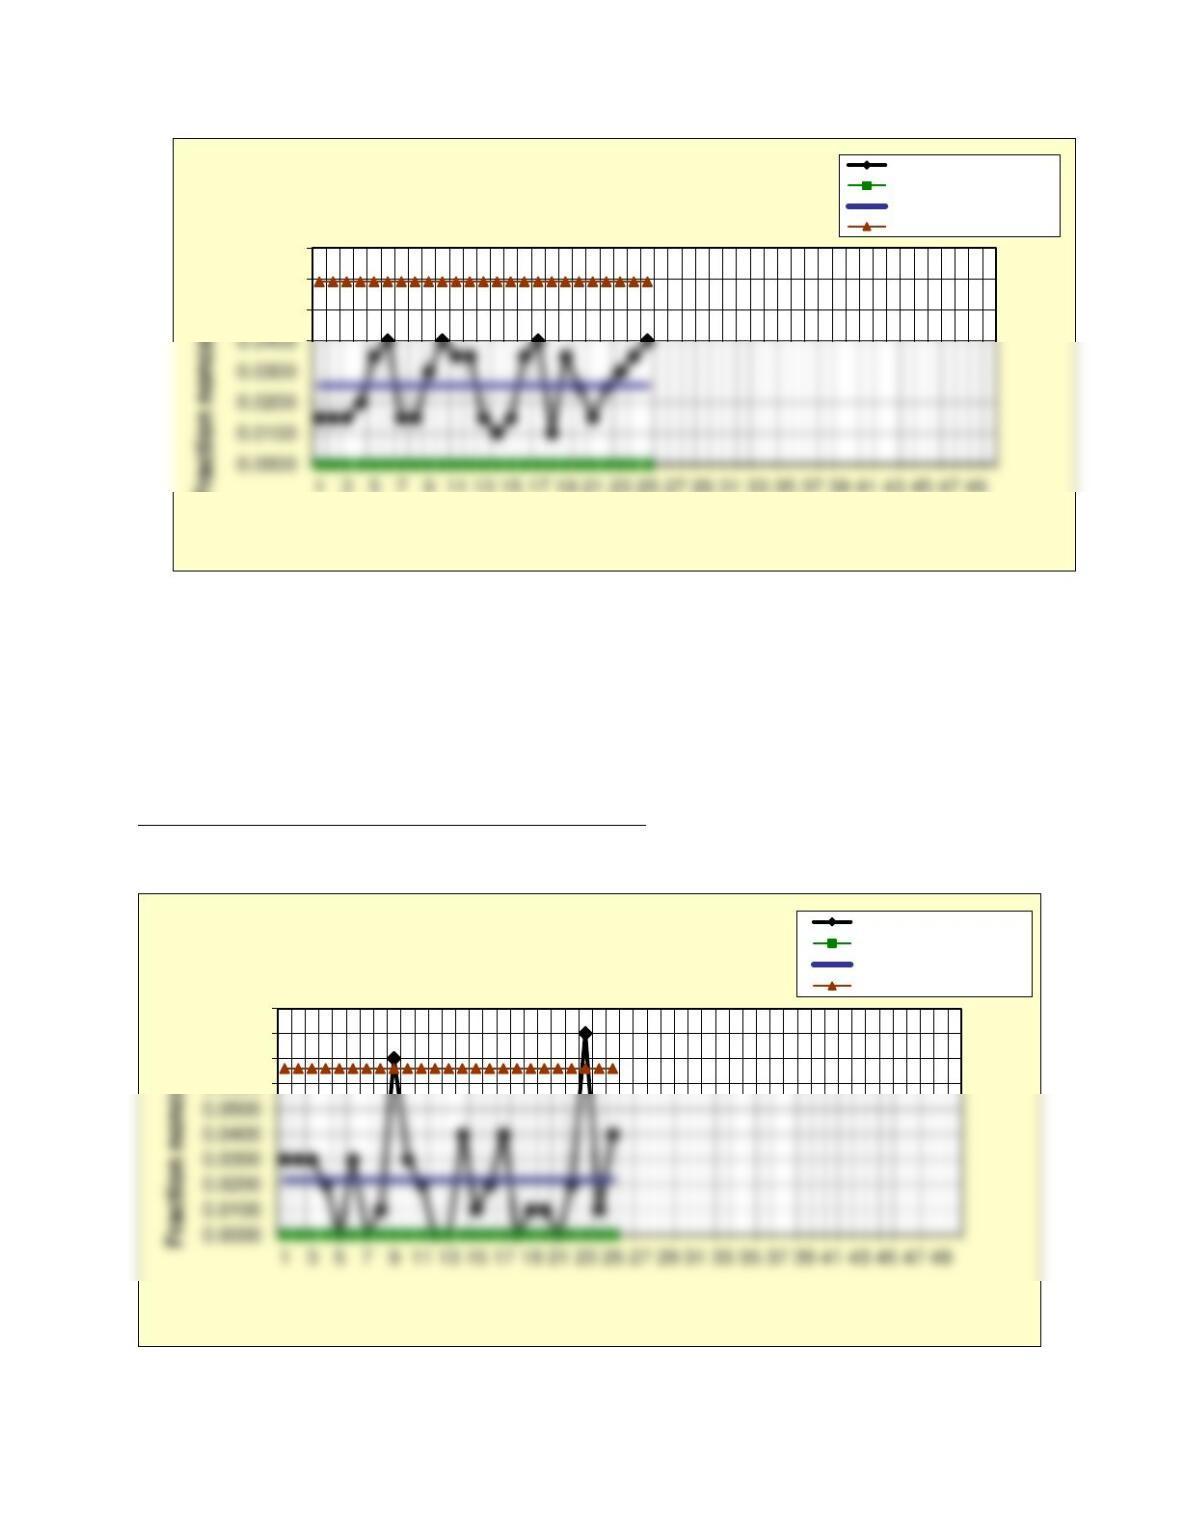
The initial chart is shown below.
0.0500
0.0600
0.0700
1357911 13 15 17 19 21 23 25 27 29 31 33 35 37 39 41 43 45 47 49
Fraction nonconforming
Sample number
Prob. 08-41 Attribute (p) Chart
Fraction nonconforming
Lower control limit
Center line
Upper control limit
0.0600
0.0700
0.0800
0.0900
Sample number
Prob. 8-42 Initial Attribute (p) Chart Fraction nonconforming
Lower control limit
Center line
Upper control limit
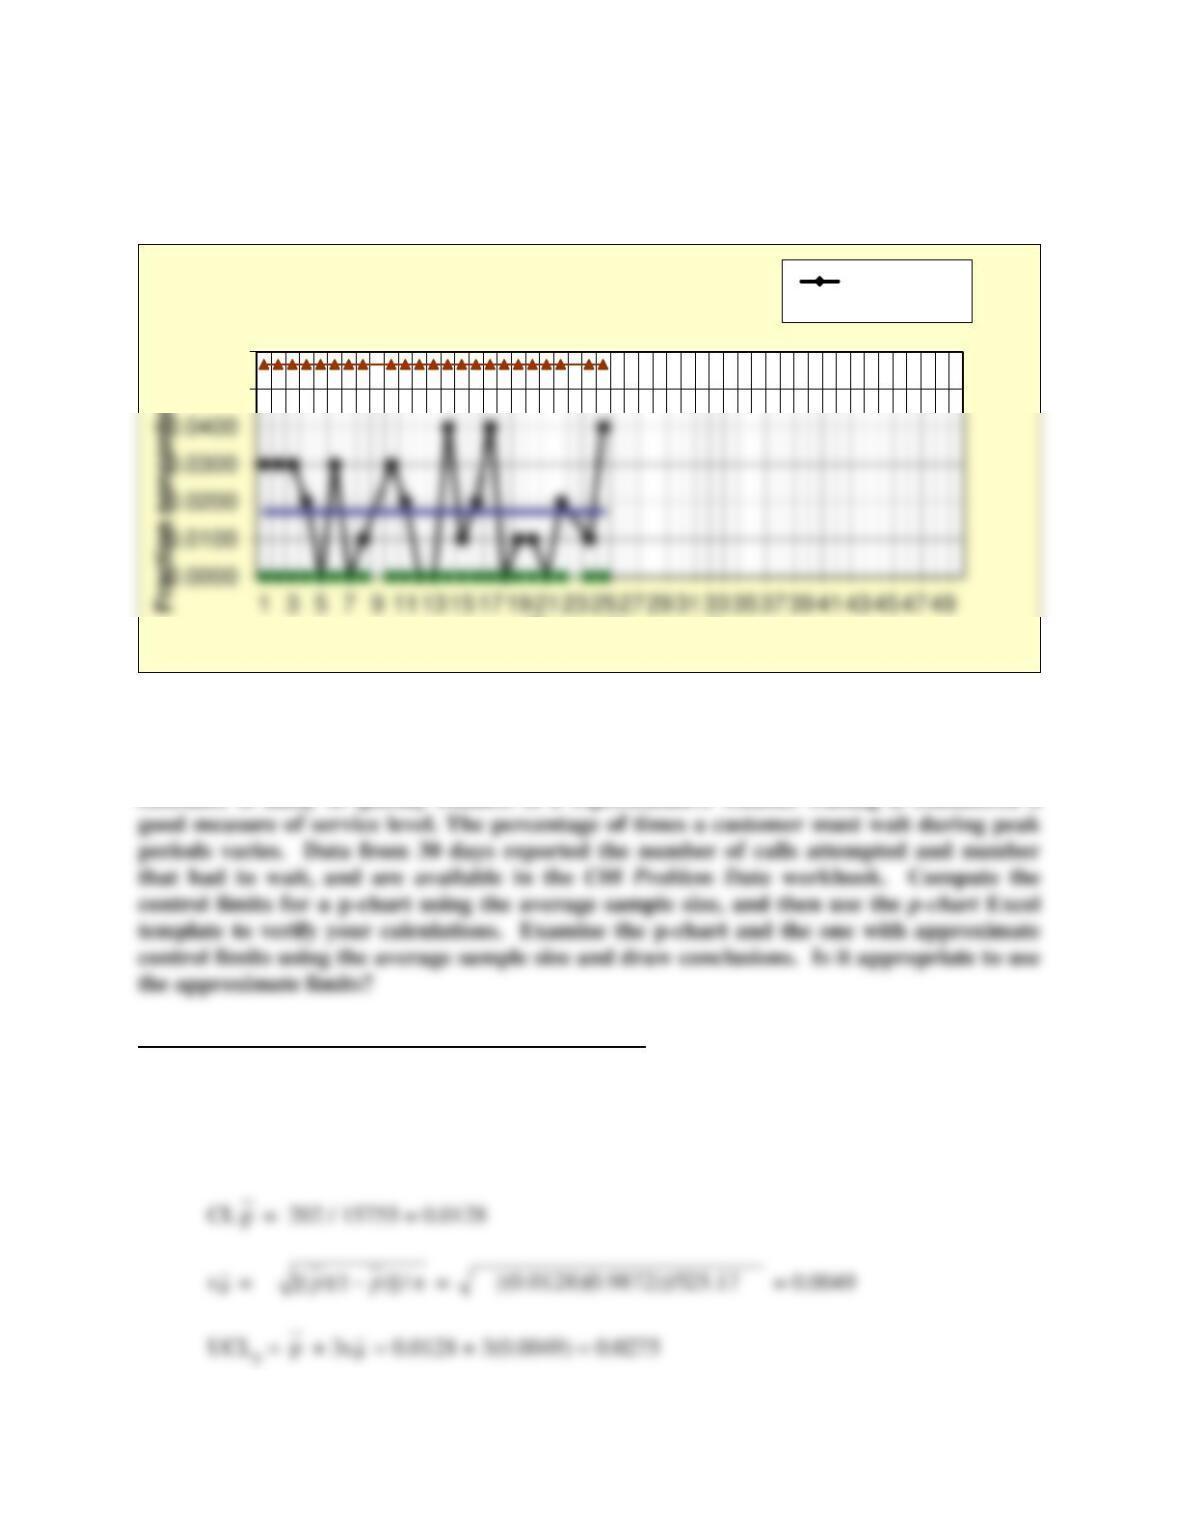
Samples #9 and #23 are out-of-control. Delete these to find the revised chart (note the sidebar
comment in the text about interpolating deleted data; this can be seen from the missing values in
the control limits). The process is now under control.
43. The manager of a customer service call center is concerned that the level of access of
customers is decreasing, due to heavier use. The proportion of peak period time when a
customer is likely to quickly connect to a representative without waiting is considered a
See Excel file Problem 8.43 in the instructor materials.
Approximate control limit calculations:
The average sample size = 15755/30 = 525.17
0.0500
0.0600
Sample number
Revised Attribute (p) Chart Fraction
nonconforming
LCLp =
p
– 3s
p
= 0.0128 – 3(0.0049) = – 0.0019, use 0
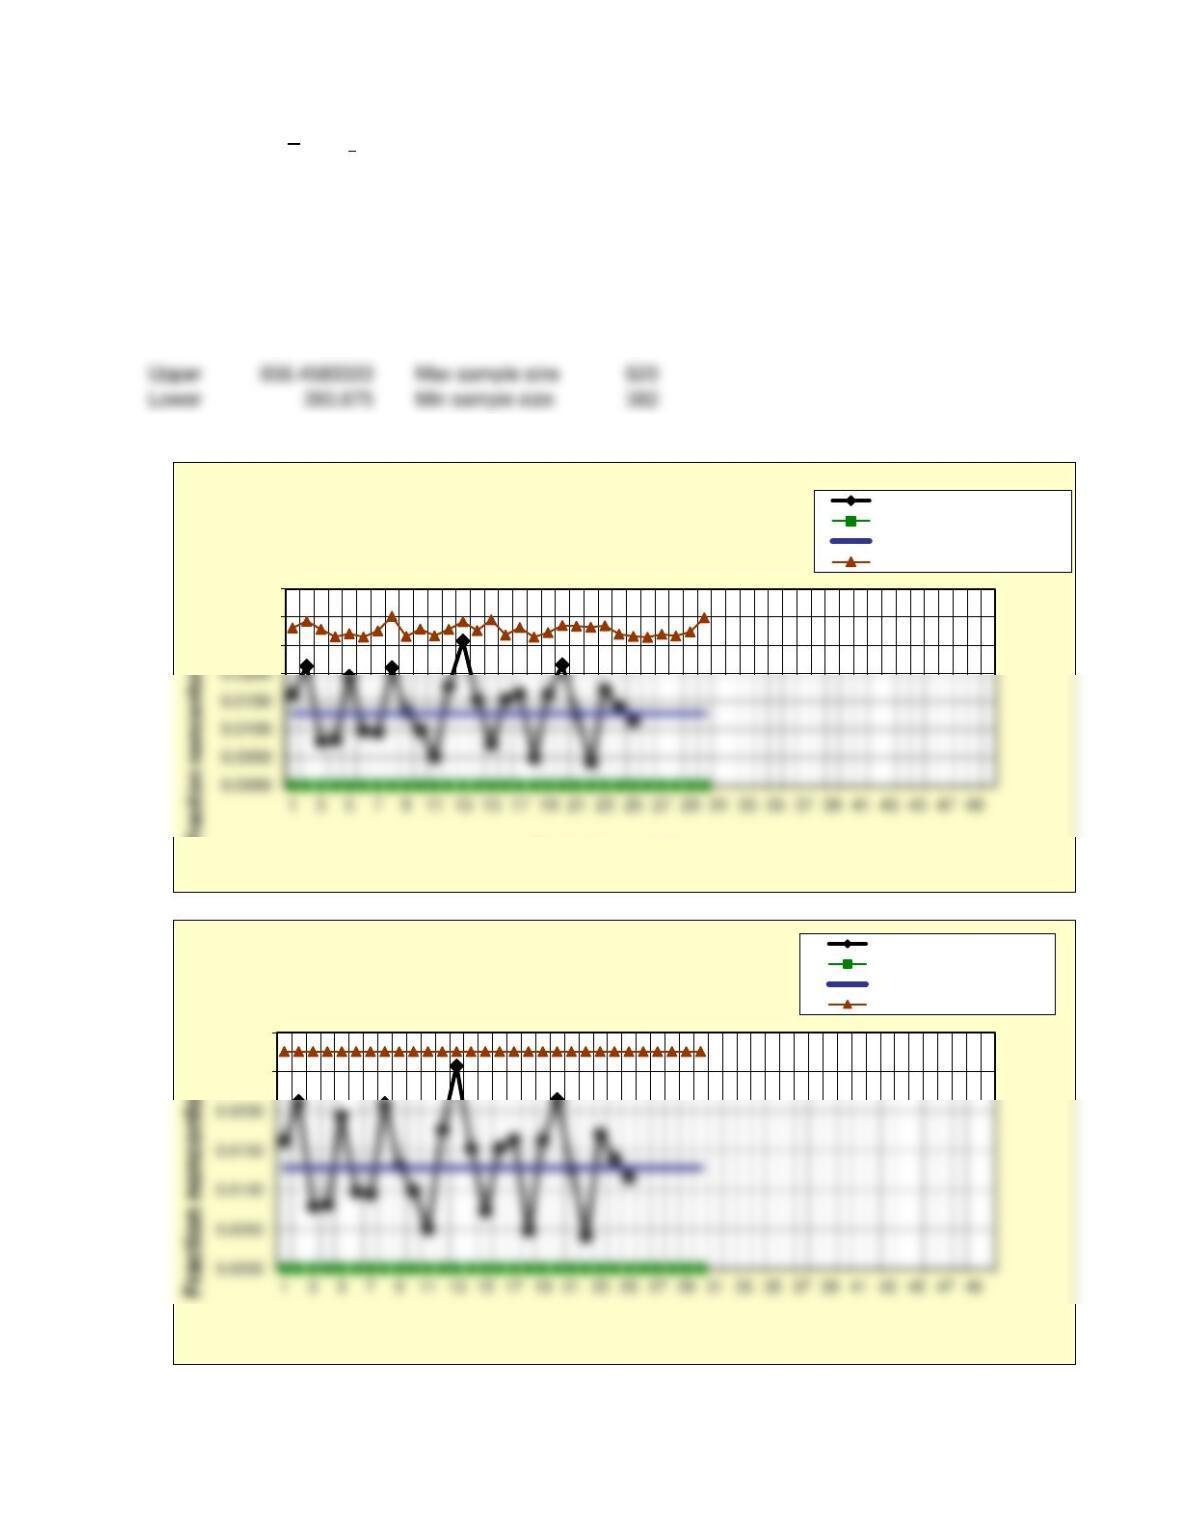
For both charts shown below, all points fall within the control limits, so the service level appears
to be in control. To check whether sample sizes fall within 25% of the average sample size, we
calculated the following:
Sample size limits within 25% of the average sample size
Only one sample (#8) falls below the lower limit, but this does not appear to affect the results.
0.0250
0.0300
0.0350
Fraction nonconforming
Sample number
Prob. 8-43 Attribute (p) Chart
Fraction nonconforming
Lower control limit
Center line
Upper control limit
0.0250
0.0300
Sample number
Prob. 8-43 Attribute (p) Chart
(approximate control limits)
Fraction nonconforming
Lower control limit
Center line
Upper control limit
Upper
Max sample size
Lower
Min sample size
44. Compute the control limits for an np-chart using the data in Problem 42 for the Full
Life Insurance Co. using the appropriate formulas. Then verify your calculations using the
np-chart Excel template. Explain the relationship between the control limits for the np–
chart and those for the p-chart in Problem 42. Compare the charts and explain the
differences.
This problem is intended to help students understand the relationship between the p- and np-
charts.
See Excel file Problem 8.44 in the instructor materials.
Control limit calculations:
CL n
p
= n
p
= 100 (0.022) = 2.2
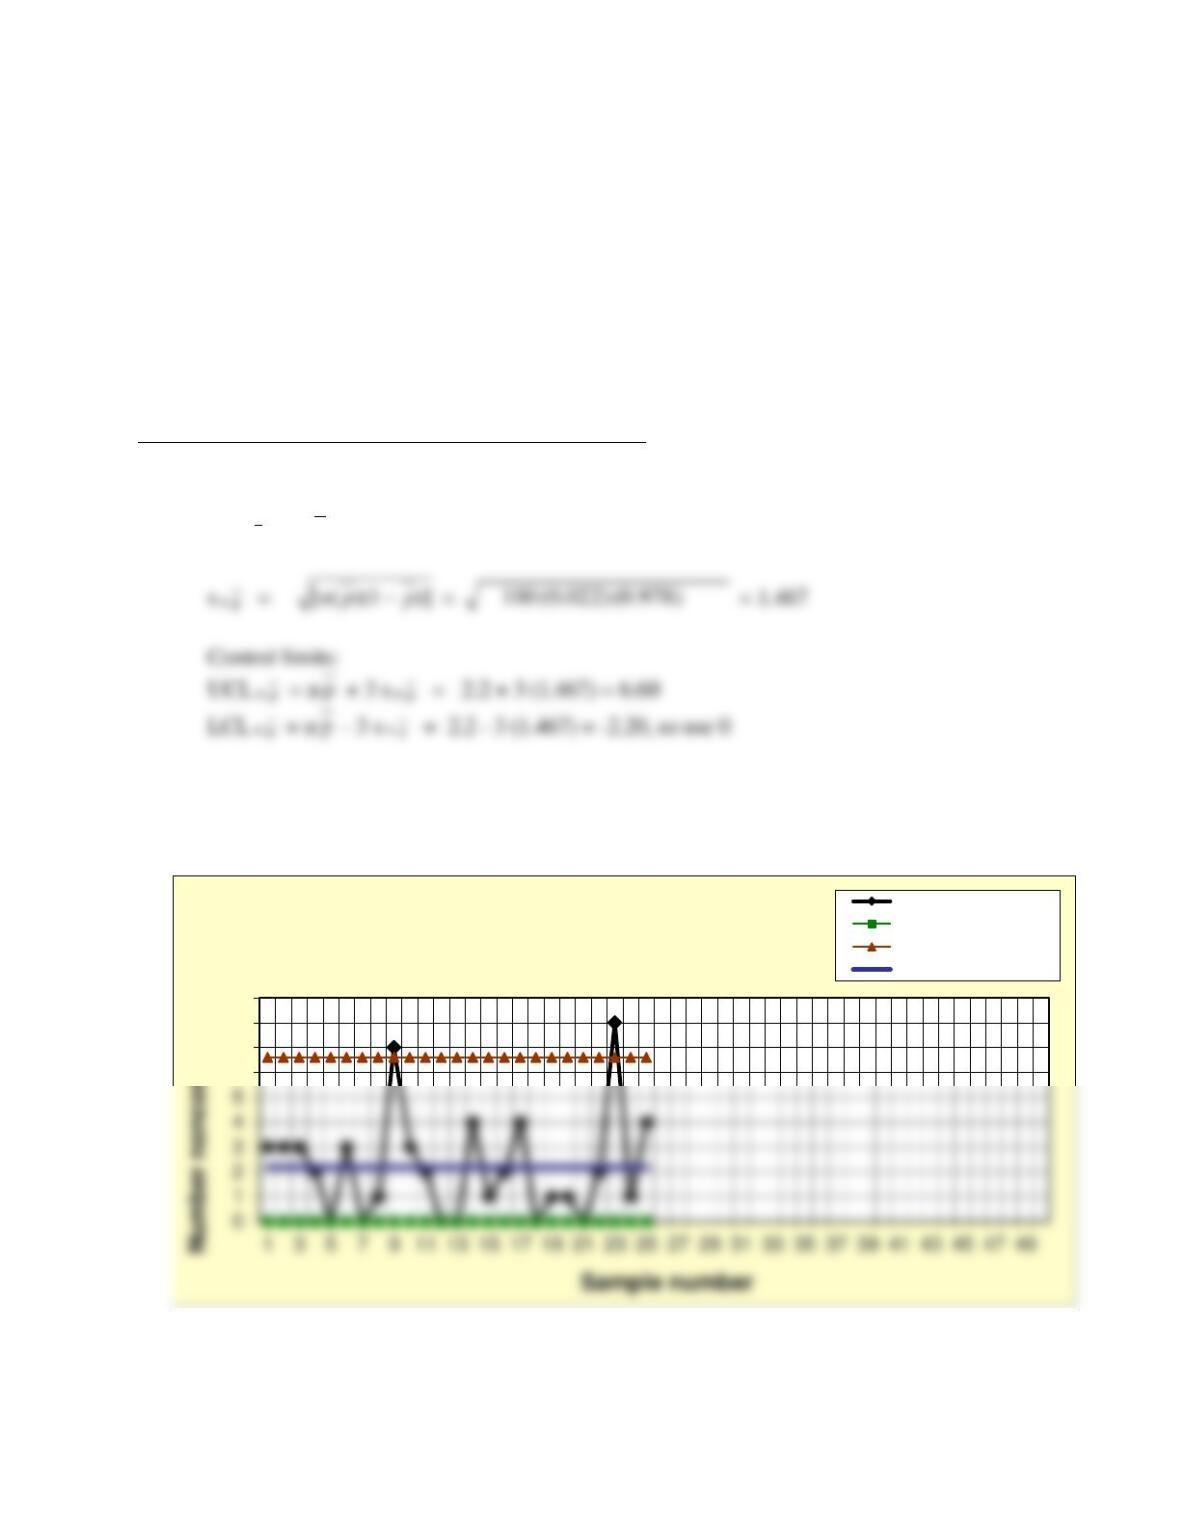
The only difference is the scaling. For the np-chart, the sample size is not reflected in the number
noncomforming so the control limits for np are simply those for the p-chart multiplied by the
sample size of 100. In comparing the charts, the only difference is the scale on the y-axis.
6
7
8
9
Prob. 8-44
Number nonconforming (np) chart
Number nonconforming
Lower control limit
Upper control limit
Center line
p
p
45. Construct an np-chart for the Dennis Manufacturing Company using the data in the
C08 Problem Data workbook and the np–chart Excel template. The data represent the
number of defective parts found in 30 samples, each of size 50. Explain the results.
See Excel file Problem 8.45 in the instructor materials.
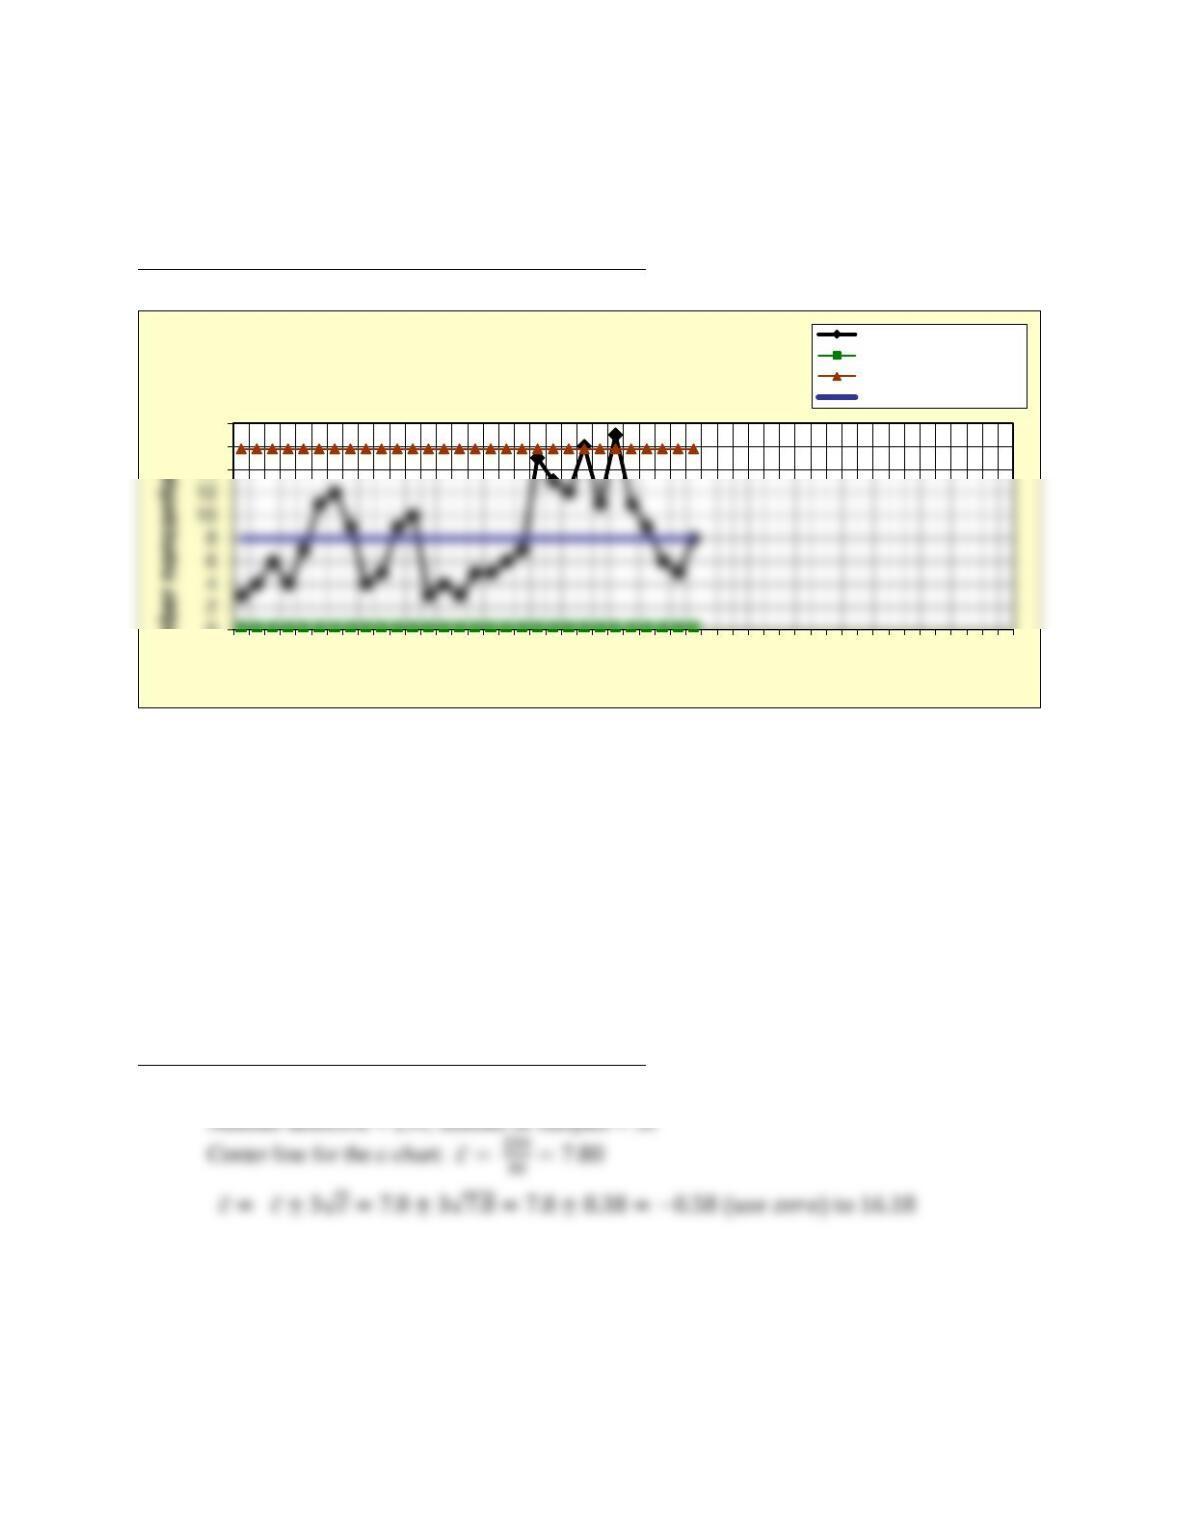
The manufacturing process is clearly out of control; defects rose substantially beginning with
sample 20 before stabilizing again. The cause of this condition should be investigated.
46. Federal Scanline, Inc. uses a scanner on a conveyor line that scans 1,000 packages per
hour. Packages which have defective labels or detectable damage to the package are
automatically offloaded and hand-checked. Defects might be a number missing from a zip
code, a missing addressee name or partially missing address, or a damaged package or
missing address label. Compute the control limits for a c-chart using the appropriate
formulas for the data provided in the C08 Problem Data workbook. Then use the c-chart
Excel template to verify your calculations and construct the chart. Interpret the results.
See Excel file Problem 8.46 in the instructor materials.
0
14
16
18
1 3 5 7 9 11 13 15 17 19 21 23 25 27 29 31 33 35 37 39 41 43 45 47 49
Number nonconforming
Sample number
Prob. 8-45 A
Number nonconforming (np) chart
Number nonconforming
Lower control limit
Upper control limit
Center line
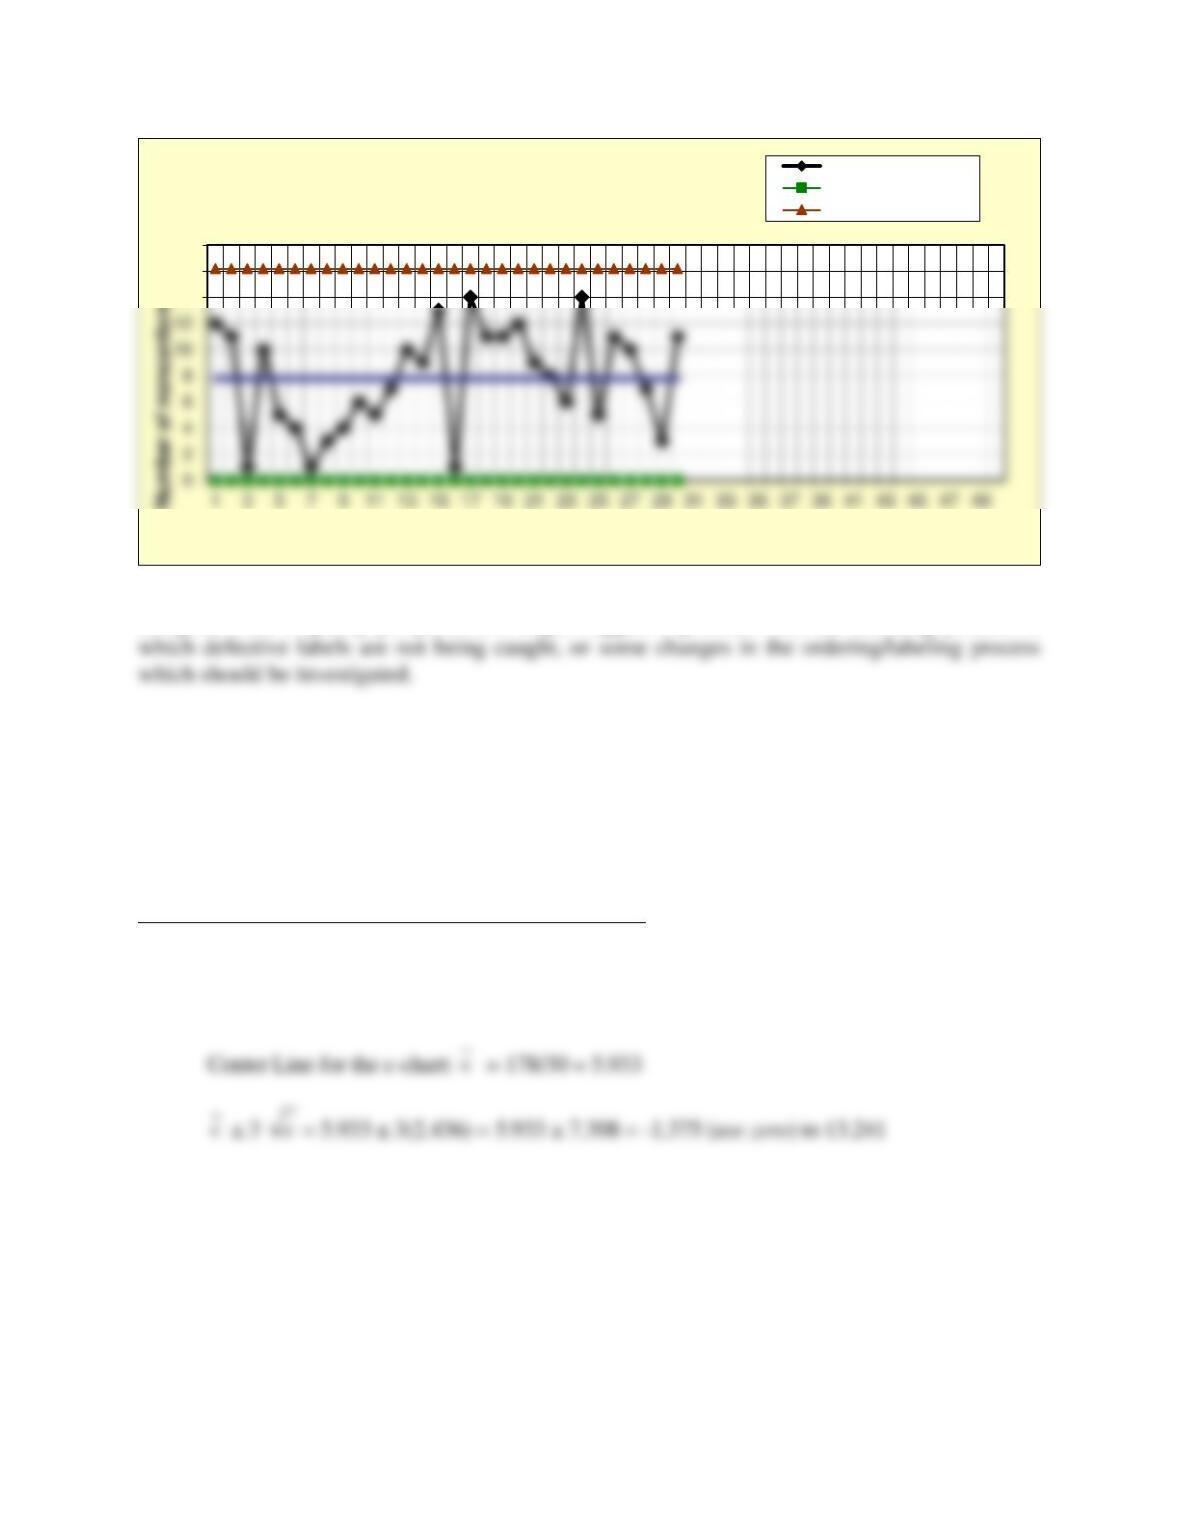
There are eight points below the center line from samples 5 through 12. While smaller values
are good from a quality perspective, it might suggest a problem with the scanning process in
47. PharmaExpress, Inc., a mail-order prescription drug vendor, measured the number of
errors per standard 200-line order being picked in their distribution center as provided in
the C08 Problem Data workbook. Compute the control limits for a c-chart using the
appropriate formulas. Then use the c-chart Excel template to verify your calculations and
construct the chart. Interpret the results.
See Excel file Problem 8.47 in the instructor materials.
Number defective = 178; number of samples = 30
14
16
18
Number of nonconformances
Sample number
Prob. 8-46
Attribute (c) Chart
Number of defects
Lower control limit
Upper control limit
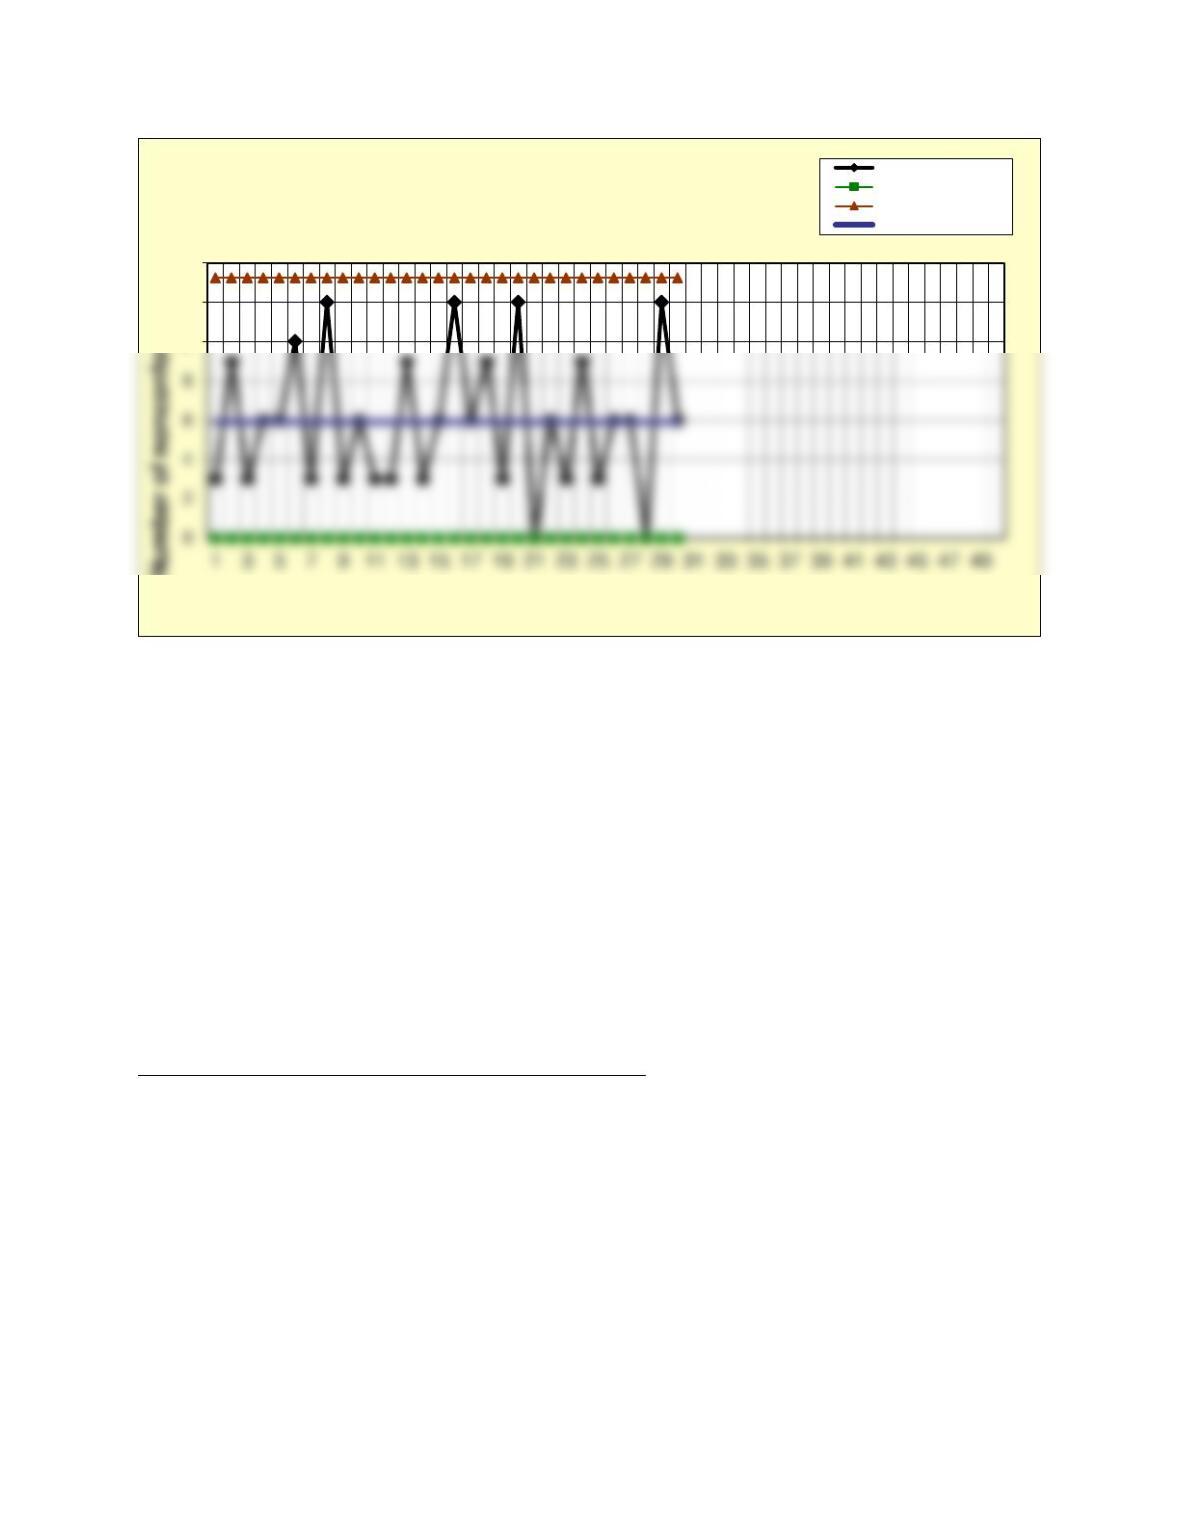
Although the process is in statistical control, an average number of errors of 6 with values up to 12
for pharmaceuticals is clearly unacceptable. Efforts must be made to understand the source of
errors and reduce them significantly, with zero defects being the goal.
48. A quality consultant was asked to analyze the data from order errors at the Audubon
Books, Inc., distribution center as shown in the C08 Problem Data workbook. Any order
can have one or more errors such as wrong item, incorrect customer information, etc. The
company assigns penalties based on the severity of the errors. A minor error, such as a
wrong zip code, is rated as 1; a moderate error, such as a wrong address, is rated as 3; and
a critical error, such as missing items or delivery to the wrong customer, is rated as 5. The
data show the total number of penalties for the number of orders shipped. Use the u-chart
Excel template to find control limits and a u-chart for these data. What does the u-chart
measure in the context of this application? Interpret the results.
See Excel file Problem 8.48 in the instructor materials.
10
12
14
Number of nonconformances
Sample number
Prob. 8-47
Attribute (c) Chart
Number of defects
Lower control limit
Upper control limit
Center line
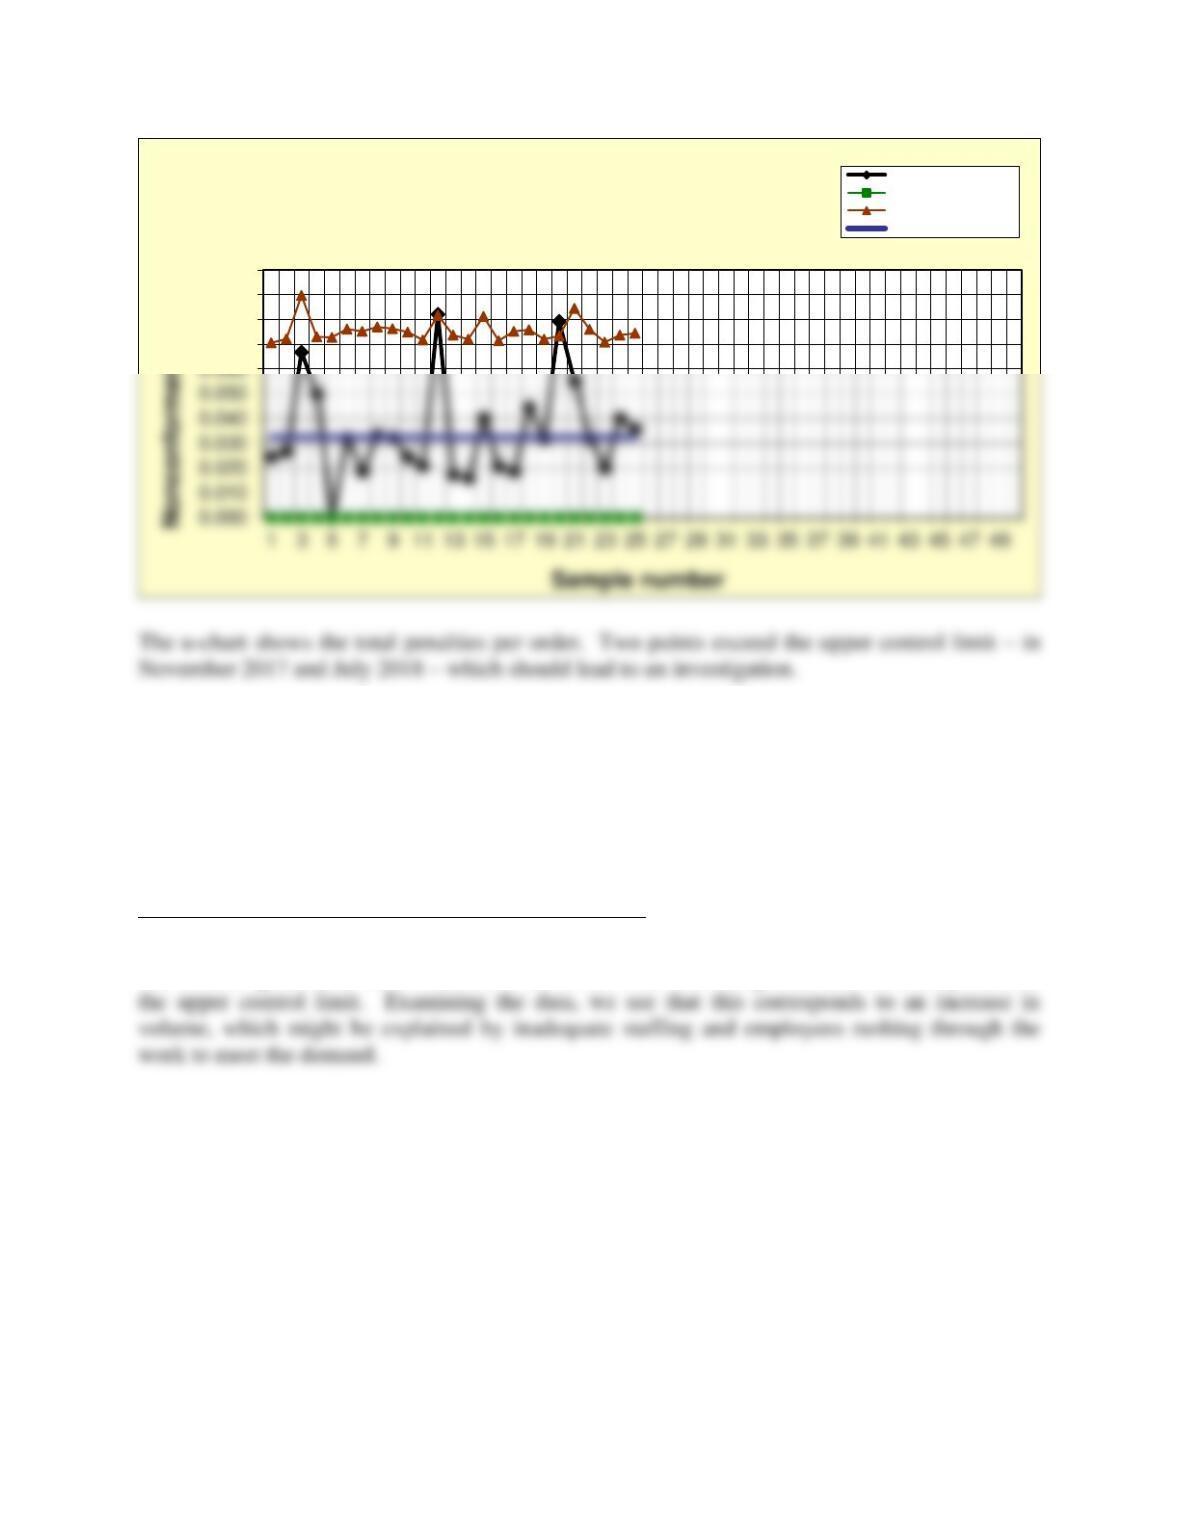
49. Top Billers processes bills for customers. Bills can contain errors due to a number of
causes, such as incorrect amounts, wrong dates, wrong customer information, etc. The
quality manager for Top Billers decided to examine all bills processed over 25 weeks to
examine the number of errors per bill. The data are provided in the C08 Problem Data
workbook. Use the u-chart Excel template to construct a u-chart for these data. Interpret
the results.
See Excel file Problem 8.49 in the instructor materials.
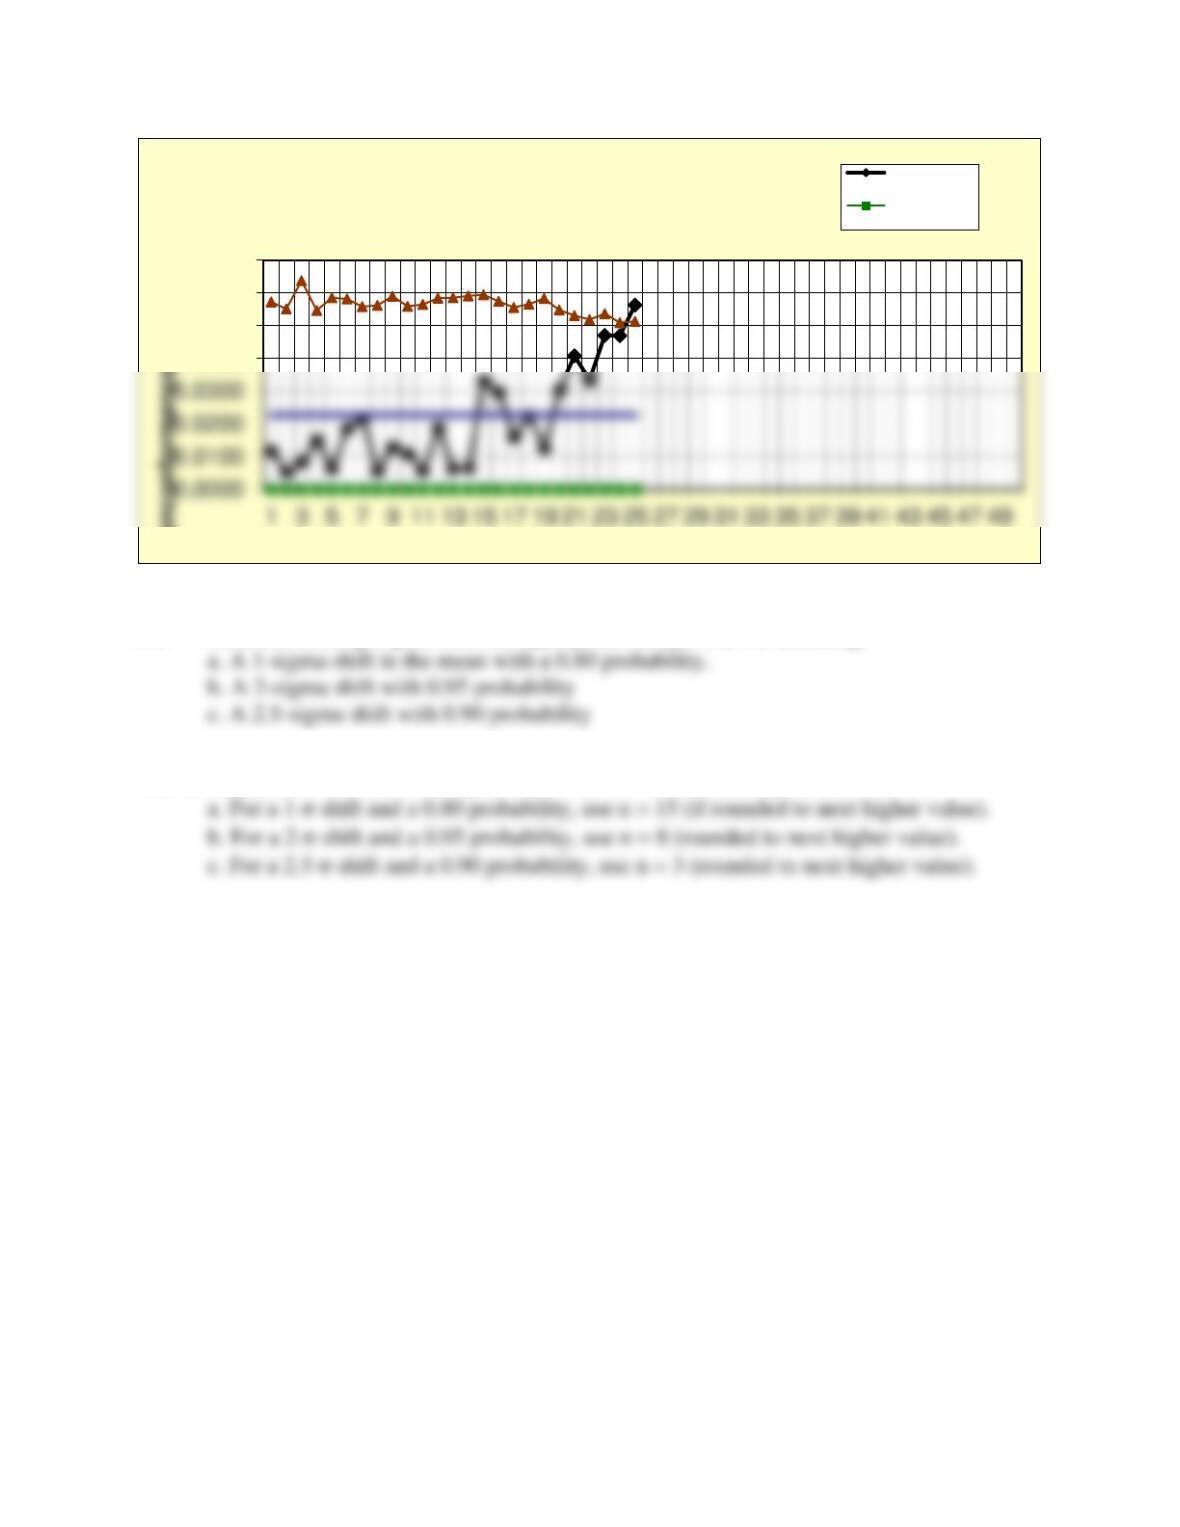
The chart is quite stable until week 20, when it shows an increasing trend and eventually exceeds
0.070
0.080
0.090
0.100
Prob. 8-48
Attribute (u) Chart
Defects per unit
Lower control limit
Upper control limit
Center line
50. Determine, using Figure 8.50 the appropriate sample size for detecting:
This is simply an exercise in reading values from the curves to fit required conditions.
0.0400
0.0500
0.0600
0.0700
Nonconformances per unit
Sample number
Problem 8-49
Attribute (u) Chart
Defects per
unit
Lower control
limit