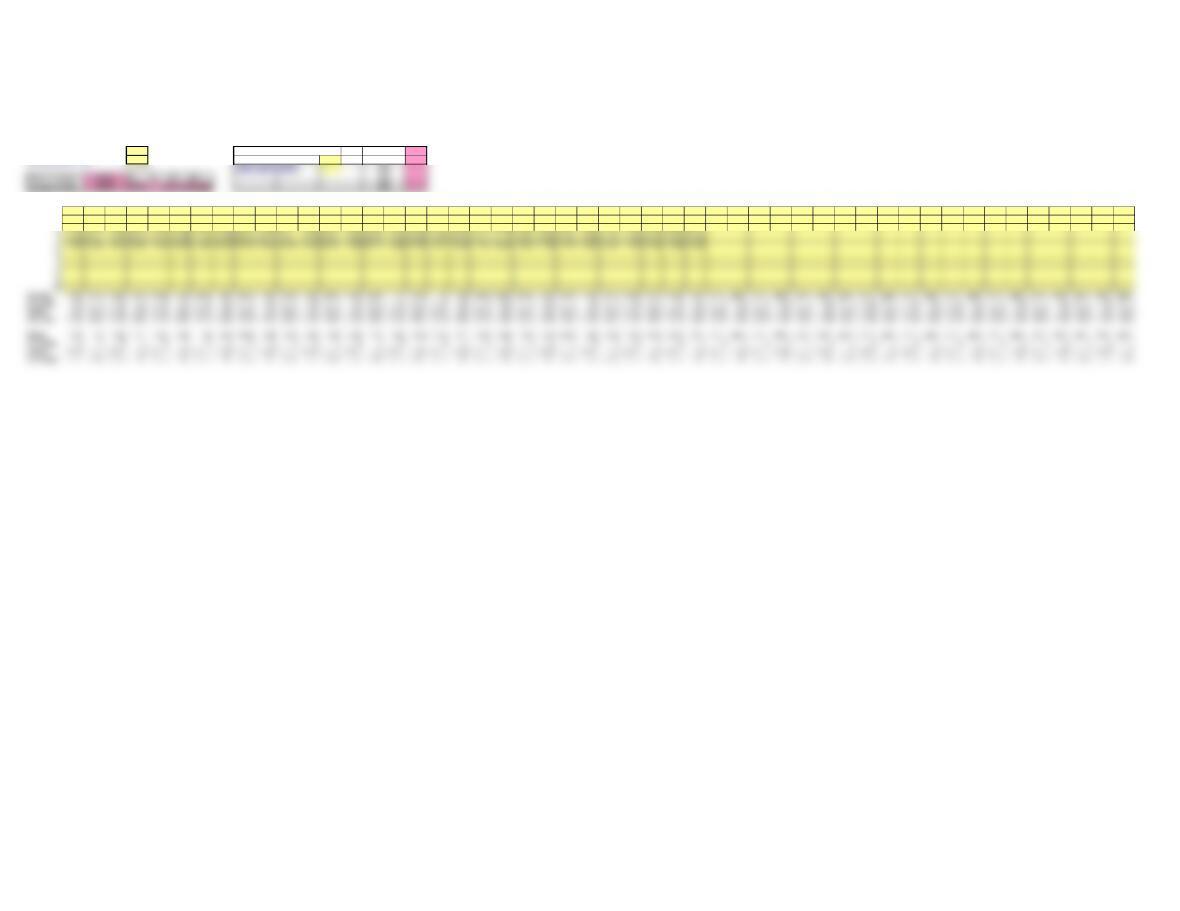
Morelia Mortgage Co. – Original data
This spreadsheet is designed for up to 50 samples, each of a constant sample size from 2 to 10. Enter data ONLY in yellow-shaded cells.
Enter the number of samples in cell E6 and the sample size in cell E7. Then enter your data in the grid below.
Click on sheet tabs for a display of the control charts. Specification limits may be entered in cells N7 and N8 for process capability.
Number of samples (<= 50) 30 Process Capability Calculations Six sigma 21.73
5Upper specification
DATA 1 2 3 4 5 6 7 8 9 10 11 12 13 14 15 16 17 18 19 20 21 22 23 24 25 26 27 28 29 30 31 32 33 34 35 36 37 38 39 40 41 42 43 44 45 46 47 48 49 50
117.81 11.91 16.15 17.37 11.18 13.01 14.02 15.74 20.40 16.60 12.41 13.88 12.90 17.68 21.29 17.64 20.90 17.43 23.59 15.58 25.87 19.17 17.26 14.27 13.55 15.35 13.82 17.19 14.01 12.32
219.93 15.86 13.53 9.42 18.04 11.87 14.51 18.08 22.21 12.29 19.76 16.76 11.94 12.39 13.86 22.39 14.04 16.91 14.26 13.54 23.13 16.20 15.56 13.83 18.32 6.81 10.71 16.96 24.70 15.52
319.12 19.00 12.87 14.74 14.96 15.55 15.50 13.73 16.94 17.88 19.91 15.53 16.27 14.13 16.56 14.10 17.05 14.51 14.47 11.25 19.46 13.45 13.62 23.52 18.64 9.95 13.12 22.56 18.58 16.11
415.39 16.51 14.37 20.53 19.42 13.09 14.14 21.82 29.32 19.17 13.31 14.49 13.41 14.00 20.93 15.08 19.26 6.04 19.10 13.71 31.11 18.18 10.83 10.23 12.83 14.09 15.33 11.53 19.12 17.93
X-bar and R-Chart
Sample size (2 – 10)
Cp
Grand Average A2 D3 D4 d2
20
22
24
26
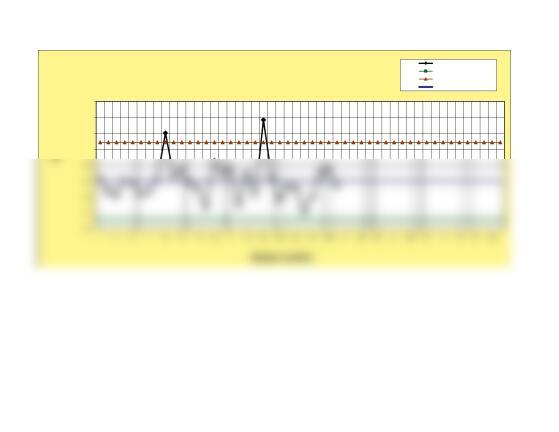
MMC– X-bar Chart
Averages
Lower control limit
Upper control limit
Center line
14
16
18
20
Sample number
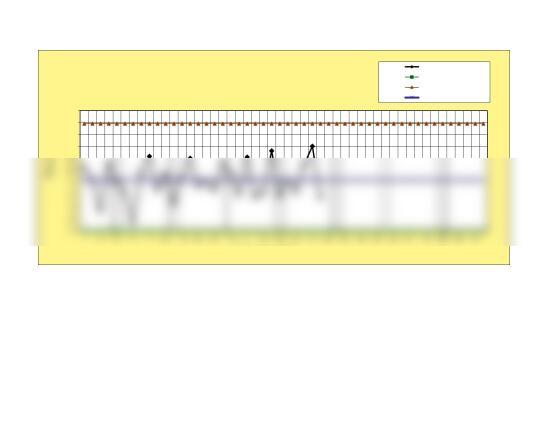
MMC– R-Chart
Ranges
Lower control limit
Upper control limit
Center line