Process
Capability
Calculations
Six
sigma
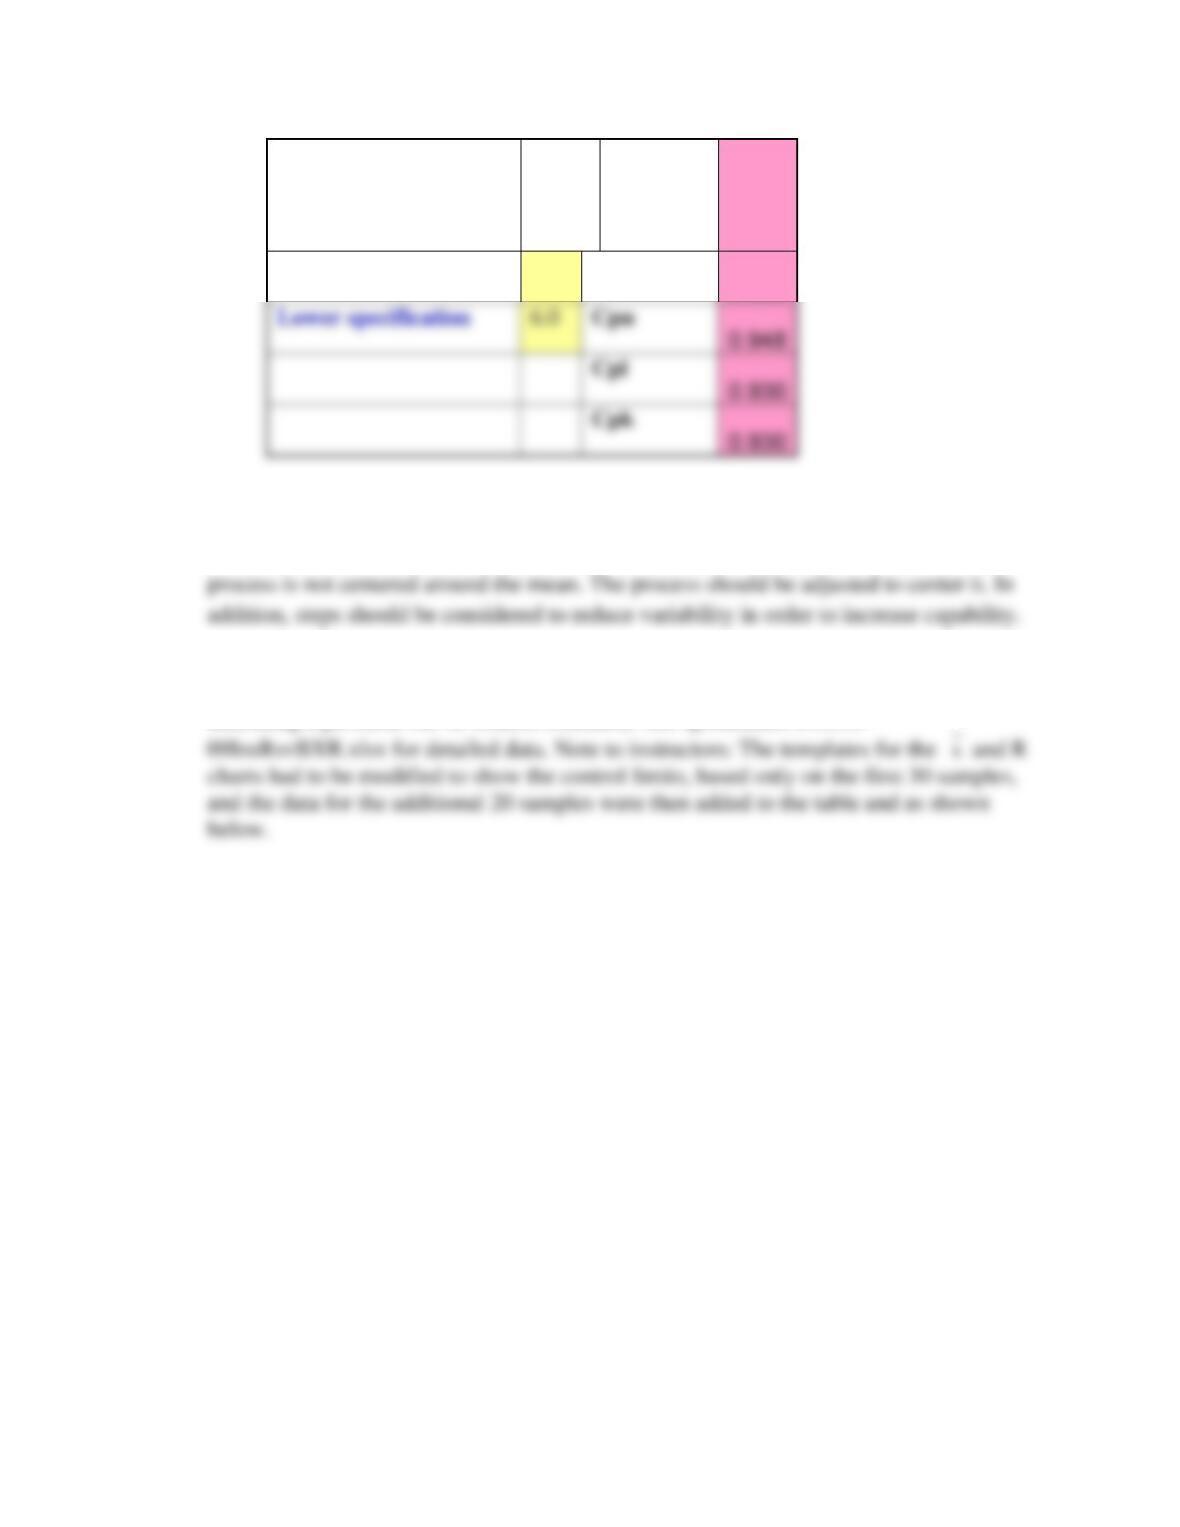
6.815
Upper specification
12.4
Cp
0.939
Capability indexes are Cpu = 0.948, Cpl = 0.930, Cpk = 0.930 and Cp = 0.939. All the
indexes are unsatisfactory, since they fall below 1. The Cpu = 0.948, indicates that the
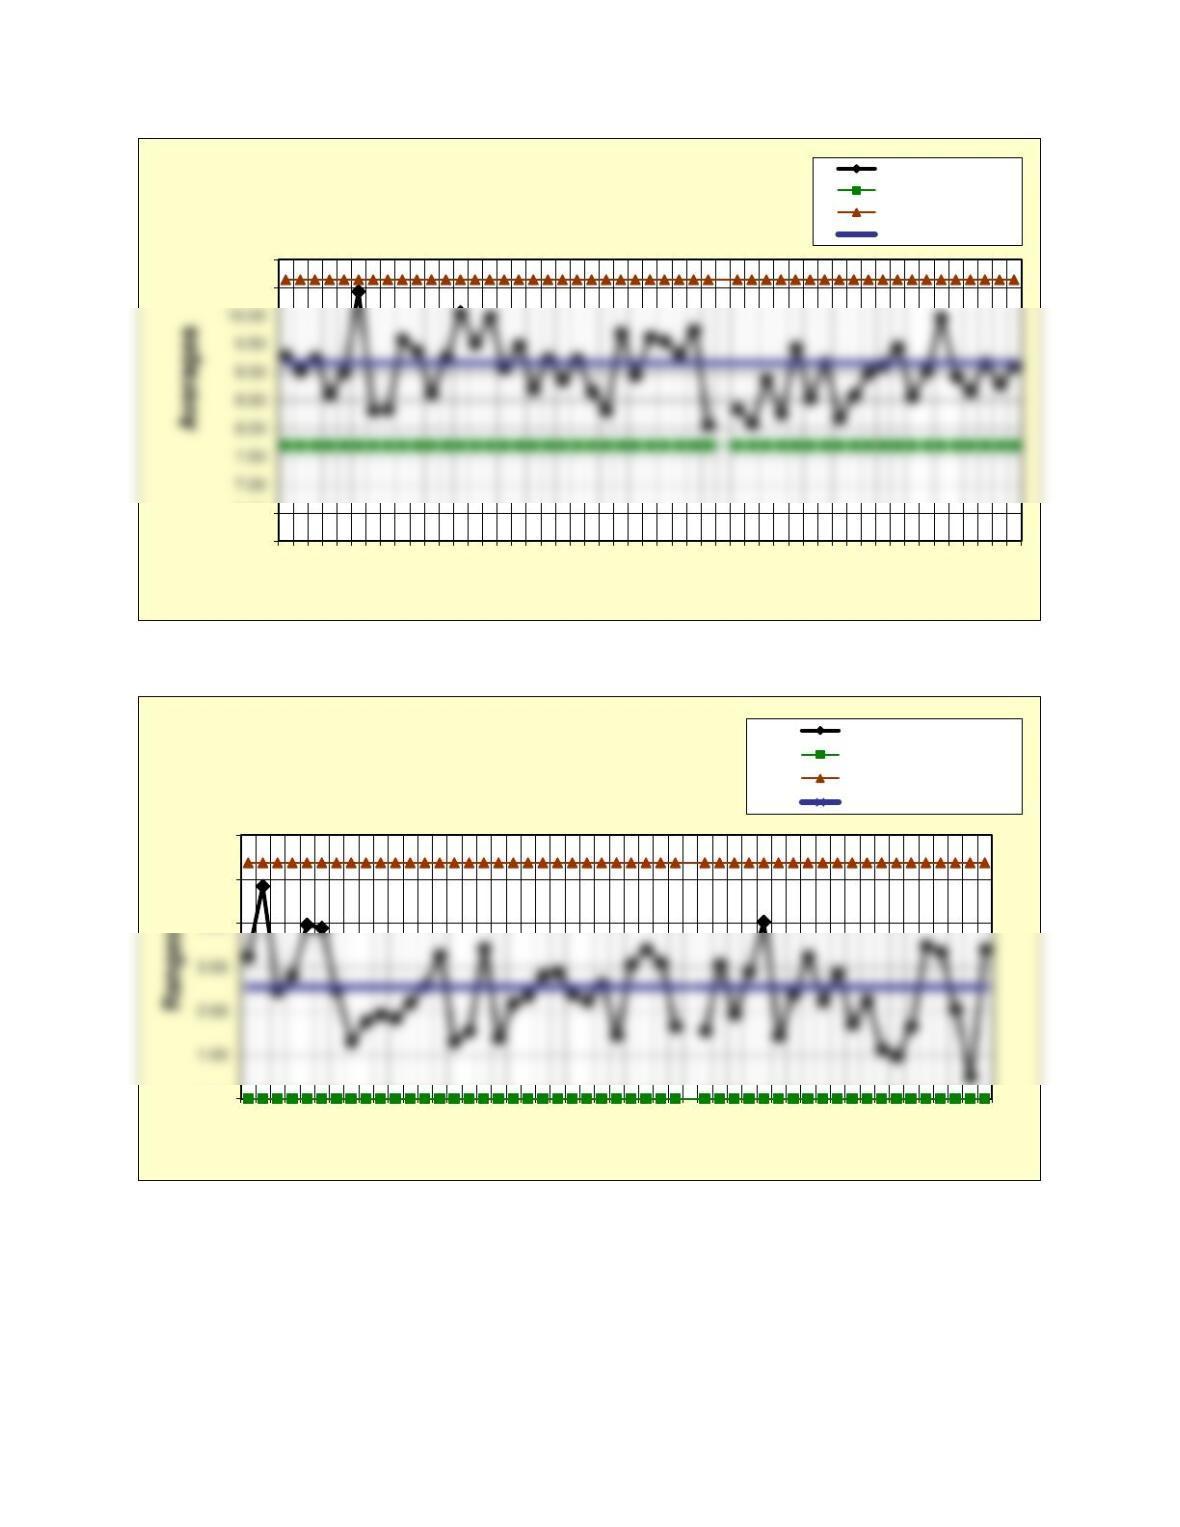
d) Using the previously calculated control limits to monitor the last 20 samples, there is
one unusual occurrence, with seven out of the last eight samples below the centerline,
indicating a probable out-of-control condition. See spreadsheet Prob08-
Lower specification
6.0
Cpu
0.948
Cpl
0.930
Cpk
0.930
10. Construct x– and s-charts for the data for Babbage Chips from Prob. 8-09. Is the process
in control? What recommendation would you make to management concerning the
process, based on your analysis?
6.00
6.50
10.50
11.00
1 3 5 7 9 11 13 15 17 19 21 23 25 27 29 31 33 35 37 39 41 43 45 47 49 51
Sample number
Prob. 8-09B X-bar Chart
Averages
Lower control limit
Upper control limit
Center line
0.00
4.00
5.00
6.00
1357911 13 15 17 19 21 23 25 27 29 31 33 35 37 39 41 43 45 47 49 51
Sample number
Prob. 8-09B R-Chart
Ranges
Lower control limit
Upper control limit
Center line
Answer
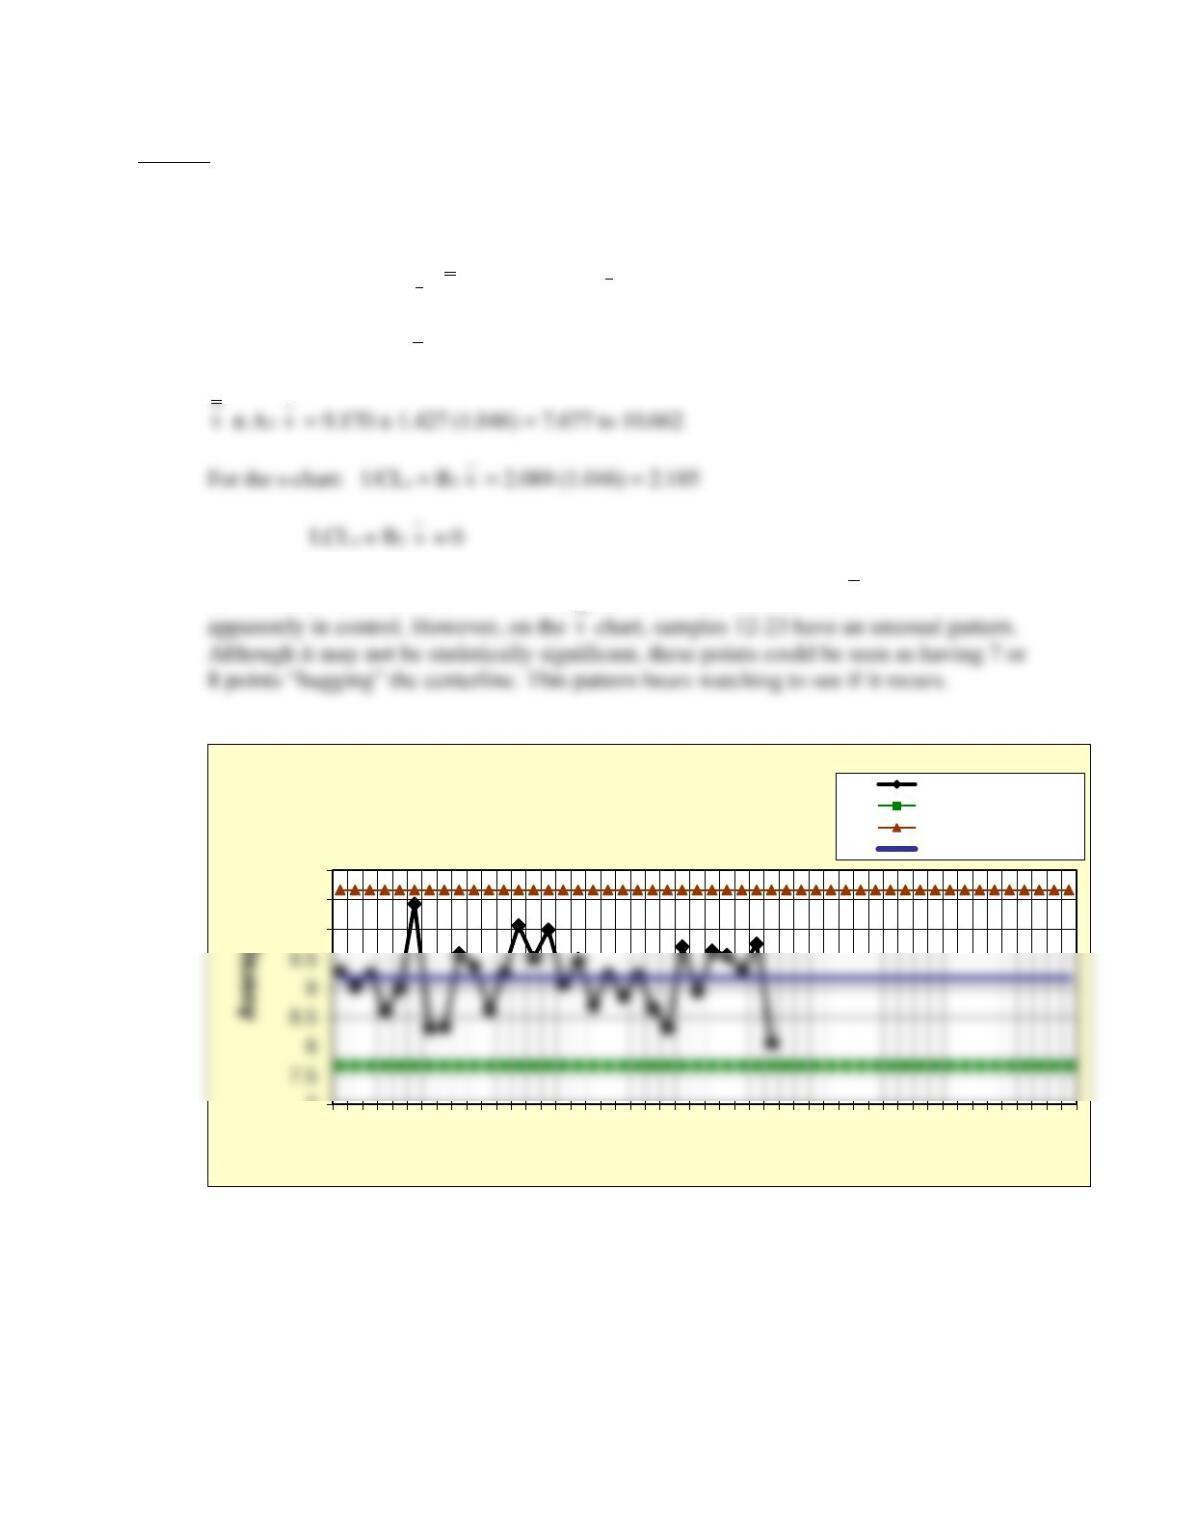
See data and control charts below and spreadsheet Prob08-10XS.xlsx for details. Using the
data from Babbage Chips, Prob08-09, we see:
For the center line, CL
x
:
x
= 9.170; CLs :
s
= 1.046
Control limits for the
x
– s charts are:
As in Prob. 08-09A, results from 30 samples of 5 show that both the
x
and s charts are
7
10
10.5
11
1 3 5 7 9 11 13 15 17 19 21 23 25 27 29 31 33 35 37 39 41 43 45 47 49
Sample number
Prob. 8-10 X-bar Chart
Averages
Lower control limit
Upper control limit
Center line
x
s
s
11. Ricardo’s Widgets makes a critical part for a popular brand of cell phones. Consider the
data for 15 samples of size 4 of a key dimension for the part, shown in the worksheet
C08DataInsRsv.xlsx. Specifications are 0.110 ± 0.02.
a. Construct the
x
– and R charts and an x-MR chart for “individuals” using the data.
Interpret the results. Use a four period moving range for the x-MR chart.
b. Estimate the process capability by using the actual sample standard deviation.
Answer
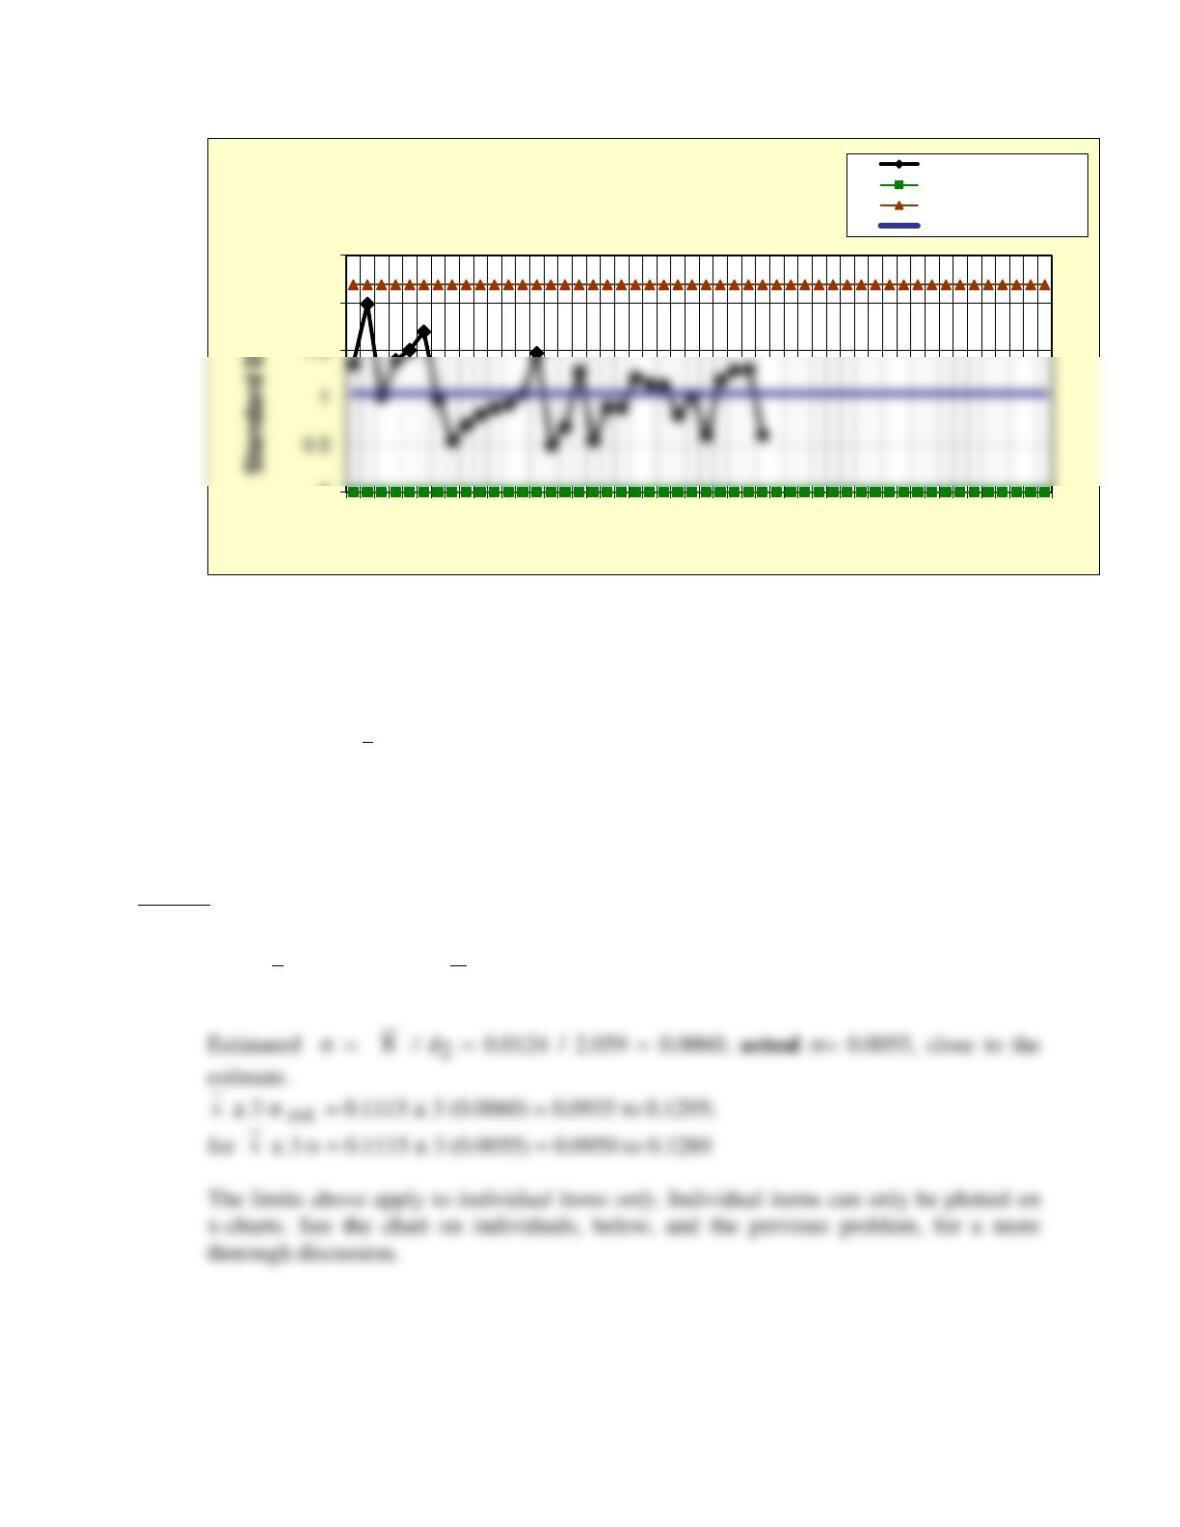
a) See spreadsheet Prob08-11InsRsvXMR.xls (X and MR chart template) for details.
CLx :
x
= 0.1115; CLR :
R
= 0.0124 (with a 4-period moving average)
0
2
2.5
1 3 5 7 9 11 13 15 17 19 21 23 25 27 29 31 33 35 37 39 41 43 45 47 49
Sample number
Prob. 8-10 s-Chart
Standard Deviations
Lower control limit
Upper control limit
Center line
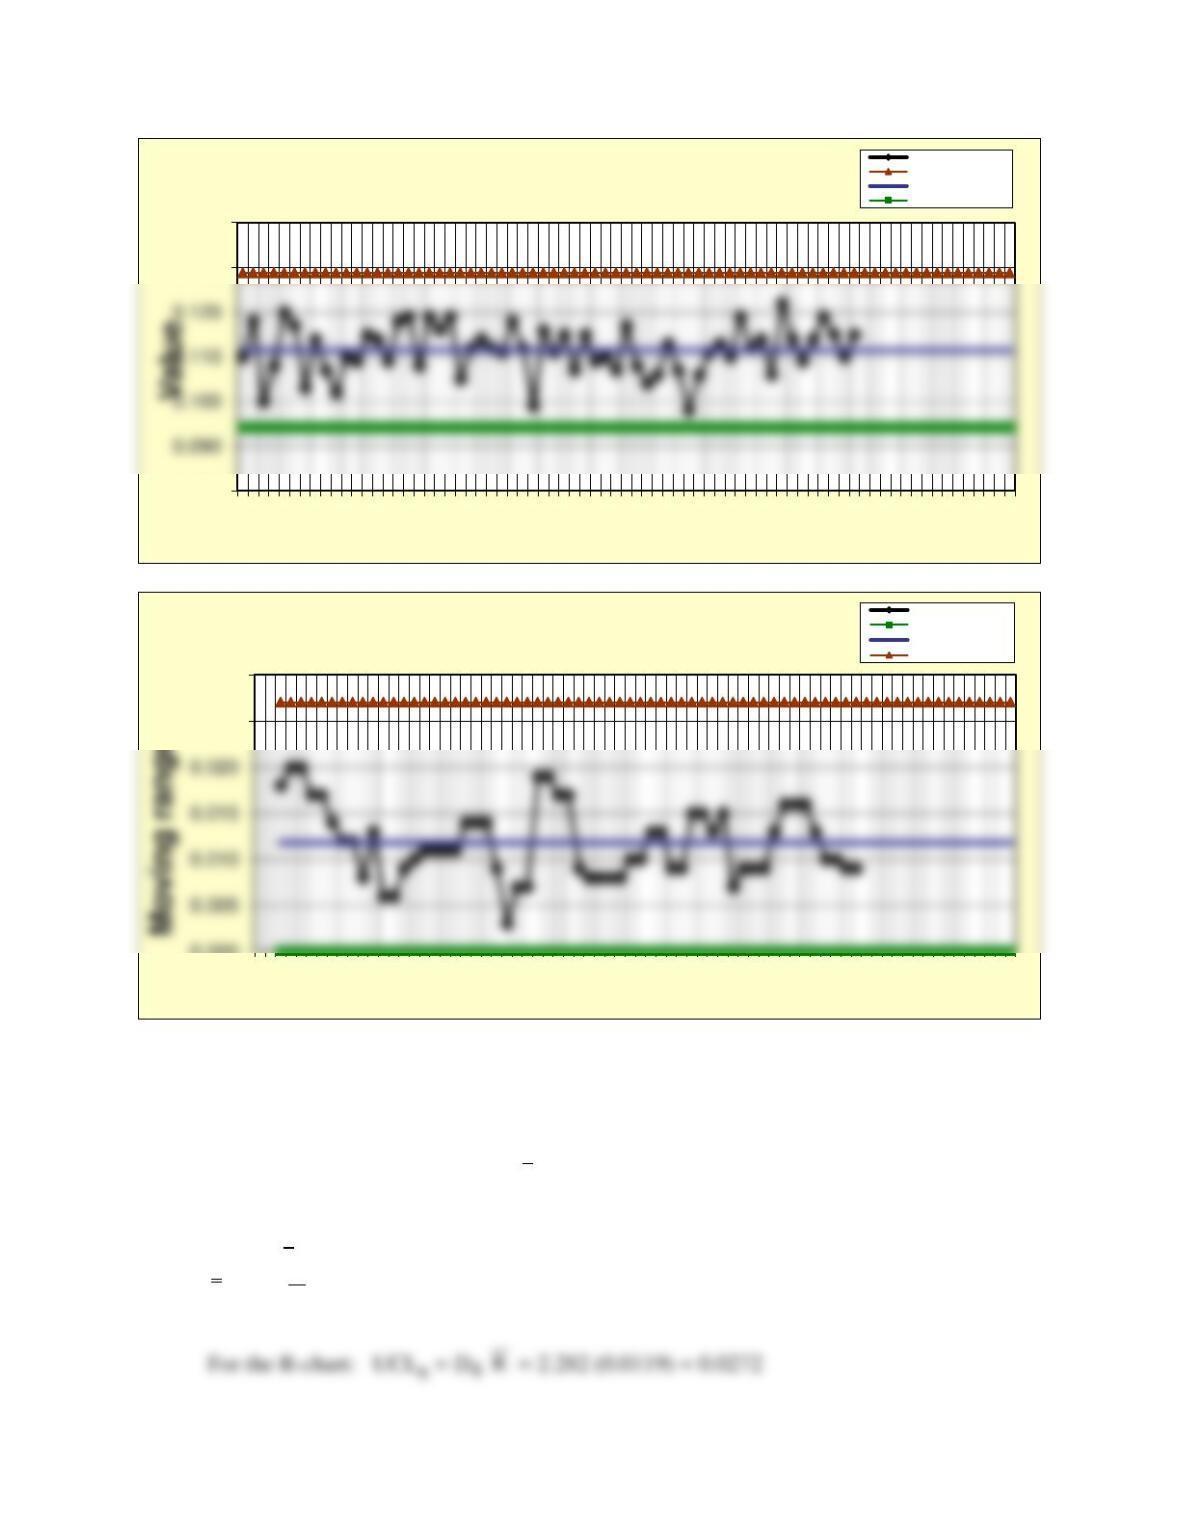
b) The detailed comparisons of process capability using estimated are shown in a table on
the spreadsheets Prob08-11InsRsvXbarR.xlsx.
Although individual values must be plotted on x-charts, as shown above, students need to
understand their relationship to
x
– chart and R-chart results for comparison with the
charts for individuals.
For the
x
– chart:
x
± A2
R
= 0.1115 ± 0. 0.729 (0.0119) = 0.1028 to 0.1202
0.080
0.130
0.140
1 4 7 10 13 16 19 22 25 28 31 34 37 40 43 46 49 52 55 58 61 64 67 70 73
Observation number
Problem 8-11 Individuals (X) Chart
Individuals
Upper control limit
Center line
Lower control limit
0.000
0.025
0.030
14710 13 16 19 22 25 28 31 34 37 40 43 46 49 52 55 58 61 64 67 70 73
Observation number
Problem 8-11 Moving Range Chart
Moving ranges
Lower control limit
Center line
Upper control limit
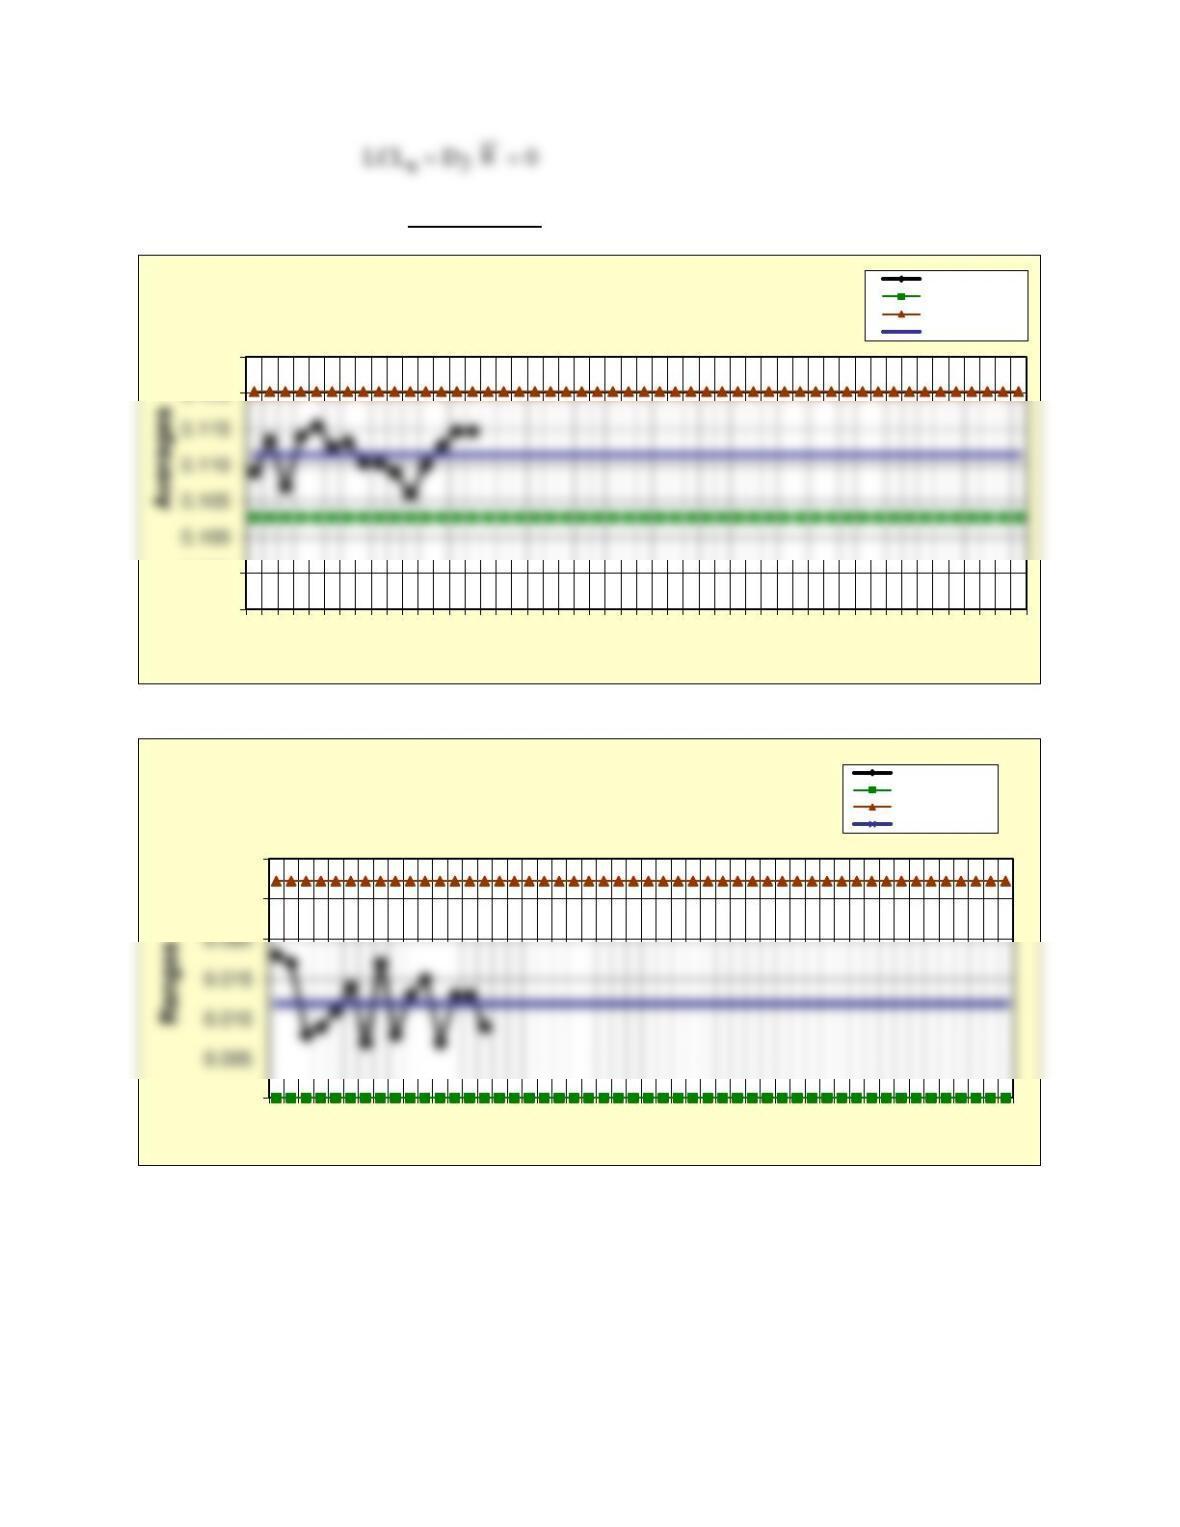
These limits apply to sample groups of 4 items each.
0.090
0.095
0.120
0.125
1 3 5 7 9 11 13 15 17 19 21 23 25 27 29 31 33 35 37 39 41 43 45 47 49
Sample number
Problem 8-11 X-bar Chart
Averages
Lower control limit
Upper control limit
Center line
0.000
0.025
0.030
1 3 5 7 9 11 13 15 17 19 21 23 25 27 29 31 33 35 37 39 41 43 45 47 49
Sample number
Problem 8-11 R-Chart
Ranges
Lower control limit
Upper control limit
Center line
c) The calculations of process capability using the estimated value is shown on the
following table. (See spreadsheet Prob08-11InsRsvXbarR.xlsx for details.)
Nominal specification
0.110
Average
0.1115
Cp
1.115
Upper tolerance limit
0.130
Standard deviation
0.0119
Cpu
1.064
Lower tolerance limit
0.090
Cpl
1.237
Cpk
1.064
12. Thirty-five samples of 25 packages each at the Bakery Bread, Inc. were inspected, and 25
items were found to be defective. Compute control limits for a p-chart.
Answer
Control limits for Bakery Bread, Inc. orders can be calculated using:
Control limits:
UCLp =
p
+ 3 s
p
UCLp = 0.029 + 3(0.034) = 0.131
LCLp =
p
– 3 s
p
LCLp = 0.029 – 3(0.034) = – 0.073, use 0
13. The fraction defective of automotive pistons made by the Precision Piston Co. is given in
the worksheet the worksheet C08DataInsRsv.xlsx for Prob. 8-13 for 20 samples. One
hundred units are inspected each day. Construct a p-chart and interpret the results.
Answer
See data and control charts for Precision Piston Company, below. See spreadsheets
Prob08-13InsRsvP.xlsx, for details.
p
p
p
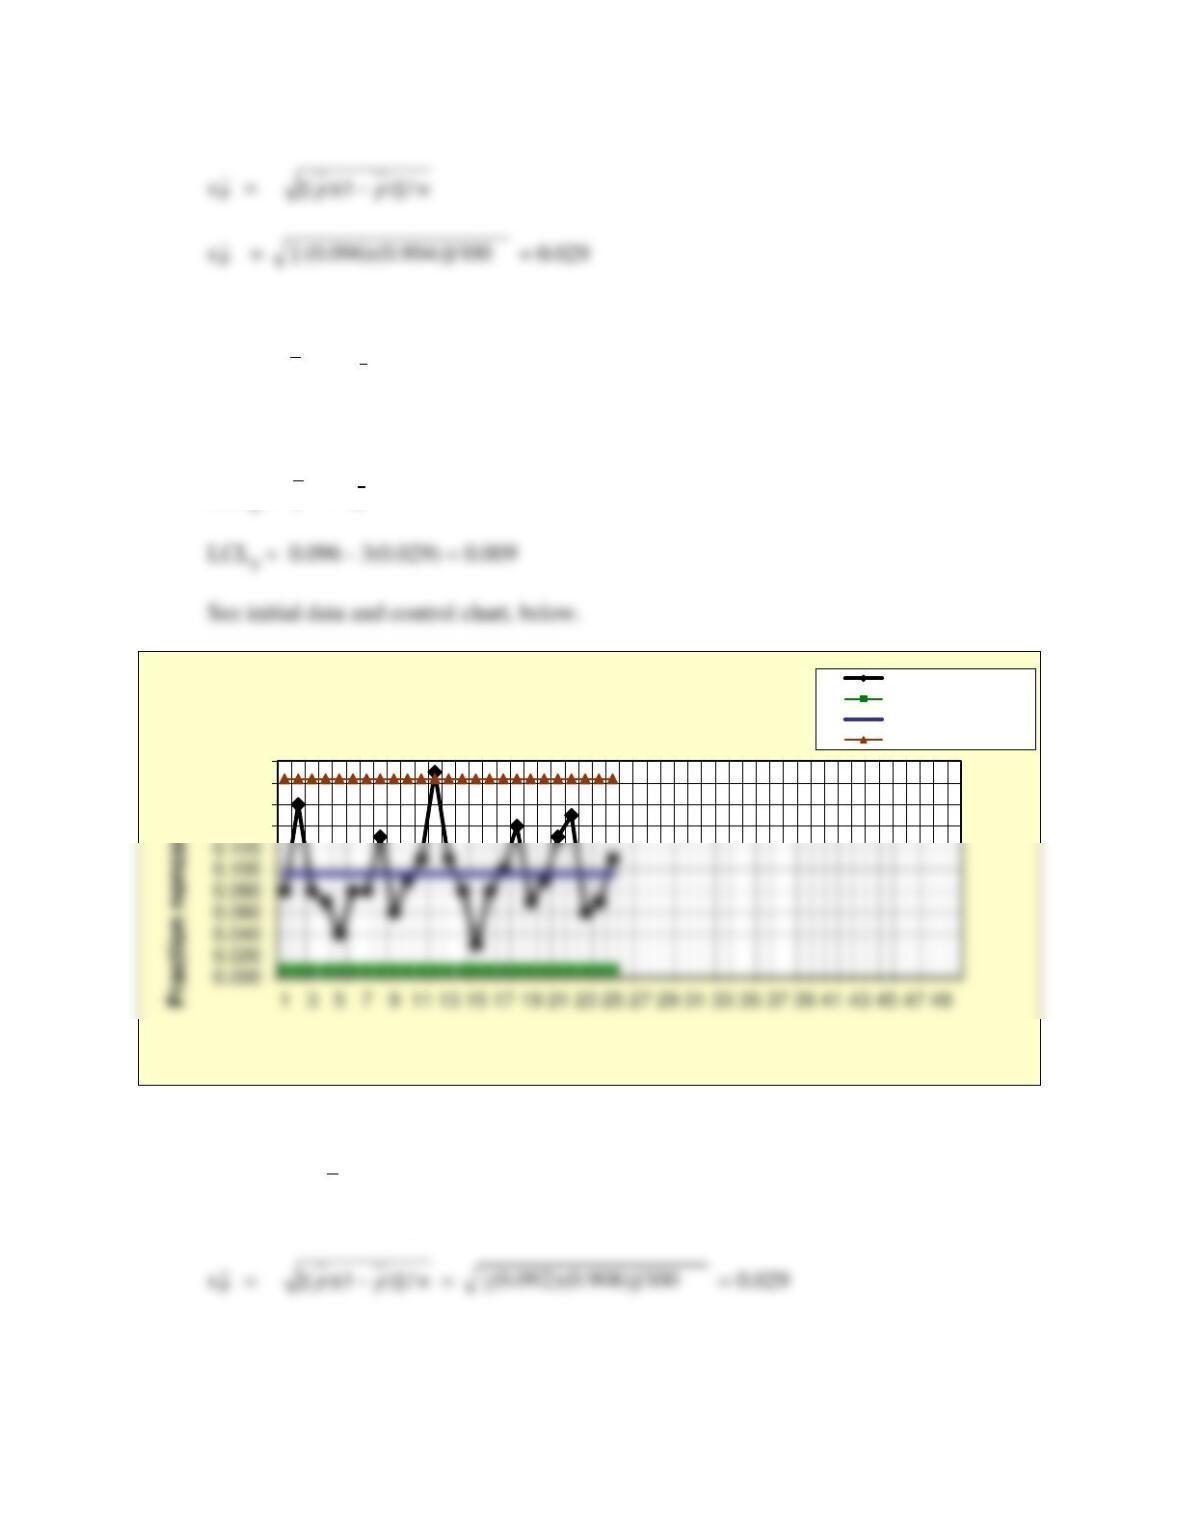
Control limits:
UCLp =
p
+ 3 s
p
UCLp = 0.096 + 3(0.029) = 0.183
LCLp =
p
– 3 s
p
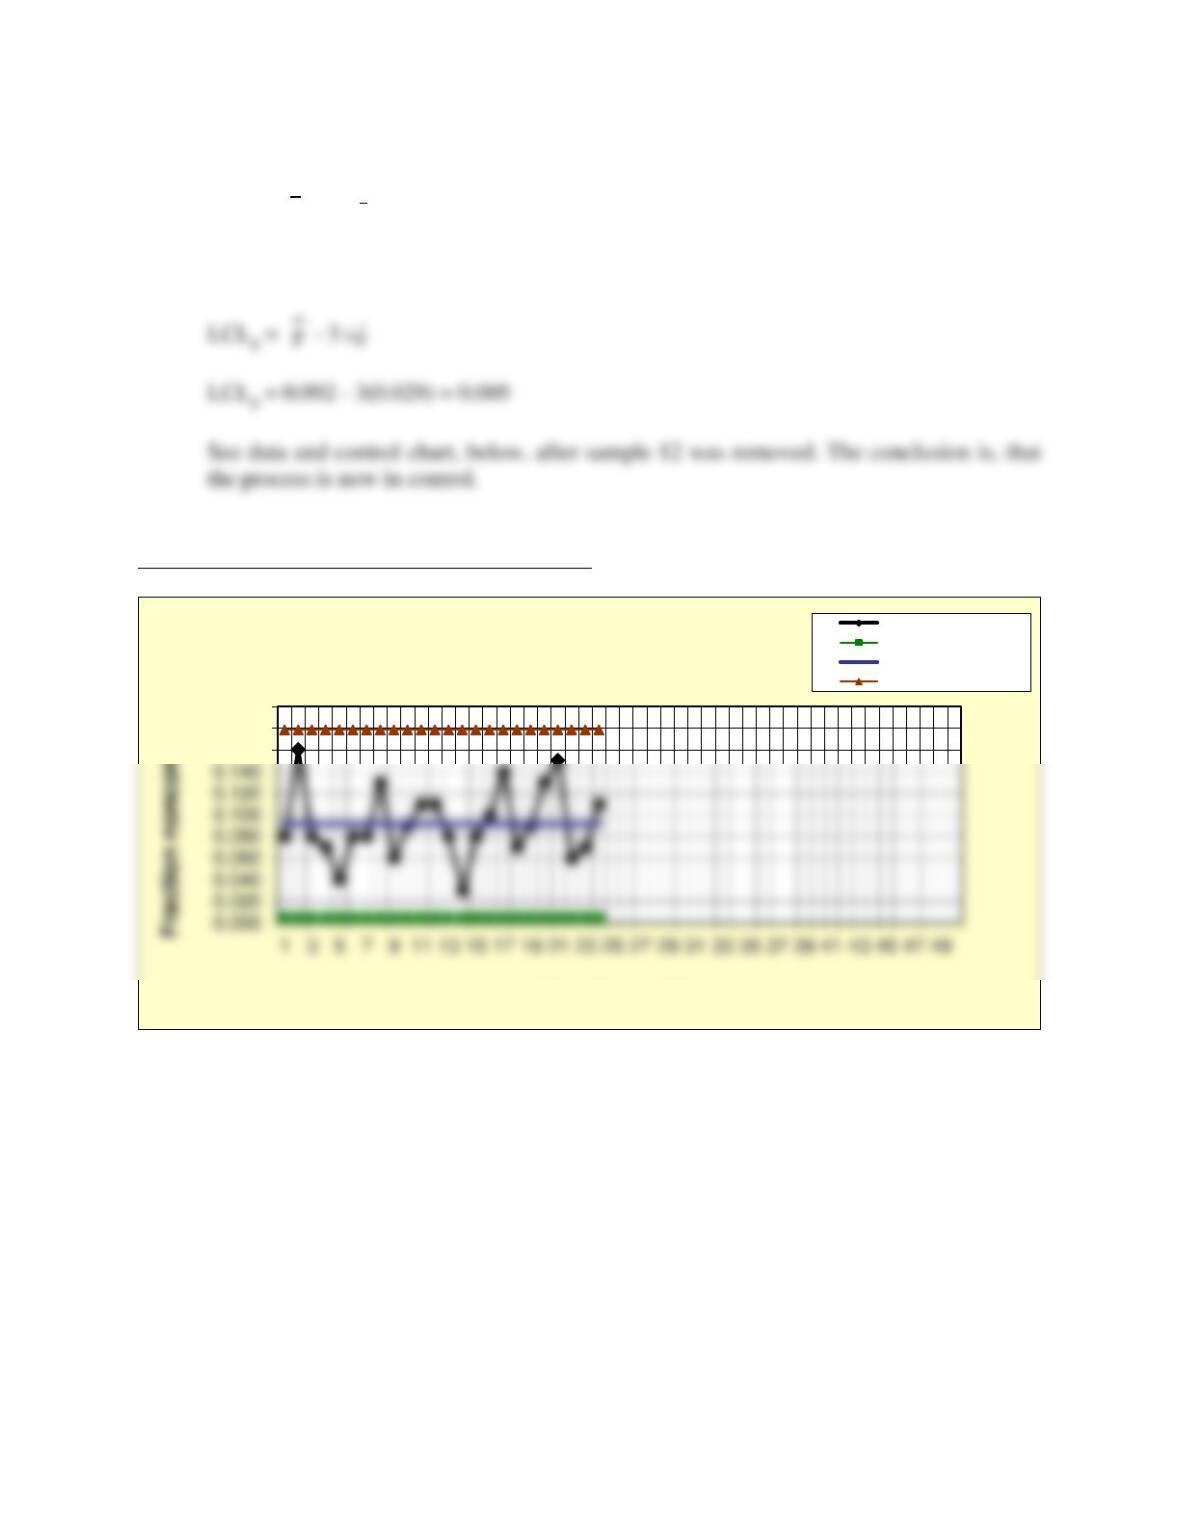
b. Precision Piston Company (Continued)
Revised CL
p
= 0.092 (after sample 12, with a fraction defective
of 0.19, was removed).
p
0.140
0.160
0.180
0.200
Sample number
Problem 8-13A Attribute (p) Chart
Fraction nonconforming
Lower control limit
Center line
Upper control limit
p
p
Control limits:
UCLp =
p
+ 3 s
p
UCLp = 0.092 + 3(0.029) = 0.179
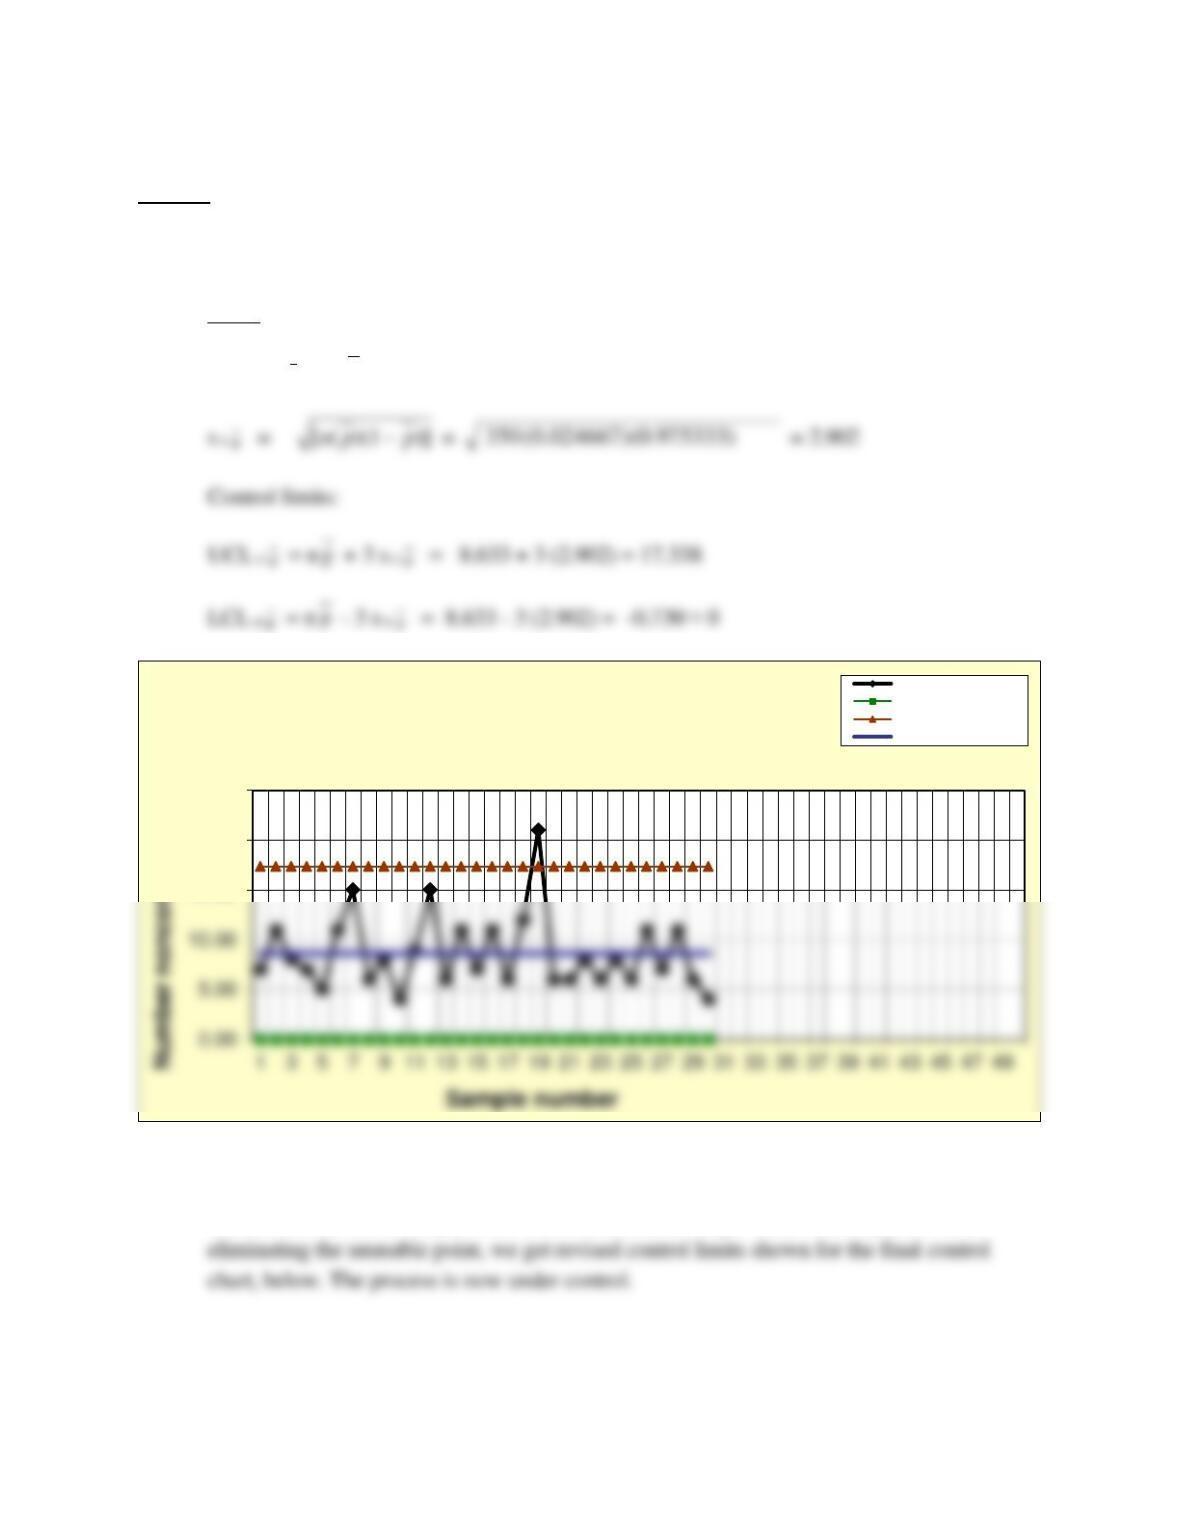
Prob8-13InsRsvP-B Final Revised Control Chart
14. Ellswater Hospital surveys all outgoing patients by means of a patient satisfaction
questionnaire. A random sample of 350 surveys is taken each month. Control charts that
monitor the proportion of unsatisfied patients for key questions are constructed and
studied. Construct an np-chart for the data in the C08DataInsRsv.xlsx for Prob. 8-14,
which represent responses to a question on satisfaction with hospital housekeeping
services.
0.160
0.180
0.200
Sample number
Problem 8-13B Attribute (p) Chart
Fraction nonconforming
Lower control limit
Center line
Upper control limit
p
Answer
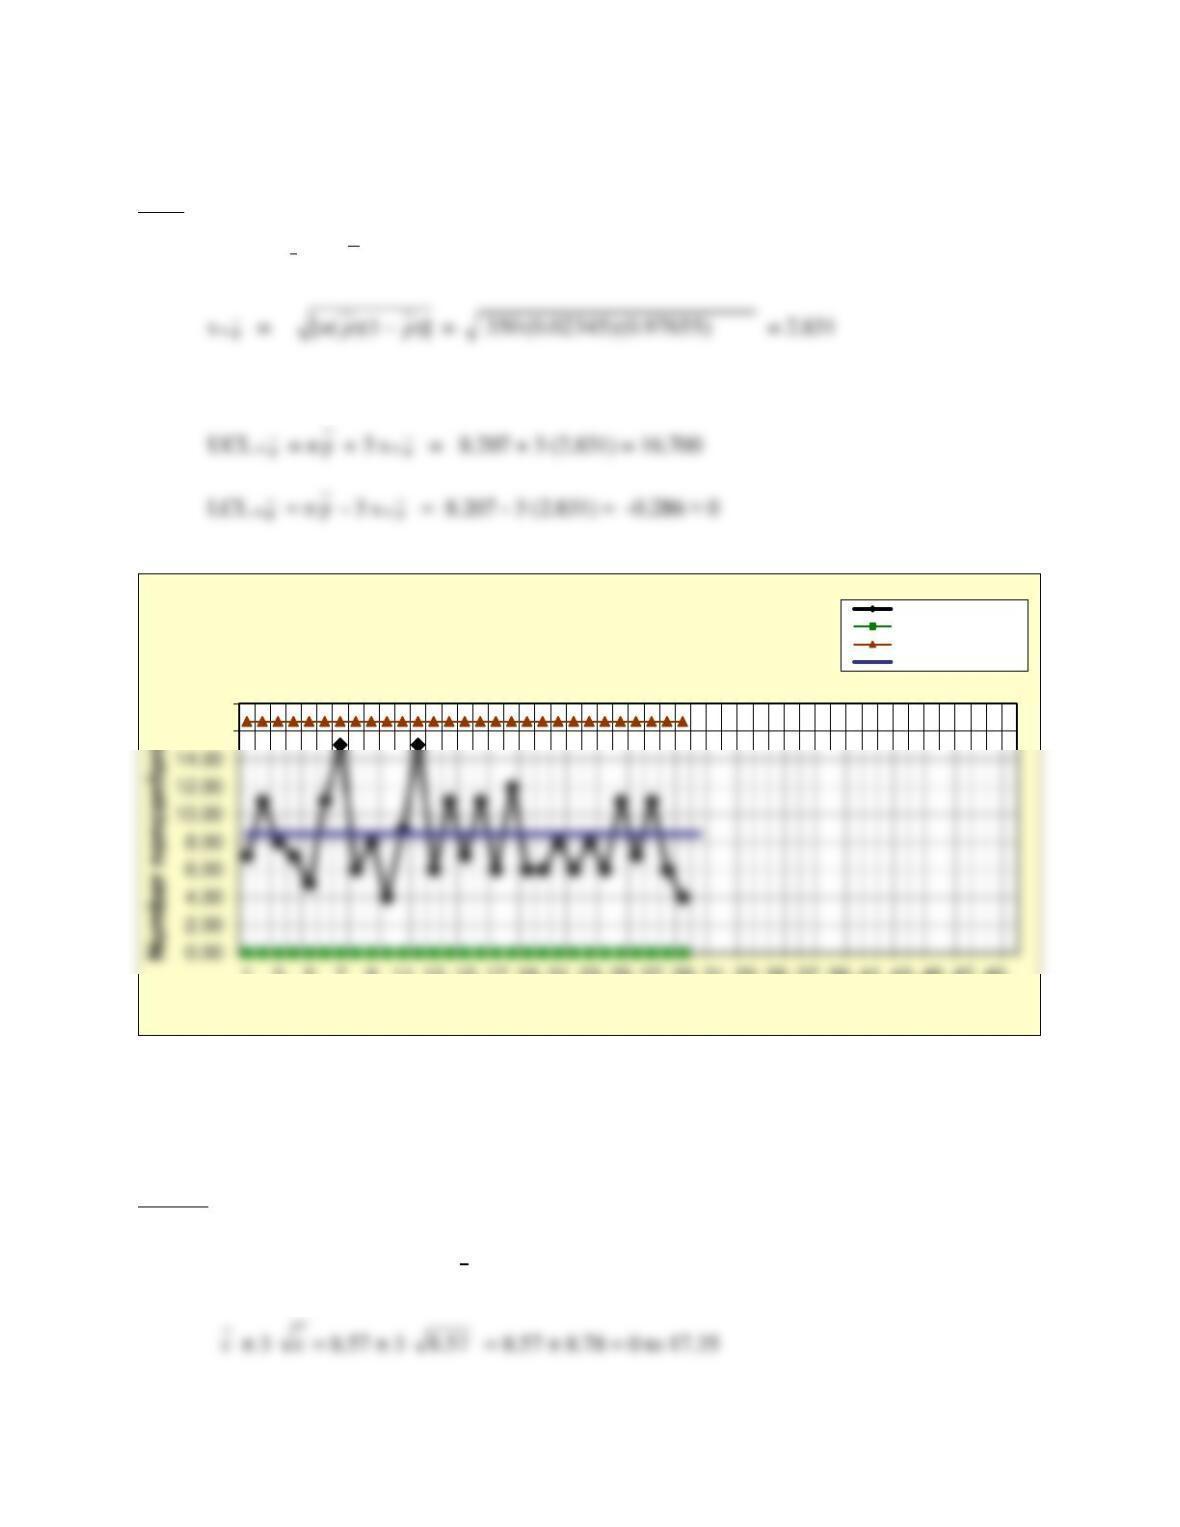
See spreadsheet Prob08-14InsRsvNP.xls for details Using data for problem 14, found in the
worksheet C08DataInsRsv.xlsx, we get results for the np chart shown below:
Initial
So, CL n
p
= n
p
= 350 (0.024667) = 8.633
As was shown in the previous control charts for problem, the value for sample 21 is out of
limits. Therefore this sample had to be eliminated, leaving 29 usable data points. After
15.00
20.00
25.00
Problem 8-14 A – Number nonconforming (np) chart
Number nonconforming
Lower control limit
Upper control limit
Center line
p
p
p
Final
So, CL n
p
= n
p
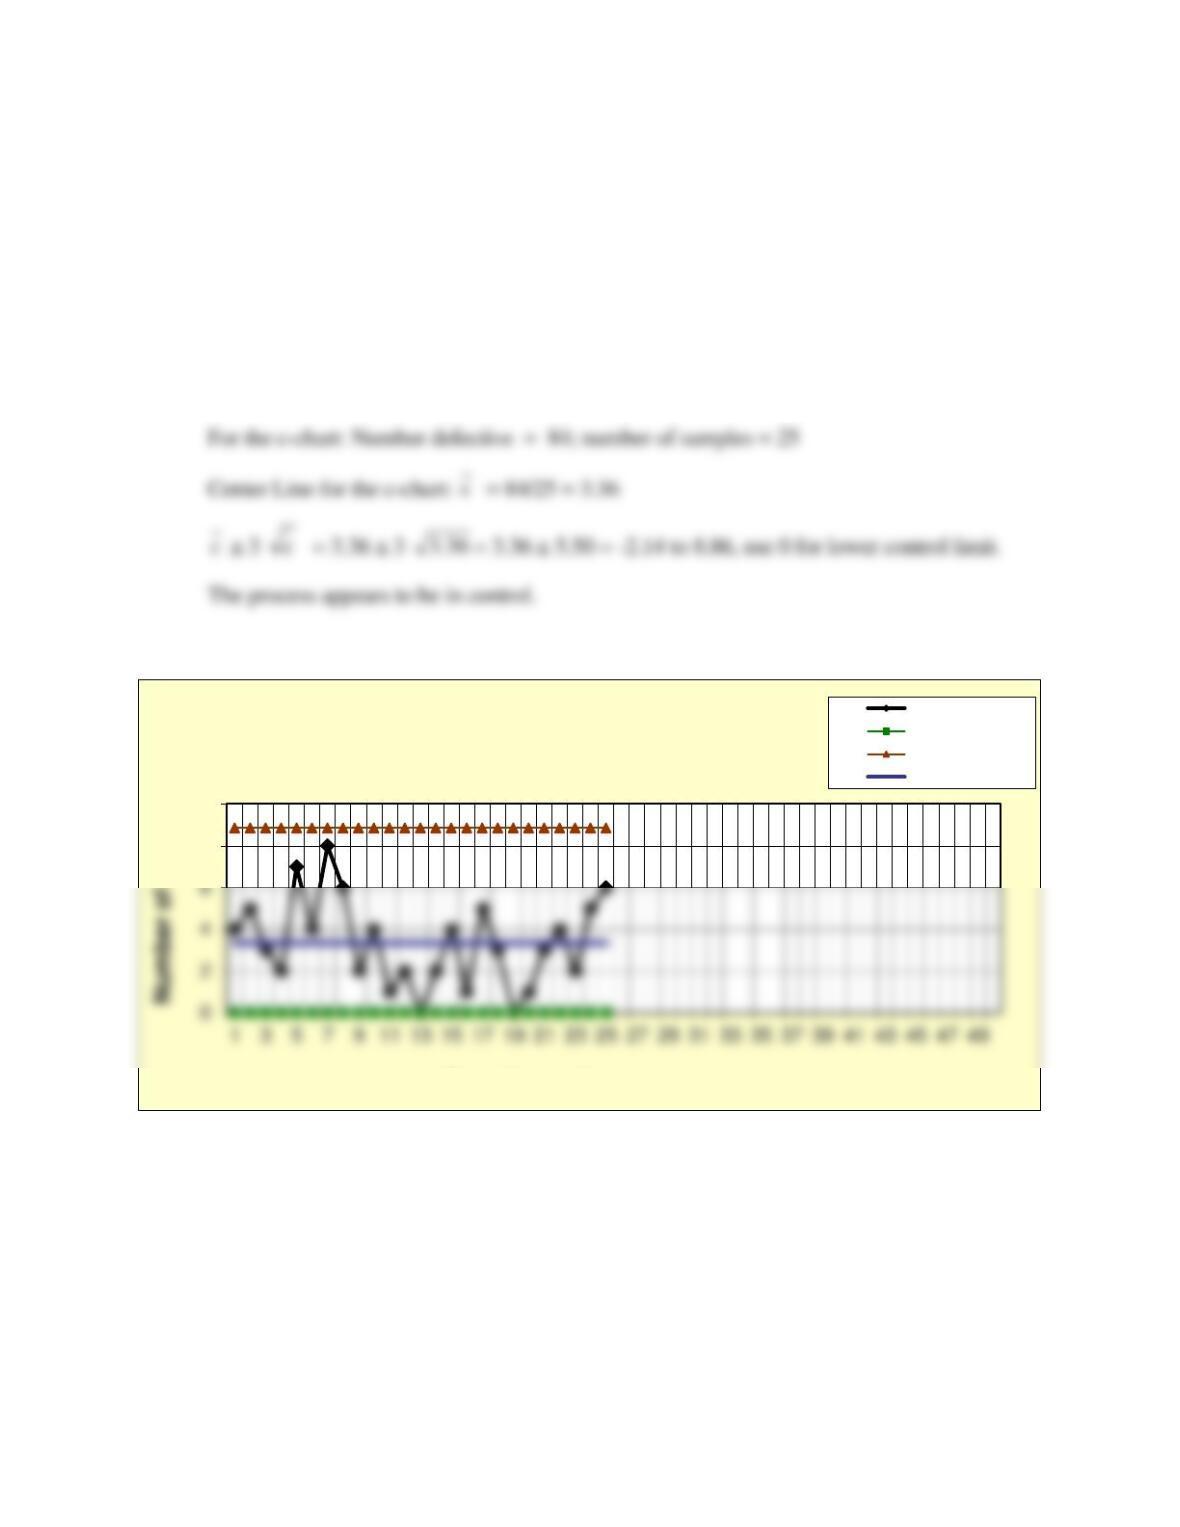
= 350 (0.02345) = 8.207
Control limits:
p
p
15. Calculate the centerline and control limits for a c-chart involving 35 samples and having
a total of 300 defects and interpret the results.
Answer
Center line for the c-chart:
c
= 300/35 = 8.57
16.00
18.00
1 3 5 7 9 11 13 15 17 19 21 23 25 27 29 31 33 35 37 39 41 43 45 47 49
Sample number
Problem 8-14 B – Number nonconforming (np) chart
Number nonconforming
Lower control limit
Upper control limit
Center line
p
16. Consider the sample data for defects per pizza in a new store being opened by Rob’s
Pizza Palaces in the worksheet C08DataInsRsv.xlsx for Prob. 8-16. Construct a c-chart
for these data. What does the chart show?
Answer
See spreadsheet Prob08-16InsRsvCC.xls for details.
17. Find 3 s control limits for a small u-chart with the following errors per sample unit. What
do the limits show?
Errors Sample Unit
5 92
3 136
4 70
8
10
Sample number
Prob 8-16
Attribute (c) Chart
Number of defects
Lower control limit
Upper control limit
Center line
8 78
7 165
Answer
For the u-chart conditions: Number of samples = range from 70 to 165 and the number of
errors from 3 to 8.
Center Line for the u-chart:
u
= (5+3+4+8+7) / (92+136+70+78+165) = 27/541 = 0.05
Limits for the samples are, respectively:
Sample
Defects
Standard
Errors
Size
per unit
Deviation
LCLu
CL
UCLu
5
92
0.0543
0.0233
0
0.0499
0.1198
3
136
0.0221
0.0192
0
0.0499
0.1074
4
0.0571
0.0267
0
0.0499
0.1300
0.1258
7
165
0.0424
0.0174
0
0.0499
0.1021
Note: The following problems address sample size determination and refer to theory
covered in the Bonus Material for this chapter as contained on the Student Companion
Site.
18. Determine the appropriate sample size to estimate the proportion of sorting errors in an
apparel warehouse at a 95 percent confidence level. Historically, the sorting error rate is
0.01, and you wish to have an allowable statistical error of 0.02.
Answer
18. The sample size for the proportion of sorting errors at the apparel warehouse, using a
95% confidence level is:
0.0000
0.0200
0.1200
0.1400
1 3 5 7 9 11 13 15 17 19 21 23 25 27 29 31 33 35 37 39 41 43 45 47 49
Nonconformances per unit
Sample number
Prob. 8-17
Attribute (u) Chart
Defects per unit
Lower control limit
Upper control limit
Center line
Answer
First, we must find an estimated p for Localtel’s sample:
20. An engineer at Shoefactory, Inc. wants to calculate the cycle time (time to make one unit)
for a process based on work sampling observations of workers performing the job. The
standard deviation for the process times is 0.4 minutes, based on a small sample of
observations which she took. If the engineer want to be 95% confident of being in error
by only 0.125 minutes, what sample size should she take?
Answer