CHAPTER 8
Measuring and Controlling Quality
Teaching Notes
This chapter presents the basic concepts of quality measurement and statistical process control.
These include key types of measures, measurement system evaluation process capability, control
charting techniques, design and analysis of charts, managerial requirements for implementation
of SPC, and SPC considerations within service organizations.
The instructor materials include a control chart simulation template and examples, by
which instructors may generate data for control chart analysis that have given (and random)
characteristics. See the Ch 08 – Control Chart Simulation Template folder.
In addition, the Ch 08 – Supplementary Readings folder contains documents that you
might wish to use in your class:
• Alternative Process Capability Indexes
• Measurement Instruments
• Quality Cost Indexes
• Sample Size Determination
• Statistical Foundations of Control Charts
The following article may also be of use: Marilyn Hart. “Learning by Doing: A Series of Hands–
on Projects for SPC,” Quality Engineering, 17:127–137, 2005. This should be available through
your school library.
Key objectives for this chapter include:
• To define measurement as the act of collecting data to quantify the values of product,
service, process, and other business metrics. Measures and indicators refer to the
numerical results obtained from measurement. Good measures and indicators must be
SMART: simple, measurable, actionable, related (to customer requirements and to each
other), and timely.
• To learn basic measurement terminology and concepts. A unit of work is the output of a
process or an individual process step. A nonconformance is any defect or error associated
with a unit of work. In manufacturing the term defect is commonly used, and in service
applications, the term error describes a nonconformance. A nonconforming unit of work is
one that has one or more nonconformances. Throughput yield (TY) is the number of units
that have no nonconformances. Rolled throughput yield (RTY) is the proportion
of conforming units that results from a series of process steps.
• To identify metrics used in SPC, which fall into the categories of attributes or variables.
Variable measurements are concerned with the degree of conformance to specifications,
where attribute data counts the presence or absence of a characteristic. Collecting attribute
data is usually easier than collecting variable data because the assessment can usually be
done more quickly by a simple visual inspection or count, whereas variable data require the
use of some type of measuring instrument.

• To be able to compute defects per million opportunities (dpmo) = (Number of defects
discovered)/opportunities for error) × 1,000,000. In services, the term often used as an
analogy to dpmo is errors per million opportunities (epmo).
• To explore the concept of the cost of quality (COQ) as a way to translate quality problems
into the language of upper management—money. Through the use of quality cost information,
management identifies opportunities for quality improvement, is aided in budgeting and cost
control, and can use it as a scoreboard to evaluate an organization’s success. Quality costs
generally are categorized into prevention, appraisal, internal failure, and external failure
costs. In manufacturing, such costs are typically product-oriented, while in services they are
labor dependent.
• To define metrology—the science of measurement – broadly, as the collection of people,
equipment, facilities, methods, and procedures used to assure the correctness or adequacy of
measurements. It is a vital part of global competitiveness, including characteristics such as:
accuracy, precision, repeatability or equipment variation, reproducibility or operator
variation, calibration and traceability.
• To learn that a repeatability and reproducibility (R&R) study is a study of variation in a
measurement system using statistical analysis.
• To appreciate that process capability is the range over which the natural variation of a
process occurs as determined by the system of common causes; that is, what the process can
achieve under stable conditions. The relationship between the natural variation and
specifications is often quantified by a measure known as the process capability index, Cp.
• To learn that a process capability study is a carefully planned study designed to yield
specific information about the performance of a process under specified operating conditions.
Three types of studies are a peak performance study, process characterization study, and
component variability study.
• To learn that pre-control is a technique for monitoring process capability over time. It is
particularly suited to machining applications, but should only be used when process
capability is good.
• To establish the importance of statistical process control as a means to give workers the
information that they need about when a process should be adjusted and when it should not
be adjusted, by identifying special causes of variation that signal the need to take corrective
action when appropriate. When special causes are present, the process is deemed to be out of
control. If the variation in the process is due to common causes alone, the process is said to
be in statistical control and corrective action is not indicated. Histograms alone do not allow
one to distinguish between common and special causes of variation.
• To learn that capability and control are independent concepts. Ideally, a process should have
both high capability and be in control. If a process is not in control, it should first be brought
into control before attempting to evaluate process capability.
• To understand that a control chart is simply a run chart, generally containing sample
statistics, to which two horizontal lines, called control limits are added: the upper control
limit (UCL) and lower control limit (LCL). The process for constructing and using a
control chart includes preparation, data collection, determination of trial control limits,
analysis and interpretation, estimation of process capability using the control chart data, and
use a problem-solving tool.

• To identify control chart patterns, including: when a process is in control, no points are
outside of control limits; the number of points above and below the center line is about the
same; the points seem to fall randomly above and below the center line; and most points (but
not all) are near the center line, with only a few close to the control limits. Conversely,
typical out-of-control conditions are represented by sudden shifts in the mean value, cycles,
trends, hugging of the center line, hugging of the control limits, and instability.
• To introduce the common control charts for variables (x- and R-charts;x – and s-charts;
and individual and moving range charts). and attributes (p-, np–, c- and u-charts), show
how they can be constructed, and describe their use in organizations. Charts for attributes
include p-, np–, c- and u-charts. The np-chart is an alternative to the p-chart, and controls the
number nonconforming for attributes data. Charts for defects include the c-chart and u-chart.
The c-chart is used for constant sample size and the u-chart is used for variable sample size.
• To become aware of factors that must be understood in designing control charts, and how one
must be concerned with how the sample data are taken, the sample size, the sampling
frequency, and the location of the control limits. The process for constructing and using a
control chart includes preparation, data collection, determination of trial control limits,
analysis and interpretation, estimation of process capability using the control chart data, and
use as a problem-solving tool. These factors influence the amount of useful information
obtained from the charts, the ability to detect process changes, the potential for error, and the
cost of application.
• To understand how ISO 9000 places increased emphasis on the use of statistical methods and
the fact that a new ISO standard, 11462-1, has been designed to provide guidance for
organizations wishing to use SPC to meet these requirements.
ANSWERS TO QUALITY IN PRACTICE FEATURES
Using a u-Chart in a Receiving Process
1. Verify the computation of the center line and control limits in Figure 8.51.
See the Excel workbook in the Quality in Practice Excel Files folder in the instructor materials
for verification of the chart and complete calculations. The average number of packing slip errors
can be obtained by taking the square root of the sum of the errors and dividing by the total
number of packing slips reviewed.
For the u-chart we have: 62 samples; total n = 5129, number of defects = 479
u
= 479/5129 = 0.09339
Control limits must be calculated for each sample, since each sample size is different. A typical
calculation for one set of control limits for the first individual sample is:
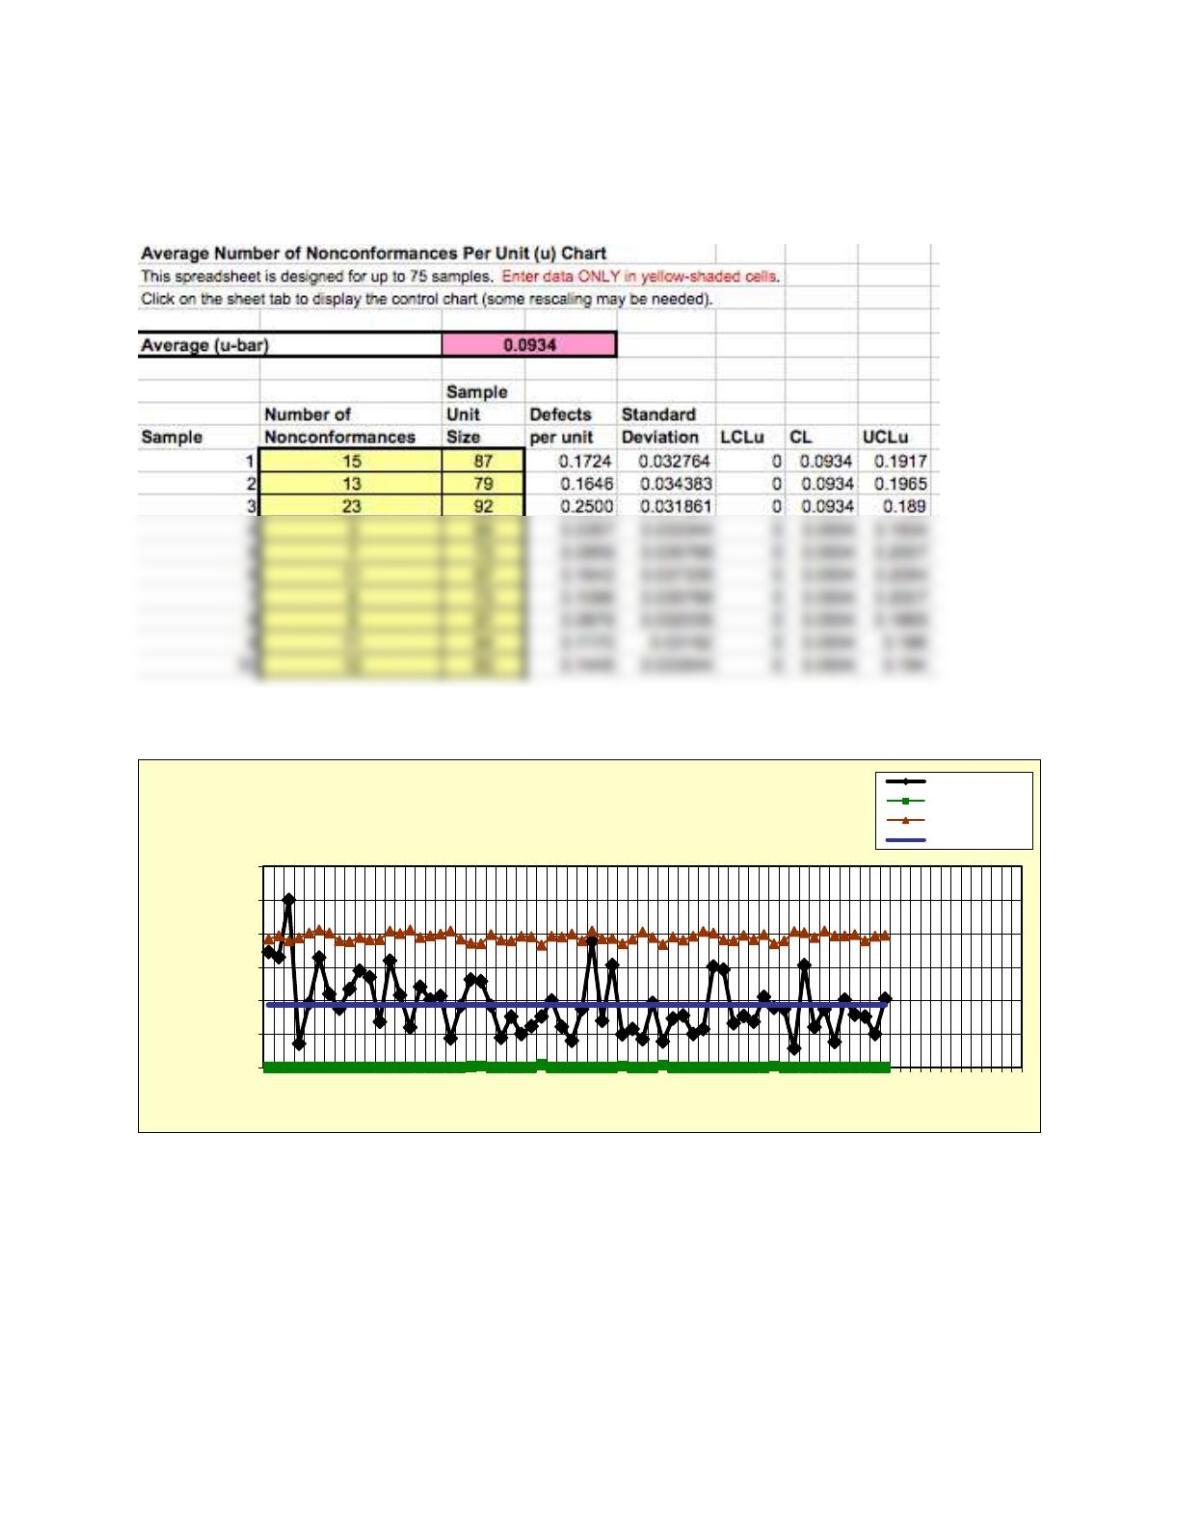
These are easily computed in the u-Chart Excel template. A portion of the results is shown
below:
The chart is shown below.
2. What information might a separate chart for each error category provide? Would you
recommend spending the time and effort to make these additional computations?
In the data, all error types are lumped together. The chart in Figure 8.52 shows the distribution
of packing slip errors. A separate chart for each category would help to pinpoint the contributing
factors for out-of-control conditions and understand which categories were stable and which
fluctuated over a wide range. The decision as to whether the time and effort required to keep
0.00
0.05
0.10
0.15
0.20
0.25
0.30
1 4 7 10 13 16 19 22 25 28 31 34 37 40 43 46 49 52 55 58 61 64 67 70 73
Nonconformances per
unit
Sample number
Attribute (u) Chart Defects per unit
Lower control limit
Upper control limit
Center line
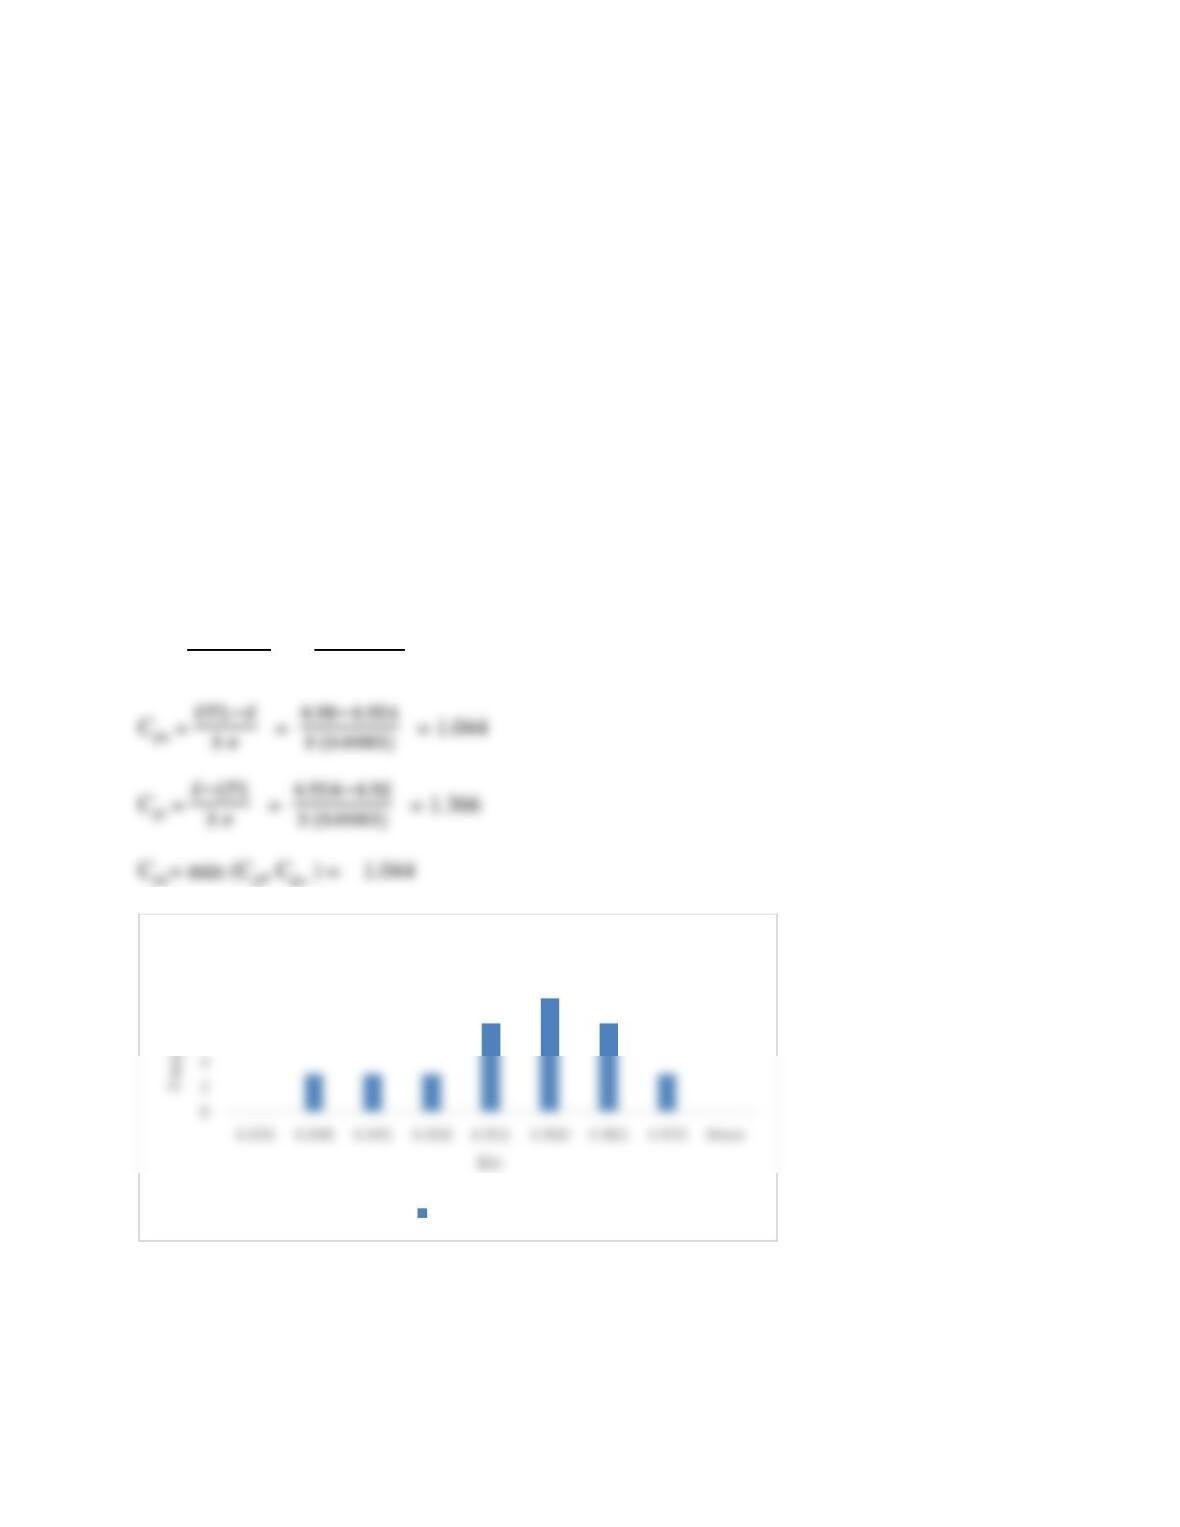
separate charts could be justified, would depend on the improvement objectives of the company.
For example, they start with a chart for “wrong purchase order” since this has the highest number
of errors.
Applying SPC to Pharmaceutical Product Manufacturing
1. Using the data for the initial process capability study sample given in Table 8.7, compute
the process capability indexes and construct a histogram for these data.
See the Excel workbook in the Quality in Practice Excel Files folder in the instructor materials.
Average
4.954
Standard deviation
0.008305932
UTL = 4.98, LTL = 4.92
Cp = 𝑈𝑇𝐿−𝐿𝑇𝐿
6 𝜎 = 4.98−4.92
6 (0.0083) = 1.205
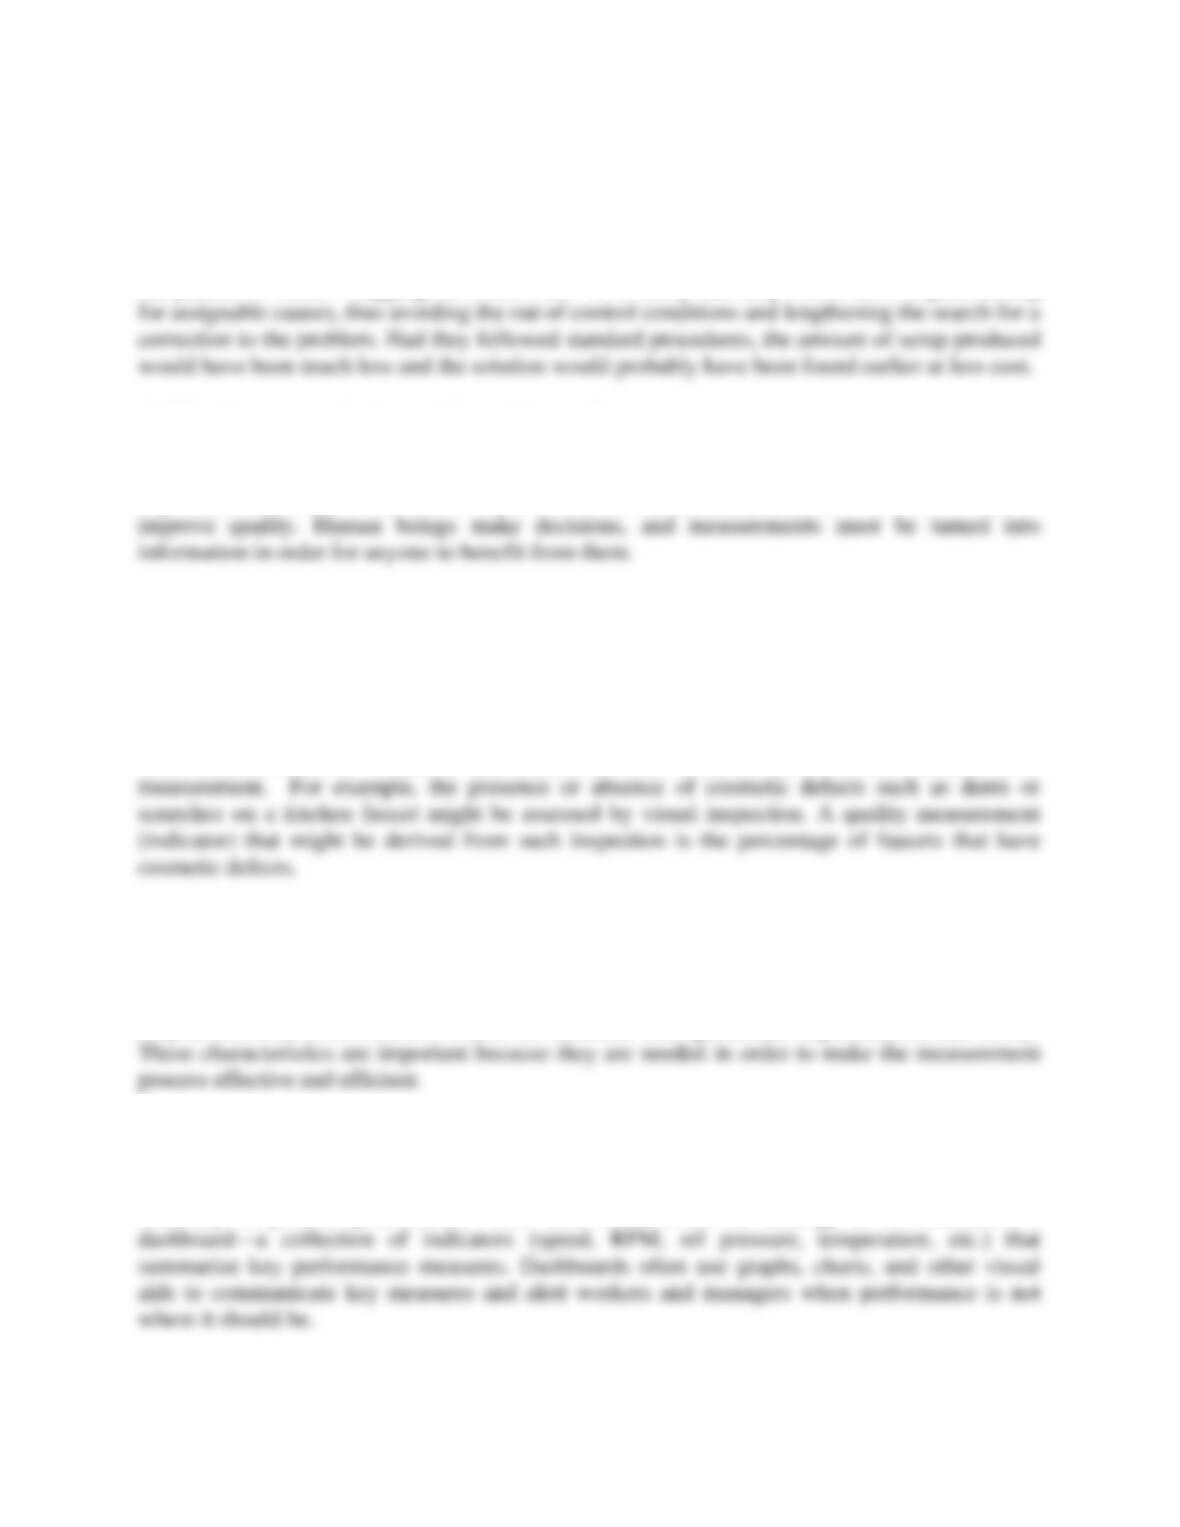
The histogram shows that the distribution is skewed toward the smaller values, reflecting the
smaller sample means at the beginning of the study and sample 16 in the middle of the study.
6
8
10
Histogram
Frequency
2. Explain why it was incorrect that the operators did not plot the initial data, find special
causes, and compute new control limits. What might have happened had they done it
correctly?
If the operators had plotted the first few points, within 8 or 9 samples they would have noticed
the pattern of values “hugging the center line.” It is likely that they would have begun looking
3. What lessons can be learned from this case?
The major lesson to be learned from this case is that SPC can work to the advantage of an
organization, if followed systematically. If not followed systematically, SPC will not be able to
ANSWERS TO REVIEW QUESTIONS
1. Define measurement, and explain the difference between measures and indicators.
Measurement is the act of collecting data to quantify the values of product, service, process, and
other business metrics. Measures and indicators refer to the numerical results obtained from
2. What does the acronym SMART signify for measurement? Why are these
characteristics important?
The acronym SMART is used to characterize the elements that constitute a good measurement:
simple, measurable, actionable, related (to customer and operational requirements), and timely.
3. What is a dashboard and why is it valuable in quality control?
Dashboards typically consist of a small set of measures (five or six) that provide a quick
summary of process performance. This term stems from the analogy to an automobile’s
4. Explain the difference between a nonconformance and a nonconforming unit of work.
A non-conformance (sometimes called a defect) is when an item does not conform to a specific
5. What is the difference between an attribute measurement and a variable measurement?
Variables data is data such as length, time, weight, etc. that is measured along a continuous
scale. Attributes data assumes only two values: good-bad, pass-fail, etc. and is measured by
6. Explain the difference in measuring nonconformances per unit and defects per million
opportunities (dpmo)? What advantages does dpmo have as a quality measure?
When nonconformances per unit are measured, an item is being checked or physically measured
to ensure that one or more specifications are within tolerance limits. In contrast defects per
million opportunities (dpmo) is an indicator obtained by counting the number of defects in a
7. Why are cost of quality programs valuable to managers?
Cost of quality programs are valuable to managers because they translate poor quality and its
results into the language that managers use and understand — money. They serve purposes such
8. List and explain the four major categories of quality costs. Give examples of each.
The four categories of quality costs are: prevention costs, appraisal costs, internal failure
costs, and external failure costs. The first are costs incurred to prevent non-conformance, the
second are costs incurred in measurement and data analysis, the third are costs of unsatisfactory
9. Provide some examples of low-tech and high-tech measuring instruments used in quality
control.
Low-technology instruments are primarily manual devices that have been available for many
years and include rulers, calipers, mechanical micrometers, go-no go gauges, etc.; high-
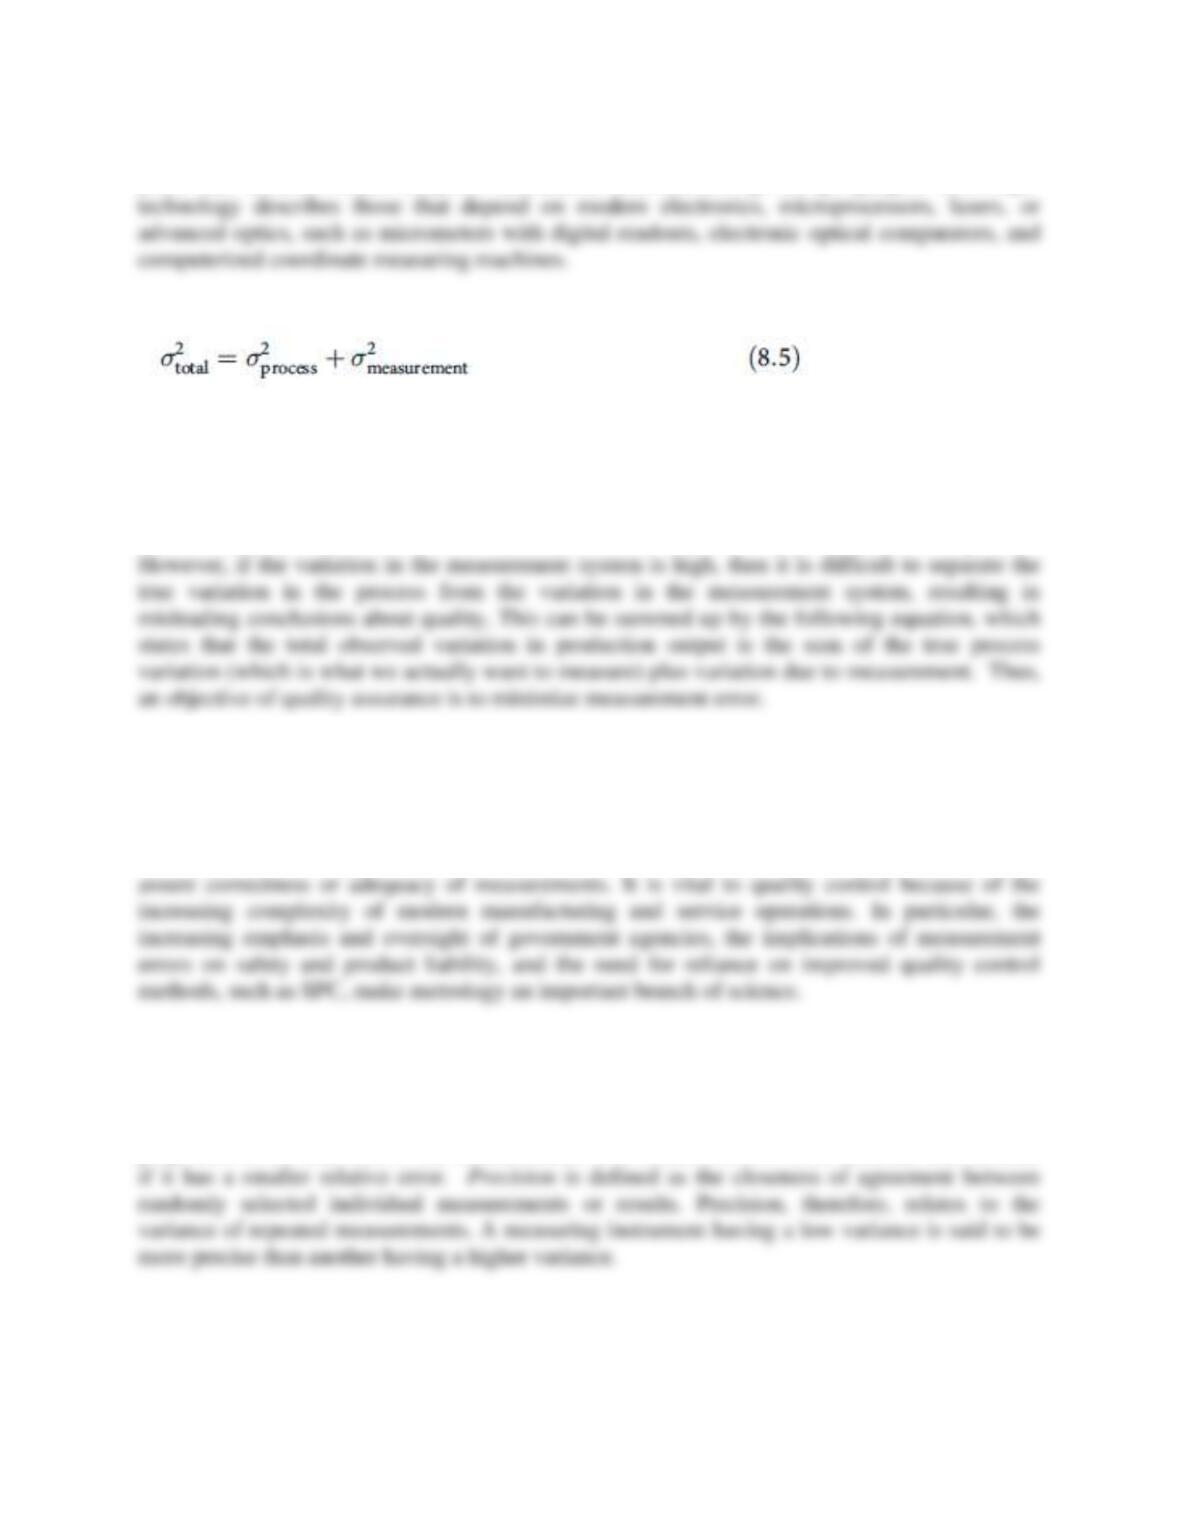
10. Explain the importance of formula (8.5):
Modern measurement systems often use a combination of human operators and technological
instruments. Observed variation in process output stems from the natural variation that occurs in
the output itself as well as from the measurement system. The measurement system includes the
workers who take the measurements and the instruments they use. If there is little variation in the
measurement system, then the observed measurements reflect the true variation in the process.
11. Describe the science of metrology.
Metrology is the science of measurement. It formerly included only the measurement processes
involved in gauging the physical attributes of objects. Today, metrology is much more broadly
defined as: the collection of people, equipment, facilities, methods, and procedures used to
12. What is the difference between accuracy and precision?
Accuracy is defined as the closeness of agreement between an observed value and an accepted
reference value or standard. Accuracy is measured as the amount of error in a measurement in
proportion to the total size of the measurement. One measurement is more accurate than another
13. What is calibration and why is it important to a good quality control system?
14. Repeatability, or equipment variation (EV), is the variation in multiple measurements
of a quality characteristic by an individual using the same instrument. Repeatability indicates
how consistent a measuring instrument is. Repeatability is influenced by the condition of the
measurement instrument, environmental conditions such as noise or lighting, the worker’s health
15. How is an R&R study performed? What is its purpose?
Repeatability and reproducibility (R&R) require a study of variation and can be addressed
through statistical analysis. R&R studies must be done systematically, and require quite a
number of steps. A repeatability and reproducibility study is conducted in the following manner
(Note: a complete set of formulas has been omitted for the sake of brevity).
1. Select m operators and n parts. Typically at least 2 operators and 10 parts are chosen.
Number the parts so that the numbers are not visible to the operators.
2. Calibrate the measuring instrument.
3. Let each operator measure each part in a random order and record the results. Repeat this
for a total of r trials. At least two trials must be used. Let Mijk represent the kth
measurement of operator i on part j.
Part variation (PV) measures the variation among different parts. Part variation is determined by
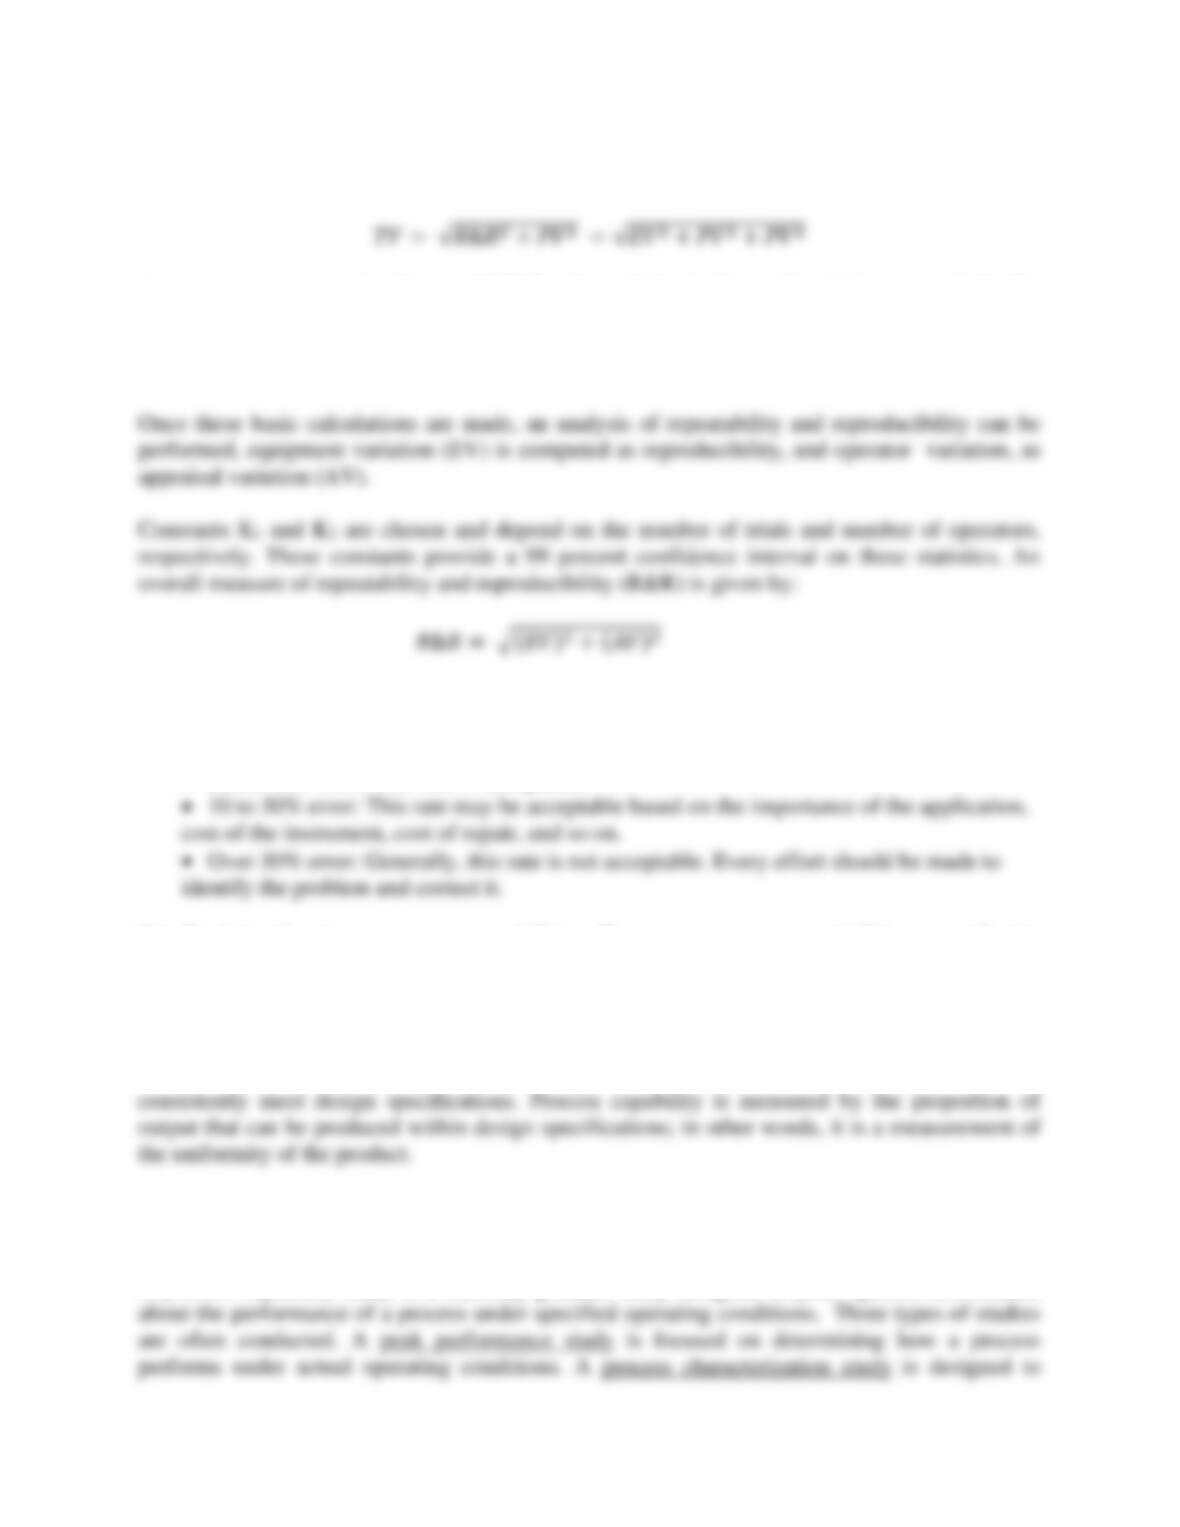
multiplying the range of part averages, Rp, by a constant K3. Then, the total variation, TV, is
calculated as:
A measurement system is adequate if R&R is low relative to the total variation, or equivalently,
the part variation is much greater than the measurement system variation. The industry guides
have historically expressed EV, AV, R&R, and PV as a percent of the total variation by dividing
each by TV and multiplying by 100 as a means of evaluating measurement systems.
Repeatability and reproducibility are often expressed as a percentage of the tolerance of the
quality characteristic being measured. The American Society for Quality suggests the following
guidelines for evaluating these measures of repeatability and reproducibility:
• Under 10% error: This rate is acceptable.
16. Explain the term process capability. How can process capability generally be
improved?
Process capability is the range over which the natural variation of a process occurs as
determined by the system of common causes. It is the ability of the combination of people,
machines, methods, materials, and measurements to produce a product or service that will
17. What are the three major types of process capability studies? Describe the methodology
of conducting a process capability study.
A process capability study is a carefully planned study designed to yield specific information
18. Define the process capability indexes, Cp, Cpl, and Cpu, and explain how they may be
used to establish or improve quality policies in operating areas or with suppliers.
The following are brief definitions of the various process capability indexes:
• Cp is the ratio of the specification width to the natural tolerance of the process
• Cpl is the lower one-sided index that relates the distance from the process mean to the
lower tolerance limit to its 3 natural spread
19. Explain how to interpret the ratio Cpk /Cp .
We may use the ratio Cpk/Cp to evaluate how well the process is centered. If k = 0, then Cpk/Cp
20. What does the term in statistical control mean?
A process is said to be in statistical control when variations in the process are due only to
common causes (no special causes are present). A process may be in statistical control but not be
capable of meeting design specifications. Thus, design specifications are requirements (ideally)
demanded by the customer, and translated into technical specifications by the designer. If the
21. How does a process performance index differ from a process capability index?
If a process is thought to include special causes of variation, practitioners sometimes use
alternative capability indexes, called process performance indexes: Pp, Ppl, Ppu, and Ppk.
22. Explain how pre-control is applied. How does it differ from statistical process control?
In many manufacturing operations such as machining, it is important to ensure that all parts are
produced within specifications. Pre-control is a simple technique for ensuring that a process
that has relatively good capability remains in control. The idea behind pre-control is to divide the
tolerance range into zones by setting two pre-control lines halfway between the center of the
Pre-control is applied as follows. As a manufacturing run is initiated, five consecutive
parts must fall within the green zone. If not, the production setup must be reevaluated before the
full production run can be started. Once regular operations commence, two parts are sampled; if
23. Briefly describe the methodology of constructing and using control charts.
To develop control charts for variables, such as
x
– and R-charts and
x
-and s-charts, an analyst
must take a number of samples (usually 25-30) of a certain size (usually 3-10 items per sample)
from a process that is thought to be in statistical control, and calculate the sample means and
ranges. Using standard statistical methods, the grand mean (mean of the sample means) and
x
x
24. What does one look for in interpreting control charts? Explain what a control chart for
a process in statistical control should look like, and the characteristics of out-of-control
indicators.
The characteristics that one looks for in interpreting control charts are those that indicate whether
or not the process is remaining in control, or whether assignable causes have crept into throw the
process out of control. These might be detected through using the rules of thumb of: 1) one point
outside of a control limit; 2) two out of three consecutive points in the outer one-third region; 3)
25. Why is the s-chart sometimes used in place of the R-chart?
The s-chart is sometimes used in place of the R-chart because the sample standard deviation is
more sensitive to changes in process variability, especially for larger sample sizes. In addition,
26. Describe some situations in which a chart for individual measurements would be used.
A chart for individual measures may be particularly useful in small batch production, where only
a few items are produced. It is also useful to measure individual items in automated processes
where data is easily obtained. With automated inspection for many manufacturing processes, the
27. Does an np -chart provide any different information than a p-chart? Why would an np-
chart be used?
An np-chart is a chart that shows the number of items from a sample that are non-conforming.
This is in contrast to the p-chart, which shows the fraction of a sample that is non-conforming.
28. Explain the difference between a c-chart and a u-chart.
C-charts are used to monitor and control the number of defects when the group size for the
sample remains constant. For example, if a 8 samples of 30 toy boats is taken from a production
29. What guidance does ISO standard 11462-1 provide for organizations wishing to use
SPC?
ISO 11462-1 is part of the general standard, called ISO 9000:2000, which emphasizes the use of
statistical methods. The standards require “applicable methods, including statistical techniques”
to be identified and used for monitoring and measuring products and processes, and that through
30. Explain the concept of rational subgroups.
Rational subgroups are samples that are chosen to be as homogenous as possible, so that each
sample reflects the system of common causes or assignable causes that may be present at any
31. What trade-offs are involved in selecting the sample size for a control chart?
Choosing the proper sample size involves several trade-offs. A small sample size is desirable
because it minimizes the opportunity for within-sample variation due to a special cause, keeps
32. Explain the economic trade-offs to consider when determining the sampling frequency
to use in a control chart.
Sampling frequency considerations are closely related to those of sample size. From a statistical
standpoint, taking large samples frequently is desirable, but not economical. Although no hard–
and-fast rules exist, samples should be taken frequently enough to provide an opportunity to
detect changes in process characteristics as soon as possible, thus reducing the chances of
SOLUTIONS TO PROBLEMS
1. Leatherlike Manufacturing Company makes an artificial leather-like product for the
fashion accessory market. The material is made in sheets and has the appearance of a thin
rug. Each sheet is 36 inches wide and 100 feet long and is wound into a roll. The quality
manager has requested that 200 rolls be inspected. Twenty-six non-conformances were
found.
a. Calculate the nonconformances per unit (NPU) and the throughput yield (TY).
b. If the production process consists of three steps, with step 1 having a TY of 92 percent;
step 2; 86 percent, and step 3, 93 percent what is the rolled throughput yield (RTY), and
the proportion nonconforming?
a. NPU = Number of nonconformances found/number of units inspected = 26/200 = 0.13
2. Wellplace Insurance Company processes insurance policy applications in batches of 50.
One day, they had 10 batches to process and, after inspection, it was found that four
batches had nonconforming policies. One batch had 3 nonconformances, another had 5,
another had 2, and another had 1 nonconformance. What were (a) the proportion
nonconforming for each batch, (b) the nonconformances per unit (NPU), in total for the 10
batches, and (c) the total throughput yield (TY) for the 10 batches?
a) the proportion nonconforming for each batch, was 0.06, 0.10, 0.04, and 0.02
b) the nonconformances per unit (NPU), in total for the 10 batches was:
3. Nighthawk Airlines measured their numbers of mishandled bags in one month and
found that they had lost 35 bags for 10,000 customers. If the average number of bags per
customer is 1.2, how many errors per million opportunities (epmo) does this represent?
The worldwide rate of baggage mishandling reported by SITA (Société Internationale de
Télécommunications Aéronautiques) in 2017 was 5.73 per 1,000 passengers. If the average
number of checked bags per passenger is assumed to be 1.3, how many errors per million
opportunities (epmo) does this represent? How does this compare with the rate for
Nighthawk – better or worse?
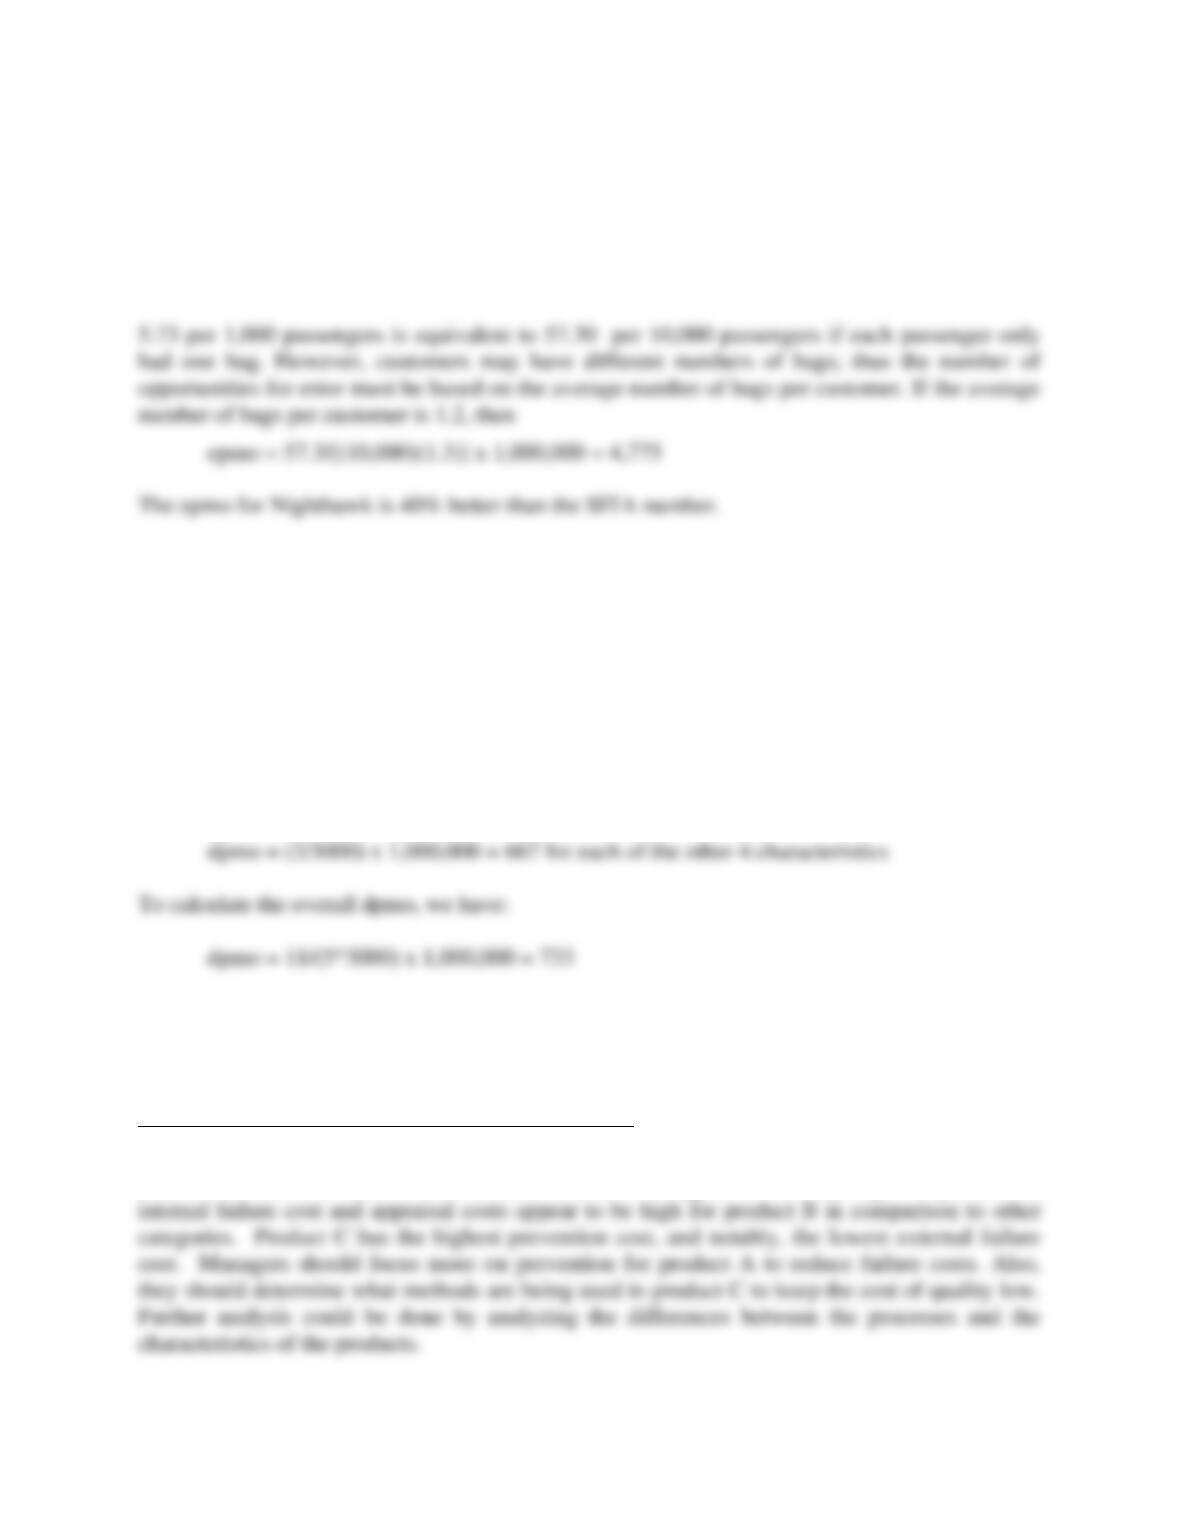
epmo = (Number of defects discovered) /opportunities for error x 1,000,000
epmo = 35/[(10,000)(1.2)] x 1,000,000 = 2,917
4. Boardwalk Electronics manufactures 300,000 circuit boards per month. A random
sample of 3,000 boards is inspected every week for five characteristics. During a recent
week, three defects were found for one characteristic, and two defects each were found for
the other four characteristics. If these inspections produced defect counts that were
representative of the population, what are the dpmo’s for the individual characteristics and
what is the overall dpmo for the boards?
For the individual characteristics, we have
dpmo = (3/3000) x 1,000,000 = 1,000 for the one characteristic
5. Analyze the cost data in the Excel workbook C08 Problem Data for the Costcutin Co.
What percent of sales are represented by each category of cost? What are the implications
of these data for management?
See Excel file Problem 8.5 in the instructor materials.
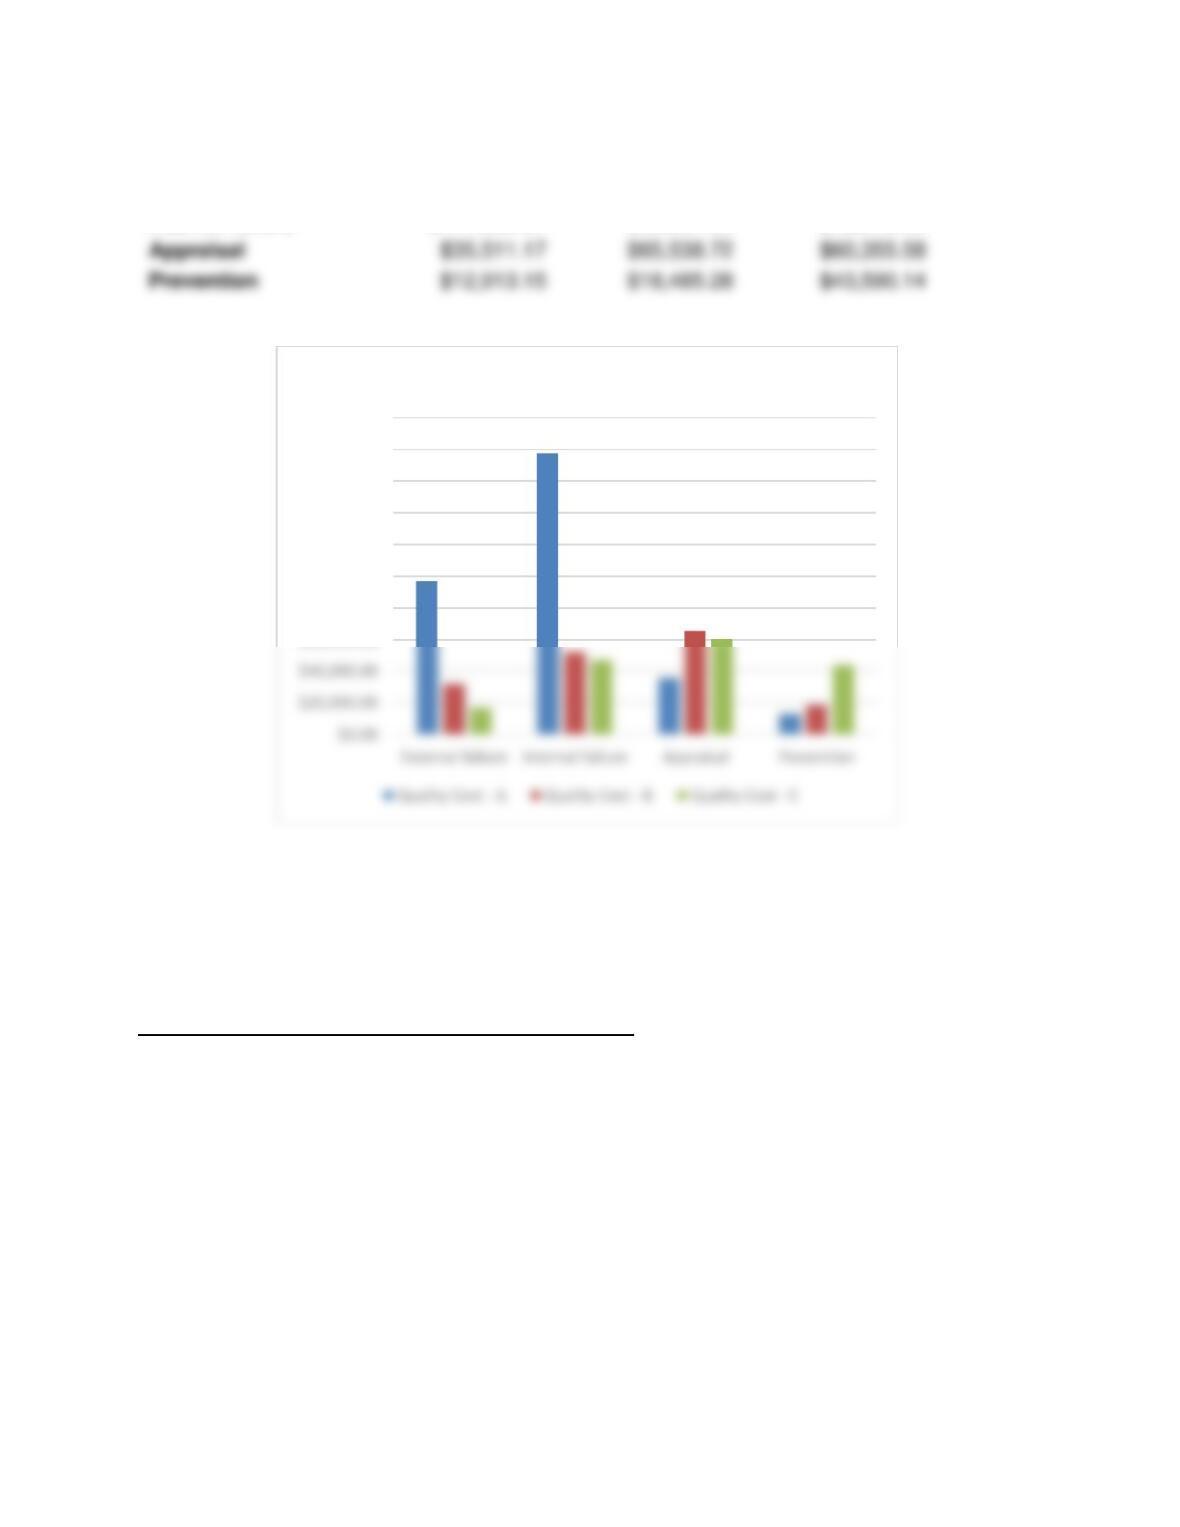
The table and chart below show the quality costs by category and product. Comparison of the
data shows that both internal and external failure costs appear to be very high for product A,
Quality Cost – A
Quality Cost – B
Quality Cost – C
External failure
$96,848.64
$31,929.12
$16,765.44
Internal failure
$177,555.84
$52,094.88
$46,943.23
6. Classify the cost elements for the Impressive Printing Company in the Excel workbook
C08 Problem Data into the proper quality cost categories and find the total quality cost by
category and percentage of total quality cost by category. Prepare a pie chart showing the
results.
See Excel file Problem 8.6 in the instructor materials.
$60,000.00
$80,000.00
$100,000.00
$120,000.00
$140,000.00
$160,000.00
$180,000.00
$200,000.00
Quality Costs
Appraisal
$35,511.17
$65,538.72
$60,355.58
Prevention
$12,913.15
$18,485.28
$43,590.14
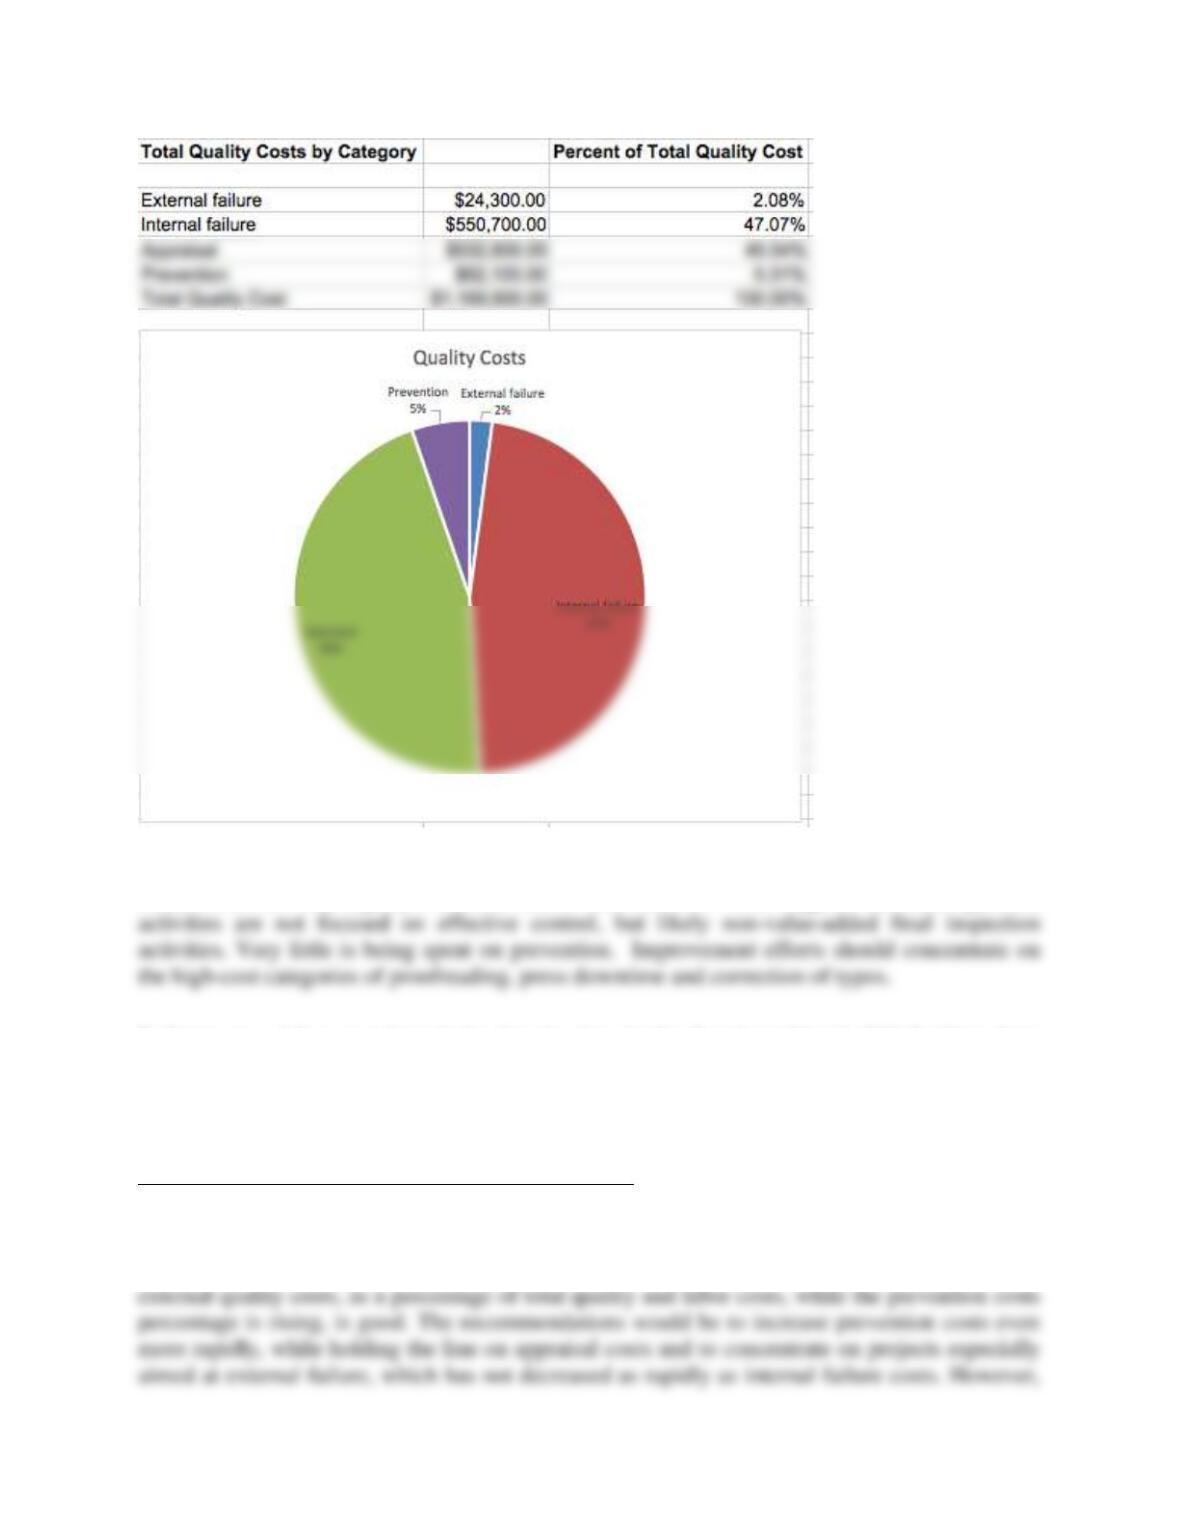
The spreadsheet analysis and pie chart show that despite a lot being spent on appraisal, internal
failure costs are very high, yet external failure costs are low. This suggests that their appraisal
7. Compute a labor cost base index for the data in the Excel workbook C08 Problem Data
for Miami Valley Aircraft Service Co. Analyze the quality cost information and prepare a
memo to management explaining your conclusions. (See the supplementary reading Quality
Cost Indexes on the Student Companion Site).
See Excel file Problem 8.7 in the instructor materials.
Miami Valley Aircraft Service Company’s data show a decreasing total quality cost index as a
percent of labor costs (except for a slight rise in the 2nd quarter), with significant decreases in
internal failure costs, possibly due to a concerted quality effort. The decrease in both internal and
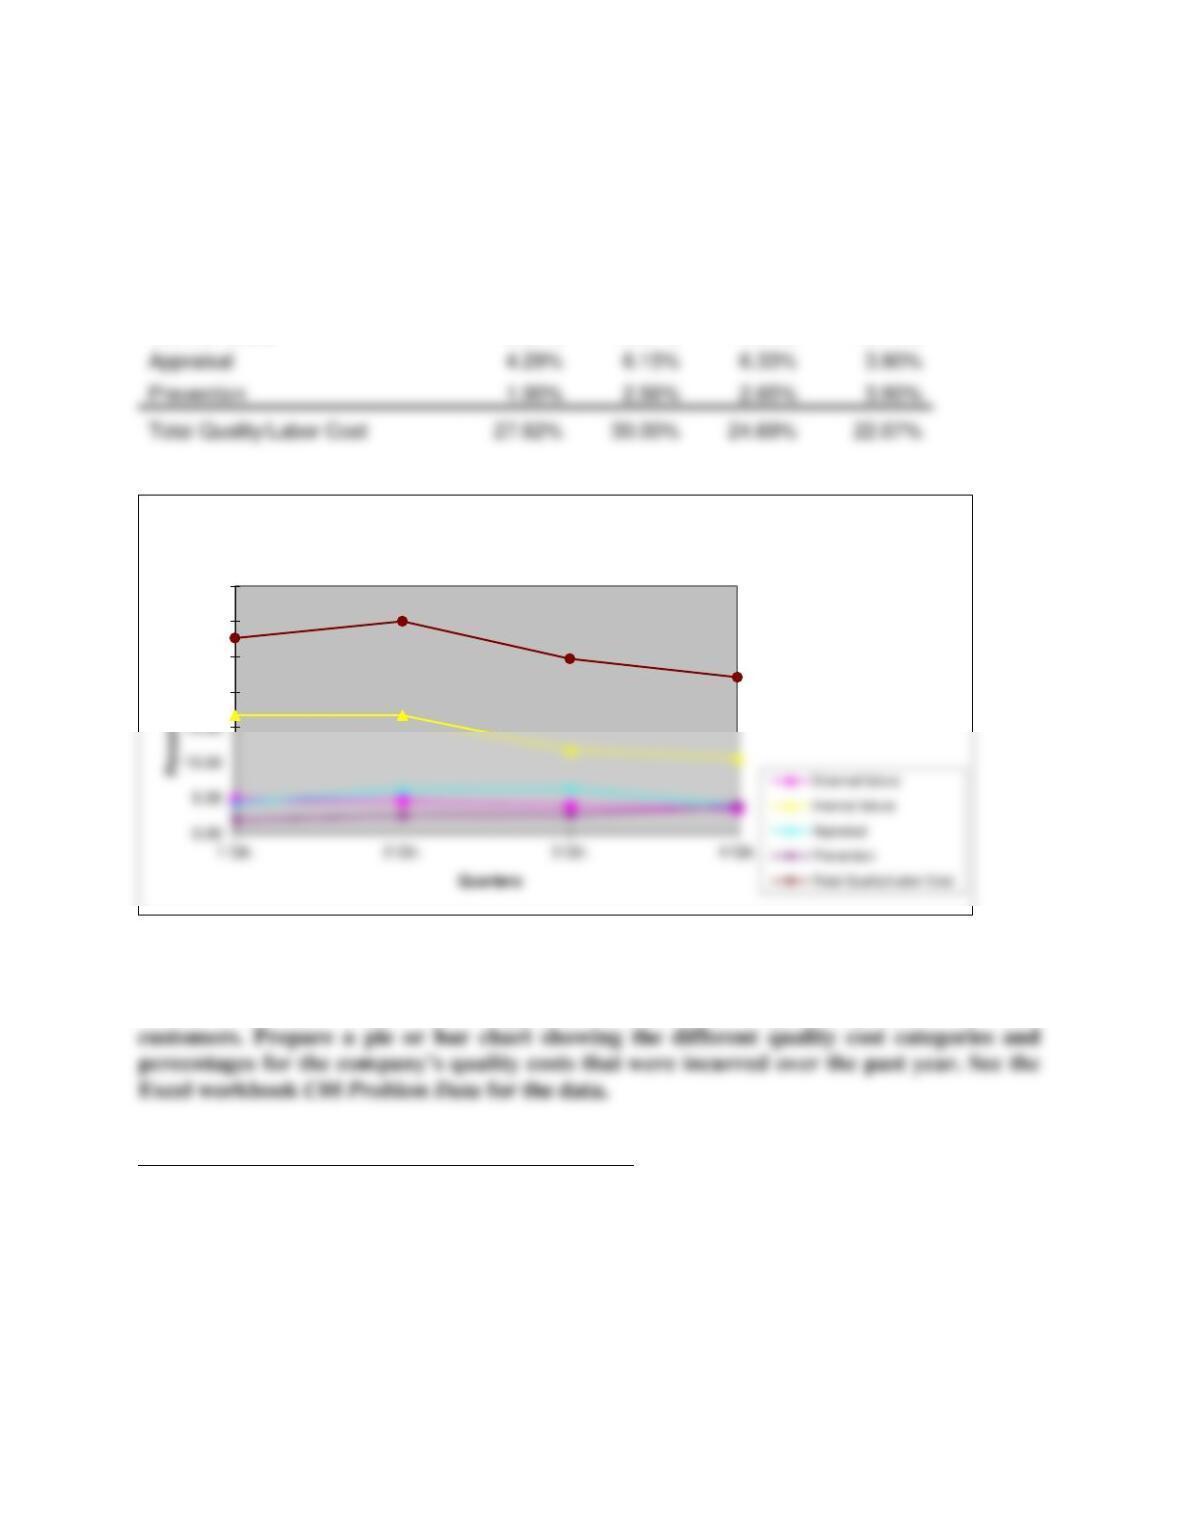
the caution is that doing so may increase total quality costs in the short run, as may have
happened in the 2nd quarter.
Labor cost indexes
Percent of quality cost/labor cost
1
2
3
4
External failure
4.76%
4.62%
3.88%
3.54%
Internal failure
16.67%
16.67%
11.84%
10.73%
8. Reship Solutions, Inc. has a distribution center in Cincinnati where it receives and
breaks down bulk orders from suppliers’ factories and ships out products to retail
See Excel file Problem 8.8 in the instructor materials.
Cost Elements by Category
External failure
Customer complaint rework
$34,000
Internal Failure
20.00
25.00
30.00
35.00
Miami Valley Aircraft Service Co. – Cost of Quality
Appraisal
4.29%
6.15%
6.33%
3.90%
Prevention
Total Quality/Labor Cost
Downtime due to conveyor/computer problems
$342,125
Packaging waste
$68,000
Correcting erroneous orders before shipping
$36,550
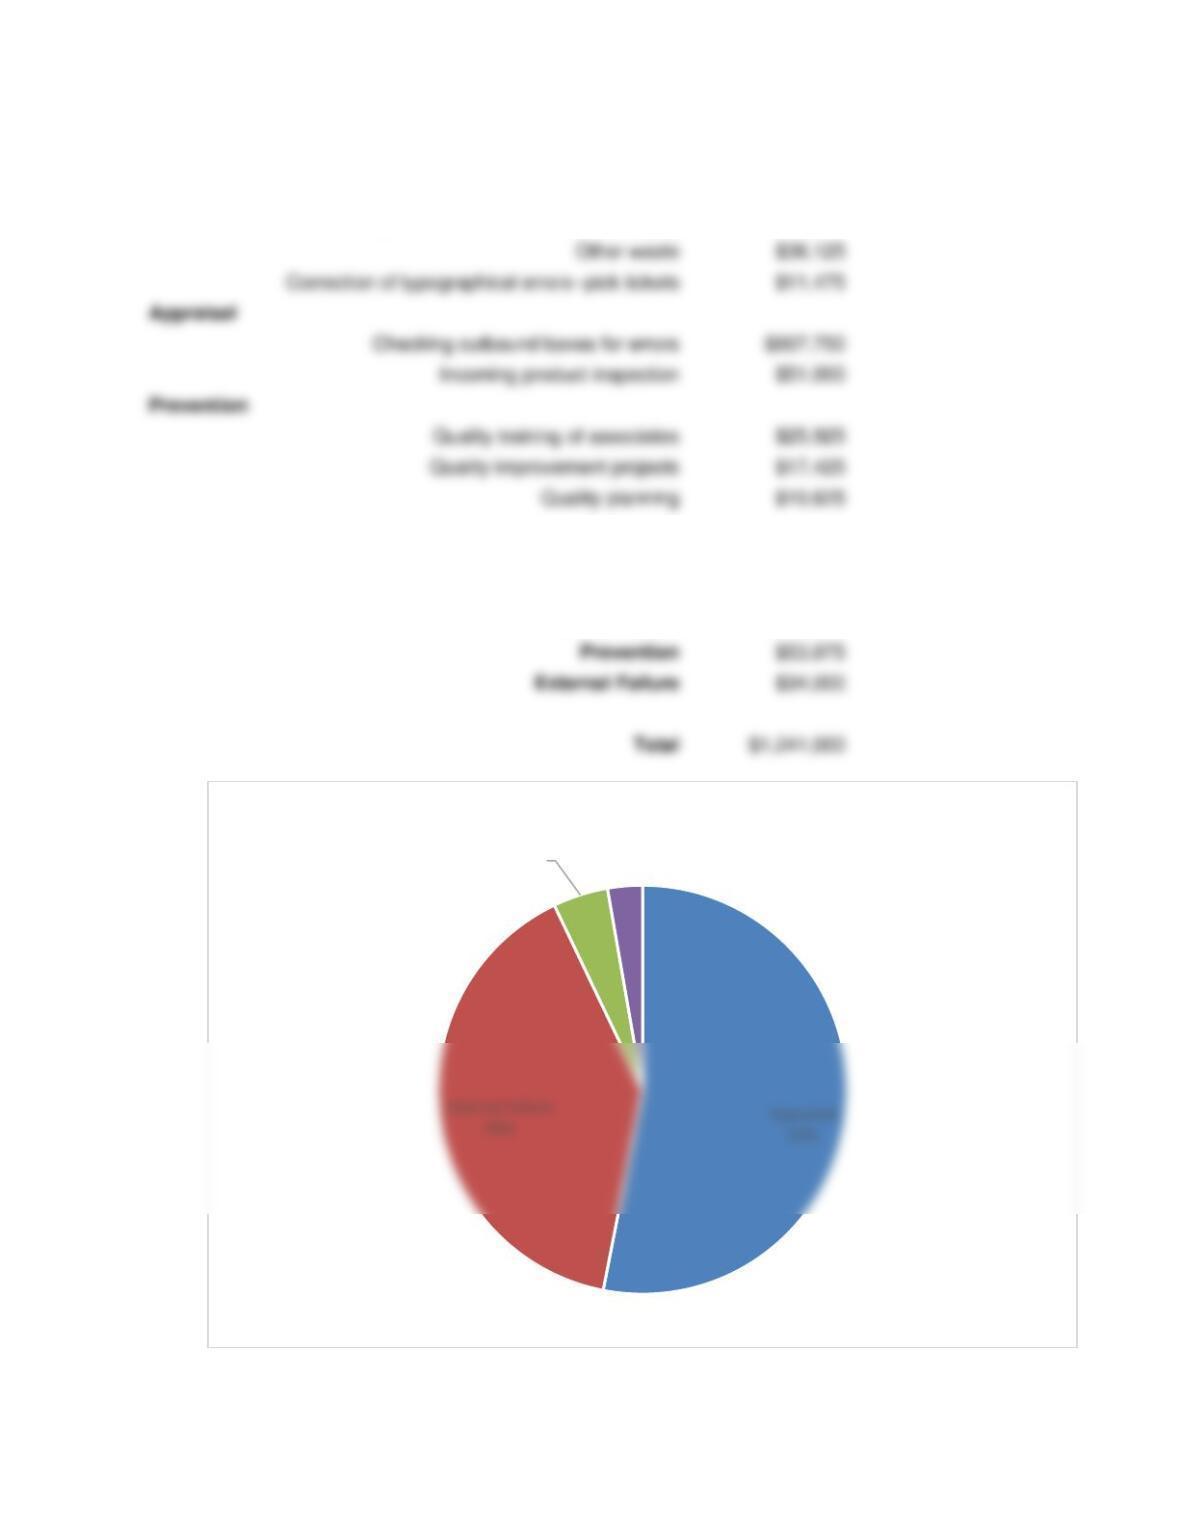
Total Quality Costs by Category
Appraisal
$658,750
Internal Failure
$494,275
$53,975
$34,000
Prevention
4%
External Failure
3%
Quality Cost Summary
$36,125
$11,475
Appraisal
$607,750
$51,000
Prevention
$25,925
$17,425
$10,625