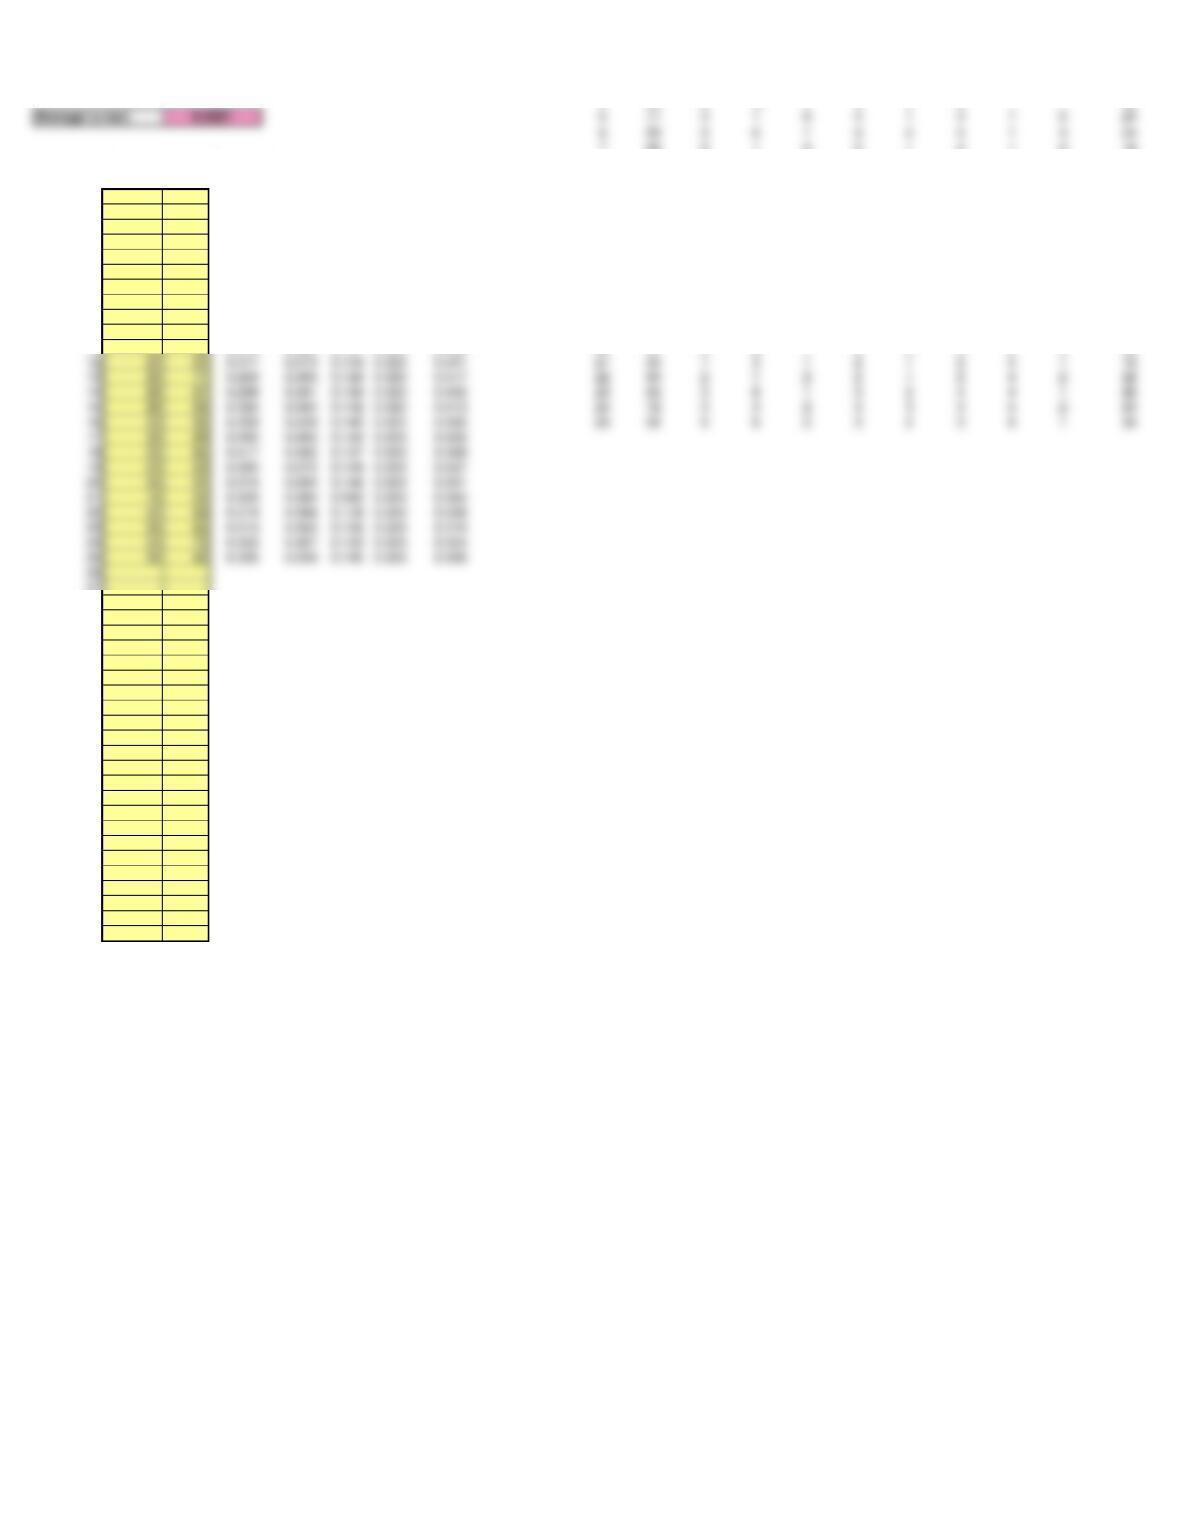
Montvalley Short-Haul Lines, Inc.
Billing Study Part II No. of Error Category Total
Day Bills 1 2 3 4 5 6 7 8 Errors
Average Number of Defects Per Unit (u) Chart 156 22311315 18
This spreadsheet is designed for up to 50 samples. Enter data ONLY in yellow-shaded cells. 2 72 21432225 21
Click on the sheet tab to display the control chart (some rescaling may be needed). 3 69 42422314 22
483 210 1 5 3 3 1 7 32
766 21531213 18
Number
Sample
Defects
Standard 878 31542225 24
Sample
of Defects
Size per unit
Deviation
LCLu CL UCLu 995 82742413 31
118 56 0.321 0.076 0.095 0.323 0.550 10 91 41533324 25
221 72 0.292 0.067 0.122 0.323 0.524 11 84 46221714 27
322 69 0.319 0.068 0.118 0.323 0.528 12 61 22622351 23
432 83 0.386 0.062 0.136 0.323 0.510 13 77 21531431 20
524 71 0.338 0.067 0.120 0.323 0.525 14 87 36142352 26
624 85 0.282 0.062 0.138 0.323 0.508 15 80 46152242 26
718 66 0.273 0.070 0.113 0.323 0.532 16 92 49232481 33
824 78 0.308 0.064 0.130 0.323 0.516 17 89 27131561 26
931 95 0.326 0.058 0.148 0.323 0.498 18 84 98142371 35
10 25 91 0.275 0.060 0.144 0.323 0.501 19 63 45122252 23
11 23 84 0.274 0.062 0.137 0.323 0.509 20 91 58133482 34
27
28
29
30
31
32
33
34
35
36
37
38
39
40
41
42
43
44
45
46
47
48
49
50
Average (u-bar) 0.3227 571 31641315 24
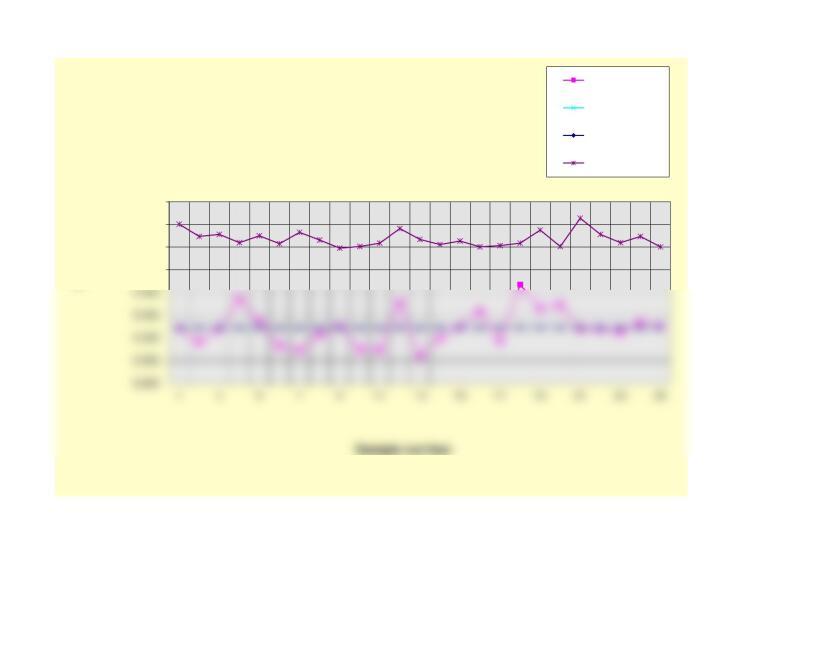
0.450
0.500
0.550
0.600
Defects per unit
Attribute (u) Chart
U Values
Lower Control Limit
Center Line
Upper Control Limit