Archives: Solution Manual
Management Chapter 7 Homework Cellurific Battery Life reliability Enter Data Only The
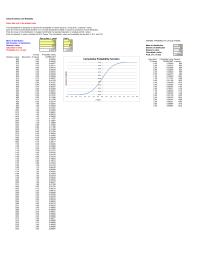
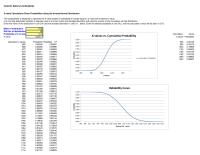
Cellurific Battery Life-Reliability Enter data only in the shaded cells This spreadsheet is designed to calculate the probability of values equal to, or less than, a desired x value, given the mean and standard deviation of a normally distributed variable. […]
Management Chapter 7 Homework What would your next steps be? How would you use data
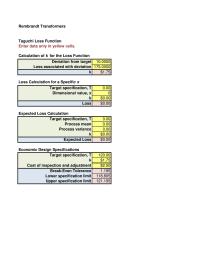
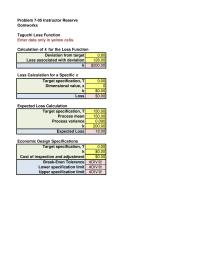
Rembrandt Transformers Taguchi Loss Function Enter data only in yellow cells. Calculation of k for the Loss Function Deviation from target 10.0000 Loss Calculation for a Specific x Target specification, T 0.00 Dimensional value, x 0 k$0.00 Loss $0.00 Expected […]
Management Chapter 7 Homework Specific Target Specification Dimensional Value Loss 000
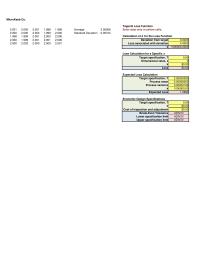
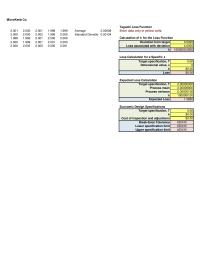
MicroKeeb Co. Taguchi Loss Function 2.001 2.000 2.001 1.998 1.999 Average 2.00008 Enter data only in yellow cells. 2.000 2.000 2.002 1.999 2.000 Standard Deviation 0.00104 k1000000.0000 Loss Calculation for a Specific x Target specification, T 0.00 Dimensional value, x […]
Management Chapter 7 Homework The cumulative percentage of failure for the 36 months
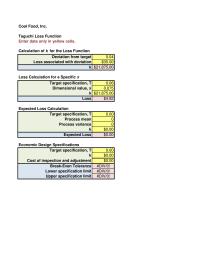
Cool Food, Inc. Taguchi Loss Function Enter data only in yellow cells. Calculation of k for the Loss Function Deviation from target 0.04 Loss Calculation for a Specific x Target specification, T 0.06 Dimensional value, x 0.075 k$21,875.00 Loss $4.92 […]
Management Chapter 7 Homework Attribute Georgios Moistness Flavor Healthy Food Nutricious
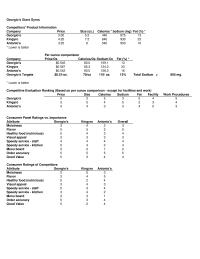
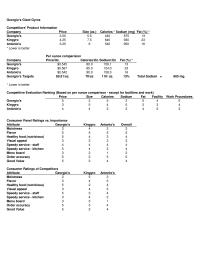
Georgio’s Giant Gyros Competitors’ Product Information Company Price Size (oz.) Calories * Sodium (mg) * Fat (%) * Georgio’s 3.00 5.5 440 875 13 Kingyro 4.25 7.5 640 930 23 * Lower is better Per ounce comparision Company Price/Oz. Calories/Oz.* […]
Management Chapter 7 Homework The trend that is evident from the data is the increasing number of units
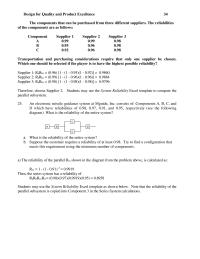
Design for Quality and Product Excellence 34 The components that can be purchased from three different suppliers. The reliabilities of the components are as follows: Component Supplier 1 Supplier 2 Supplier 3 A 0.99 0.99 0.98 B 0.95 0.96 0.98 […]
Management Chapter 7 Homework What is the value of k in the Taguchi loss function?
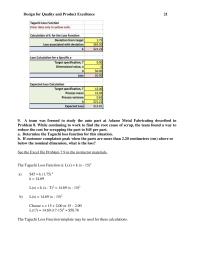
Design for Quality and Product Excellence 21 9. A team was formed to study the auto part at Adams Metal Fabricating described in Problem 8. While continuing to work to find the root cause of scrap, the team found a […]
Management Chapter 7 Homework What The Difference Between Inherent Reliability And
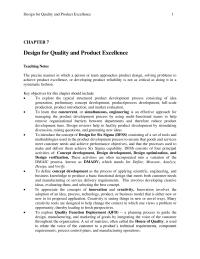
Design for Quality and Product Excellence 1 CHAPTER 7 Design for Quality and Product Excellence Teaching Notes The precise manner in which a person or team approaches product design, solving problems to achieve product excellence, or developing product reliability is […]
Management Chapter 7 Homework Build an environment that empowers
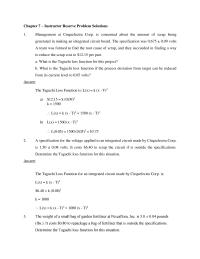
L(0.05) = 1500 (0.05)2 = $3.75 $6.40 = k (0.08)2 k = 1000 L(x) = k (x – T)2 = 1000 (x – T)2 Chapter 7 – Instructor Reserve Problem Solutions 1. Management at Cirquelectra Corp. is concerned […]
Management Chapter 7 Homework Lead the pursuit of improvement
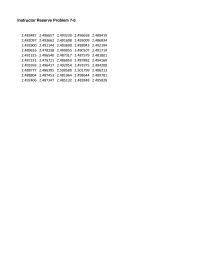
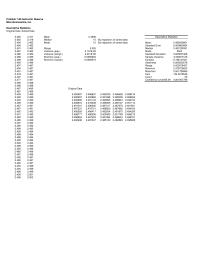
Instructor Reserve Problem 7-6 2.483487 2.496657 2.493230 2.496658 2.488419 2.482097 2.493662 2.491698 2.495009 2.486834 2.493900 2.491144 2.493690 2.498943 2.492194 2.489616 2.478238 2.499055 2.490107 2.491714 2.491315 2.496540 2.487317 2.487579 2.481801 2.487231 2.476721 2.486850 2.487882 2.494160 2.495593 2.496417 2.492054 2.491975 2.494200 2.488777 […]
Management Chapter 7 Homework Cumulative Failure Probability 0350 Probability Failure
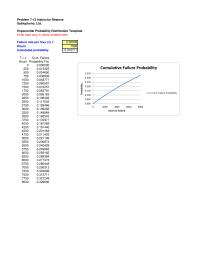
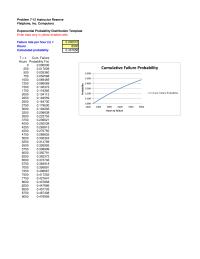
Problem 7-13 Instructor Reserve Sabiophono, Ltd. Exponential Probability Distribution Template Enter data only in yellow-shaded cells. Failure rate per hour (λ) = 0.00005 T = x Cum. Failure Hours Probability F(x) 750 0.036806 1000 0.048771 1250 0.060587 1500 0.072257 1750 […]
Management Chapter 7 Homework Regression Residual Total Number Not Failed
National Partamiento Co. Months in Service Number Installed Number Failed Number Not Failed Cumulative Failures Month x Failures Months in Service Monthly Failure Rate Cumulative Failure Rate 124440 124439 1 1 1 0.00004092 0.00004092 Regression on number of units failed […]
Management Chapter 7 Homework As each bird flaps its wings, it
Problem 7-12 Instructor Reserve Flatplane, Inc. Computers Exponential Probability Distribution Template Enter data only in yellow-shaded cells. Failure rate per hour (λ) = 0.000072 T = x Cum. Failure Hours Probability F(x) 1250 0.086069 1500 0.102372 1750 0.118385 2000 0.134112 […]
Management Chapter 7 Homework Series Systems Exponential Reliability Component Reliability Component Failure Rate
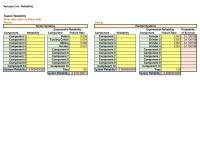
Autosys, Inc. Reliability System Reliability Enter data only in yellow cells Part a) Part b) Probability Component Reliability Component Failure Rate Component Reliability Component Failure Rate of Survival Component 1 Robot 0.006 Component 1 Grinder 1 0.001 0.1130796 Component 2 […]
Management Chapter 7 Homework You have undoubtedly seen a flock of geese flying overhead
Problem 7-11 Instructor Reserve Airponents, Inc. Enter data only in the shaded cells This spreadsheet is designed to calculate the probability of values equal to, or less than, a desired x value, given the mean and standard deviation of a […]
Management Chapter 7 Homework Space scope Inc Reliability Cumulative Failure Probability Exponential
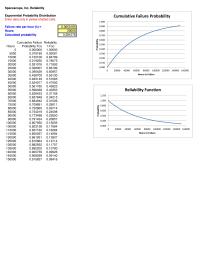
Spacescope, Inc. Reliability Exponential Probability Distribution Enter data only in yellow-shaded cells. Failure rate per hour (λ) = 0.0000165 35000 0.438700 0.56130 40000 0.483149 0.51685 45000 0.524077 0.47592 50000 0.561765 0.43823 55000 0.596468 0.40353 60000 0.628423 0.37158 Hours to Failure […]
Management Chapter 7 Homework Problem 710 Instructor Reserve Lapstrake Battery Co
Problem 7-10 Instructor Reserve Lapstrake Battery Co. – Reliability Enter data only in the shaded cells This spreadsheet is designed to calculate the probability of values equal to, or less than, a desired x value, given the mean and standard […]
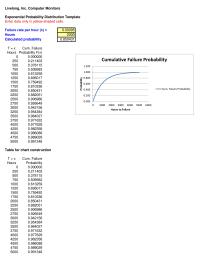
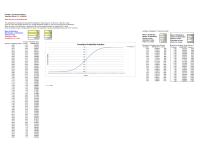
Management Chapter 7 Homework Cumulative Failure Probability 1.200
Livelong, Inc. Computer Monitors Exponential Probability Distribution Template Enter data only in yellow-shaded cells. Failure rate per hour (λ) = 0.00095 T = x Cum. Failure Hours Probability F(x) 1500 0.759492 1750 0.810336 2000 0.850431 2250 0.882051 2500 0.906986 0.200 […]
Management Chapter 7 Homework Seek to integrate social responsibility activities with quality assurance systems
Broadtred Tire Co. Enter data only in the shaded cells This spreadsheet is designed to calculate the probability of values equal to, or less than, a desired x value, given the mean and standard deviation of a normally distributed variable. […]
Management Chapter 7 Homework Variance 00001 Kurtosis 03305 Skewness 01392 Range
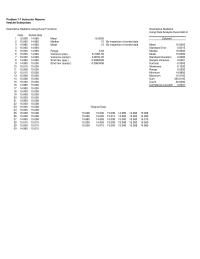
Problem 7-7 Instructor Reserve HeetJet Enterprises Descriptive Statistics Using Excel Functions Descriptive Statistics Using Data Analysis Excel Add-In Data Sorted data 1 15.008 14.985 Mean 15.0005 Column1 2 15.000 14.985 Median 15 By inspection of sorted data 8 14.993 14.993 […]
Management Chapter 7 Homework This spreadsheet is designed to calculate the X-value based
Cellurific Battery Life-Reliability X-value Calculations Given Probabilities Using the Inverse Normal Distribution This spreadsheet is designed to calculate the X-value based on probability of values equal to, or less than a desired x value, of a normally distributed variable. It […]
Management Chapter 7 Homework Descriptive Statistics Original Data Sorted Data
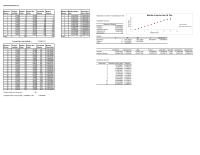
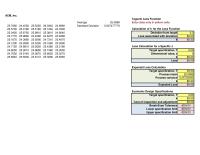
Problem 7-06 Instructor Reserve Microfarmosutica, Inc. Descriptive Statistics Original Data Sorted Data 2.483 2.477 Mean 2.4906 Descriptive Statistics 2.482 2.478 Median 15 By inspection of sorted data 2.494 2.482 Mode 15 By inspection of sorted data Mean 2.490559091 2.490 2.482 […]
Management Chapter 7 Homework Specific Target Specification Dimensional Value Loss
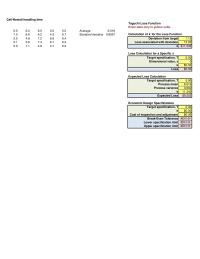
Call-Nowait handling time Taguchi Loss Function Enter data only in yellow cells. 6.5 6.0 6.5 5.0 5.5 Average 6.016 7.3 6.6 6.2 4.3 6.7 Standard deviation 0.8957 Calculation of k for the Loss Function 5.5 4.8 7.2 6.9 6.4 Deviation […]
Management Chapter 7 Homework Everyone needs encouragement when performing a difficult task
Problem 7-05 Instructor Reserve Oomworks Taguchi Loss Function Enter data only in yellow cells. Calculation of k for the Loss Function Deviation from target 0.80 Loss Calculation for a Specific x Target specification, T 0.00 Dimensional value, x 0 k$0.00 […]
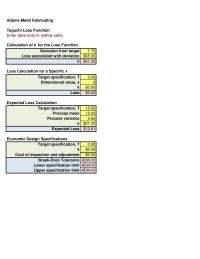
Management Chapter 7 Homework Break-Even Tolerance
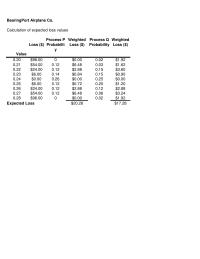
BearingPort Airplane Co. Calculation of expected loss values Value Loss ($) Process P Probabilit y Weighted Loss ($) Process Q Probability Weighted Loss ($) 0.20 $96.00 0 $0.00 0.02 $1.92 0.21 $54.00 0.12 $6.48 0.03 $1.62 0.22 $24.00 0.12 $2.88 […]
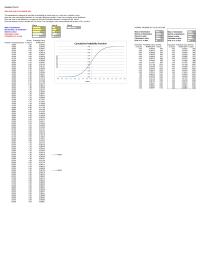
Management Chapter 7 Homework Exponential Reliability Failure rate
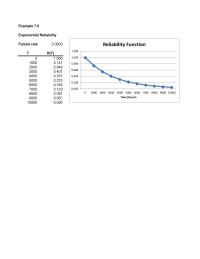
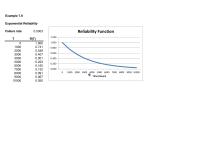
Example 7.9 Exponential Reliability Failure rat e 0.0003 TR(T) 0 1.000 1000 0.741 0.800 1.000 1.200 ReliabilityFunction 2000 0.549 3000 0.407 4000 0.301 5000 0.223 6000 0.165 7000 0.122 8000 0.091 9000 0.067 10000 0.050 0.000 0.200 0.400 0.600 0 […]
Management Chapter 7 Homework This action by the geese shows concern for others
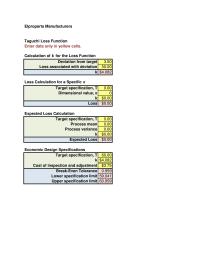
Elproparts Manufacturers Taguchi Loss Function Enter data only in yellow cells. Calculation of k for the Loss Function Deviation from target 3.50 Loss Calculation for a Specific x Target specification, T 0.00 Dimensional value, x 0 k$0.00 Loss $0.00 Expected […]
Management Chapter 7 Homework Loss Calculation for a Specific x
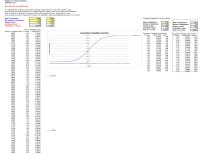
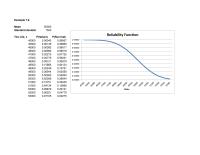
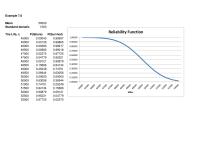
Example 7.8 Mean 50000 Standard deviation 51500 0.84134 0.15866 52000 0.90879 0.09121 52500 0.95221 0.04779 53000 0.97725 0.02275 Miles 1500 Tire Life, x P(failure) P(Survival) 45000 0.00043 0.99957 45500 0.00135 0.99865 46000 0.00383 0.99617 48500 0.15866 0.84134 49000 0.25249 0.74751 […]
Management Chapter 7 Homework Nominal Dimension 047
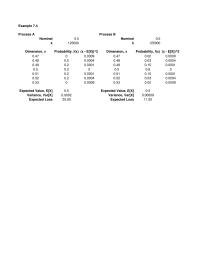
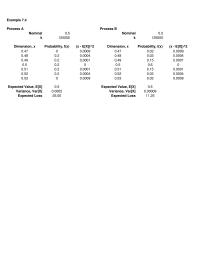
Variance, Var[X] 0.0002 Variance, Var[X] 0.00009 Expected Loss 25.00 Expected Loss 11.25 Example 7.4 Process A Process B Nominal 0.5 Nominal 0.5 k125000 k125000 Dimension, x Probability, f(x) (x – E[X])^2 Dimension, x Probability, f(x) (x – E[X])^2 0.47 0 […]
Management Chapter 7 Homework Specific Target Specification Dimensional Value Loss
MicroKeeb Co. Taguchi Loss Function 2.001 2.000 2.001 1.998 1.999 Average 2.00008 Enter data only in yellow cells. 2.000 2.000 2.002 1.999 2.000 Standard Deviation 0.00104 1.998 1.999 2.001 2.000 2.000 Calculation of k for the Loss Function Loss Calculation […]
Management Chapter 7 Homework Loss Associated With Deviation
ACM, Inc. Taguchi Loss Function Average 25.0988 Enter data only in yellow cells. 25.7660 24.4550 25.5250 26.0340 24.6960 Standard Deviation 0.507477779 23.5730 25.0160 25.5160 25.1240 24.7830 Calculation of k for the Loss Function 25.0420 25.8750 25.8910 25.3810 24.6040 Deviation from […]
Management Chapter 7 Homework The most powerful leaders are the ones that are not
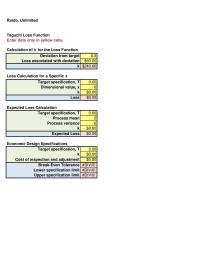
Ruido, Unlimited Taguchi Loss Function Enter data only in yellow cells. Calculation of k for the Loss Function Deviation from target 0.5 Loss Calculation for a Specific x Dimensional value, x 0 k$0.00 Loss $0.00 Target specification, T 0.00 Expected […]
Management Chapter 7 Homework Economic Design Specifications Target specification
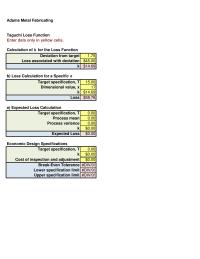
Adams Metal Fabricating Taguchi Loss Function Enter data only in yellow cells. Calculation of k for the Loss Function Deviation from target 1.75 b) Loss Calculation for a Specific x Dimensional value, x 17 k$14.69 Loss $58.76 Target specification, T […]
Management Chapter 7 Homework Expected Loss Calculation Target Specification 1500 Process
Adams Metal Fabricating Taguchi Loss Function Enter data only in yellow cells. Calculation of k for the Loss Function Deviation from target 1.75 Loss Calculation for a Specific x Target specification, T 0.00 Dimensional value, x 0 k$0.00 Loss $0.00 […]
Management Chapter 7 Homework Cost of inspection and adjustment
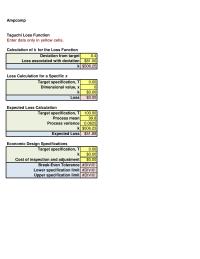
Ampcomp Taguchi Loss Function Enter data only in yellow cells. Calculation of k for the Loss Function Deviation from target 0.4 Loss Calculation for a Specific x Dimensional value, x 0 k$0.00 Loss $0.00 Target specification, T 0.00 Expected Loss […]
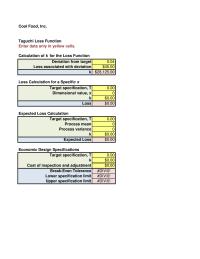
Management Chapter 7 Homework Expected Loss Calculation Target Specification Process Mean
Cool Food, Inc. Taguchi Loss Function Enter data only in yellow cells. Calculation of k for the Loss Function Deviation from target 0.04 Loss Calculation for a Specific x Target specification, T 0.00 Dimensional value, x 0 k$0.00 Loss $0.00 […]
Management Chapter 7 Homework Attribute Georgios Moistness Flavor Healthy Food
Georgio’s Giant Gyros Competitors’ Product Information Company Price Size (oz.) Calories * Sodium (mg) * Fat (%) * Georgio’s 3.00 5.5 440 875 13 Kingyro 4.25 7.5 640 930 23 Per ounce comparision Company Price/Oz. Calories/Oz.* Sodium/Oz.* Kingyro $0.567 85.3 […]
Management Chapter 7 Homework Level 2 High Gold High Temperature Response
Example 7.9 Exponential Reliability Failure rate 0.0003 T R(T) 0 1.000 1000 0.741 2000 0.549 3000 0.407 4000 0.301 0.400 0.600 0.800 1.000 1.200 Reliability Function 5000 0.223 6000 0.165 7000 0.122 8000 0.091 9000 0.067 10000 0.050 0.000 0.200 […]
Management Chapter 7 Homework Distribution mean Calculated probability
Example 7.8 Mean 50000 Standard deviation 1500 Tire Life, x P(failure) P(Survival) 45000 0.00043 0.99957 45500 0.00135 0.99865 46000 0.00383 0.99617 46500 0.00982 0.99018 47000 0.02275 0.97725 47500 0.04779 0.95221 48000 0.09121 0.90879 0.50000 0.60000 0.70000 0.80000 0.90000 1.00000 Reliability […]
Management Chapter 7 Homework Process A Process B Nominal
Example 7.4 Process A Process B Nominal 0.5 Nominal 0.5 k125000 k125000 Dimension, x Probability, f(x) (x – E[X])^2 Dimension, x Probability, f(x) (x – E[X])^2 0.47 0 0.0009 0.47 0.02 0.0009 0.48 0.2 0.0004 0.48 0.03 0.0004 0.49 0.2 […]
![Management Chapter 7 Homework Expected Value, E[X] Variance, Var[X] Expected Loss](https://preview.coursepaper.com/686401/686401-200.jpg)
Management Chapter 7 Homework Expected Value, E[X] Variance, Var[X] Expected Loss
Variance, Var[X] 0.0002 Variance, Var[X] 0.00009 Expected Loss 25.00 Expected Loss 11.25 Example 7.3 Process A Process B Nominal 0.5 Nominal 0.5 k125000 k125000 Dimension, x Probability, f(x) (x – E[X])^2 Dimension, x Probability, f(x) (x – E[X])^2 0.47 0 […]
Management Chapter 6 Homework Check the Probability vs. the x value
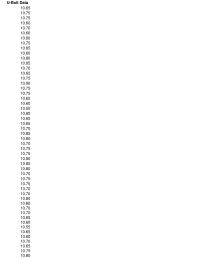
10.80 10.70 10.70 10.65 10.60 10.55 U-Bolt Data 10.65 10.75 10.75 10.60 10.70 10.60 10.70 10.65 10.75 10.90 10.75 10.75 10.65 10.60 10.50 10.80 10.65 10.65 10.70 10.85 10.80 10.70 10.75 10.75 10.80 10.80 10.80 10.70 10.75 10.75 10.70 10.70 […]
Management Chapter 6 Homework Stay curious and respectful about local
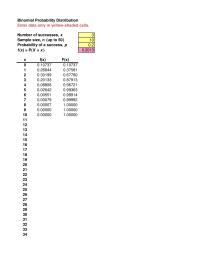
Binomial Probability Distribution Enter data only in yellow-shaded cells. Number of successes, x3 Sample size, n (up to 50) 10 50.02642 0.99363 60.00551 0.99914 70.00079 0.99992 80.00007 1.00000 90.00000 1.00000 10 0.00000 1.00000 11 12 00.10737 0.10737 10.26844 0.37581 20.30199 […]
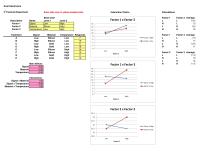
Management Chapter 6 Homework Factor High Factor Low High Factor
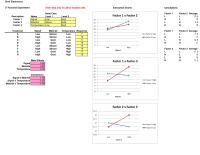
Sival Electronics 23 Factorial Experiment Enter data only in yellow-shaded cells. Interaction Charts Calculations Base Case Factor 1 Factor 2 Average Description Name Level 1 Level 2 L L 10.5 Factor 1 Signal Low High H L 13 Treatment Signal […]
Management Chapter 6 Homework Enable innovation to flourish and create
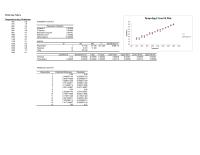
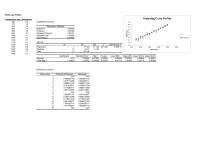
White Clay Pottery Temperature-deg C Temp-deg C 0.00826 0.00052 15.84992 0.00000 0.00713 0.00938 0.00713 0.00938 6 4.114285714 0.585714286 7 4.527142857 -0.427142857 8 4.94 0.06 9 5.352857143 0.347142857 10 5.765714286 -0.665714286 11 6.178571429 -0.178571429 12 6.591428571 0.008571429 13 7.004285714 -0.204285714 14 […]
Management Chapter 6 Homework Proactively seek opportunities for improving system robustness
Sival Electronics 23 Factorial Experiment Enter data only in yellow-shaded cells. Interaction Charts Calculations Base Case Factor 1 Factor 2 Average Description Name Level 1 Level 2 L L 10.5 Factor 1 Signal Low High H L 13 Treatment Signal […]
Management Chapter 6 Homework High Main Effects Factor Low
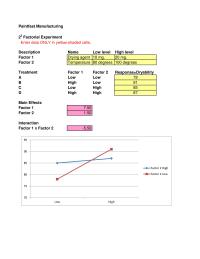
Paintfast Manufacturing 22 Factorial Experiment Enter data ONLY in yellow-shaded cells. CLow High 85 D High High 87 Factor 2 1.50 Interaction Factor 1 x Factor 2 -5.50 Description Name Low level High level Factor 1 Drying agent 10 mg. […]
Management Chapter 6 Homework Temperature-deg Brittleness
White Clay Pottery Temperature-deg C Brittleness 700 2.5 SUMMARY OUTPUT 750 1.9 800 3.4 Regression Statistics 850 2.7 Multiple R 0.97509 900 3.8 R Square 0.95080 1400 8.1 Coefficients Standard Error t Stat P-value Lower 95% Upper 95% Lower 95.0% […]
Management Chapter 6 Homework Act as a role model for public responsibility and actions
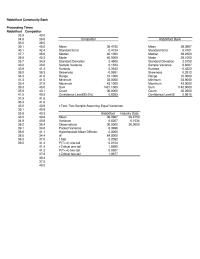
Rabbitfoot Community Bank Processing Times Rabbitfoot Competitor 33.9 40.0 34.8 39.6 Rabbitfoot Bank 35.0 38.5 39.1 40.0 Mean 39.4750 Mean 38.0967 40.1 42.4 Standard Error 0.4134 Standard Error 0.4701 37.7 38.6 Median 40.1000 Median 38.2500 39.0 42.3 Mode 40.0000 Mode […]
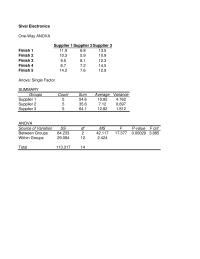
Management Chapter 6 Homework Count Sum 546 356 641 Anova Source
Sival Electronics One-Way ANOVA Supplier 1 Supplier 2 Supplier 2 5 35.6 7.12 0.697 Supplier 3 5 64.1 12.82 1.812 Within Groups 29.084 12 2.424 Total 113.317 14 Supplier 3 Finish 1 11.9 6.8 13.5 Finish 2 10.3 5.9 10.9 […]