Archives: Solution Manual
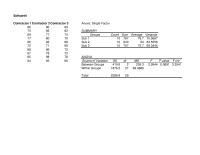
Management Chapter 6 Homework Sub Count Sum Average 767
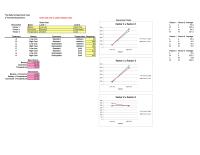
Softswell Contractor 1 Contractor 2 Within Groups 1876.2 27 69.4889 Total 2286.8 29 Contractor 3 Anova: Single Factor 86 90 89 73 85 82 SUMMARY 69 77 74 Groups Count Sum Average Variance 67 78 72 65 98 78 ANOVA […]
Management Chapter 6 Homework Competitor Mean Standard Error Median Mode Standard
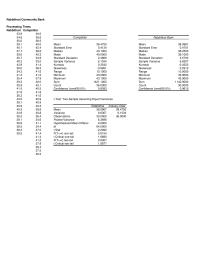
Rabbitfoot Community Bank Processing Times Rabbitfoot Competitor 36.6 41.1 Hypothesized Mean Difference 0.0000 38.5 34.4 df 64.0000 38.3 37.0 t Stat -2.2092 39.5 41.4 P(T<=t) one-tail 0.0154 41.4 t Critical one-tail 1.6690 41.2 P(T<=t) two-tail 0.0307 37.8 t Critical two-tail […]
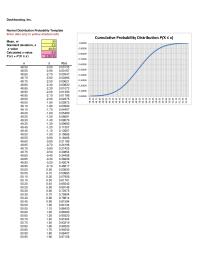
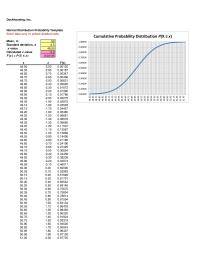
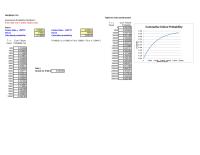
Management Chapter 6 Homework Cumulative Probability Distribution P(X ≤ x)
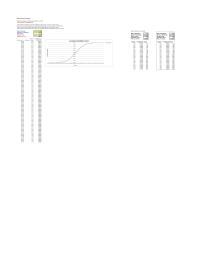
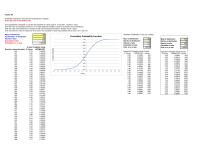
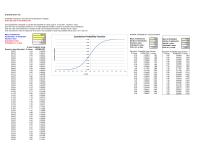
Dockhousing, Inc. Normal Distribution Probability Template Enter data only in yellow-shaded cells Mean, m50 Standard deviation, s0.5 x z F(x) 48.90 -2.20 0.01390 48.95 -2.10 0.01786 49.00 -2.00 0.02275 49.05 -1.90 0.02872 49.10 -1.80 0.03593 49.15 -1.70 0.04457 49.20 -1.60 […]
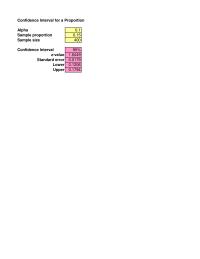
Management Chapter 6 Homework Standard Error Lower Upper
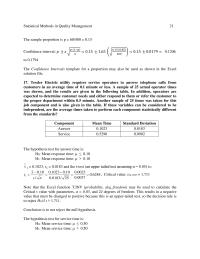
Standard error 0.0179 Lower 0.1206 Upper 0.1794 Confidence Interval for a Proportion Alpha 0.1 Sample proportion 0.15 Confidence Interval 90% z-value 1.6449 Sample size 400
Management Chapter 6 Homework Drive environmental, social, and economic betterment
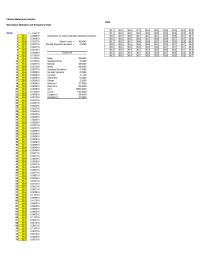
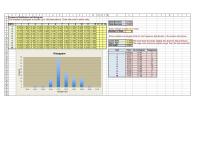
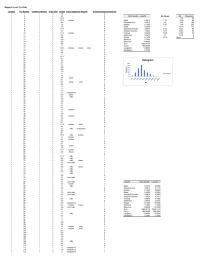
Filmore Metal-work foundry Data Descriptive Statistics and Frequency Chart 38.1 38.5 38.3 37.3 38.4 39.2 38.9 38.5 39.0 38.6 DATA (x – x-bar)^2 38.1 38.8 38.6 38.6 38.6 38.6 38.9 38.8 39.0 38.6 138.1 0.306916 Calculation of mean & Sample […]
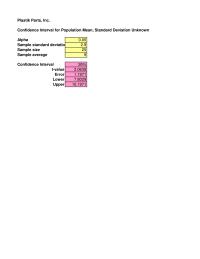
Management Chapter 6 Homework Parts Inc Confidence Interval For Population Mean
Plastik Parts, Inc. Confidence Interval for Population Mean, Standard Deviation Unknown Alpha 0.05 Sample standard deviation Sample size 25 Sample average 9 2.9 Confidence Interval 95% t-value 2.0639 Error 1.1971 Lower 7.8029 Upper 10.1971 Plastik Parts, Inc. Confidence Interval for […]
Management Chapter 6 Homework Require organizational integrity.
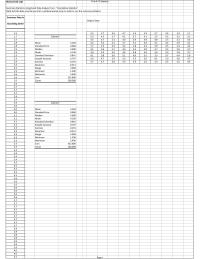
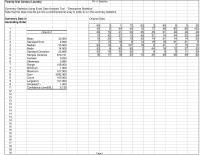
Prob 6-12 Statistics Rivercereek Labs Summary Statistics Using Excel Data Analysis Tool – “Descriptive Statistics” Note that the data must be put into a unidimensional array in order to run the summary statistics Summary Data in Original Data Ascending Order […]
Management Chapter 6 Homework Dock housing Inc Normal Distribution Probability Template Enter
Dockhousing, Inc. Normal Distribution Probability Template Enter data only in yellow-shaded cells Mean, m50 Standard deviation, s0.5 x z F(x) 48.75 -2.50 0.00621 48.80 -2.40 0.00820 48.85 -2.30 0.01072 48.90 -2.20 0.01390 48.95 -2.10 0.01786 49.00 -2.00 0.02275 49.05 -1.90 […]
Management Chapter 6 Homework Going alone to reach a goal is possible, but generally
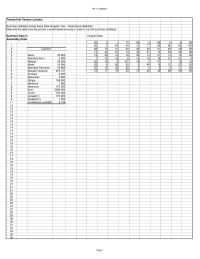
P6-11 Statistics Twenty-first Century Laundry Summary Statistics Using Excel Data Analysis Tool – “Descriptive Statistics” Note that the data must be put into a unidimensional array in order to run the summary statistics Summary Data in Original Data Ascending Order […]
Management Chapter 6 Homework Calculation Mean Amp Sample Standard Deviation Mean
17 38.6 0.002916 Range 2.3000 18 38.6 0.002916 Minimum 37.3000 19 38.6 0.002916 Maximum 39.6000 20 38.6 0.002916 Sum 3865.4000 21 38.3 0.125316 Count 100.0000 22 38.6 0.002916 Largest(1) 39.6000 23 38.8 0.021316 Smallest(1) 37.3000 43 38.7 0.002116 44 38.7 […]
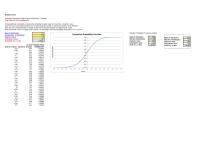
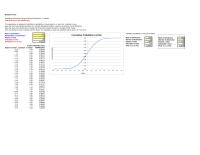
Management Chapter 6 Homework Exponential Probability Distribution
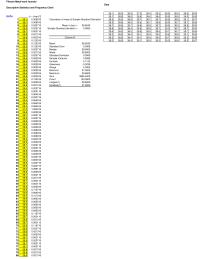
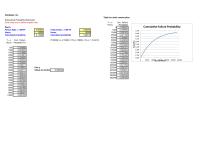
Genjeteye, Inc. Table for chart construction Exponential Probability Distribution Enter data only in yellow-shaded cells. T = x Cum. Failure Hours Probability Part b 00.000000 Hours Probability F(x) 4000 0.039211 205000 0.871265 4500 0.044003 Part c 220000 0.889197 5000 0.048771 […]
Management Chapter 6 Homework Prob 612 Statistics Page Prob 612 Histogram
Prob 6-12 Statistics Rivercereek Labs Summary Statistics Using Excel Data Analysis Tool – “Descriptive Statistics” Note that the data must be put into a unidimensional array in order to run the summary statistics Summary Data in Original Data Ascending Order […]
Management Chapter 6 Homework Twenty first Century Laundry P611 Statistics Summary Statistics
P6-11 Statistics Twenty-first Century Laundry Summary Statistics Using Excel Data Analysis Tool – “Descriptive Statistics” Note that the data must be put into a unidimensional array in order to run the summary statistics Summary Data in Original Data Ascending Order […]
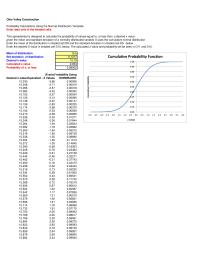
Management Chapter 6 Homework Ohio Valley Construction Probability Calculations Using The
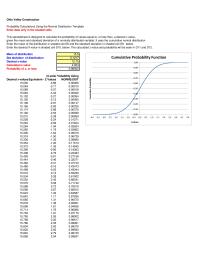
Ohio Valley Construction Probability Calculations Using the Normal Distribution Template Enter data only in the shaded cells This spreadsheet is designed to calculate the probability of values equal to, or less than, a desired x value, given the mean and […]
Management Chapter 6 Homework Part Check For 51293 Cum Failure
Genjeteye, Inc. Table for chart construction Exponential Probability Distribution Enter data only in yellow-shaded cells. T = x Cum. Failure Hours Probability Part b 0 0.000000 40000 0.329680 T = x Cum. Failure P(10000 ≤ x ≤ 15000) = P(x […]
Management Chapter 6 Homework Enter the desired X-value in shaded cell D10
Problem 6-8 Piedra Cretebuilders Probability Calculations Using the Normal Distribution – Template Enter data only in the shaded cells This spreadsheet is designed to calculate the probability of values equal to, or less than, a desired x value, given the […]
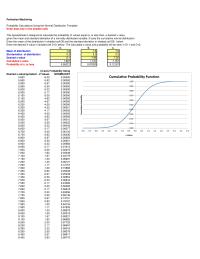
Management Chapter 6 Homework Perfection Machining Probability Calculations Using The Normal
Perfection Machining Probability Calculations Using the Normal Distribution Template Enter data only in the shaded cells This spreadsheet is designed to calculate the probability of values equal to, or less than, a desired x value, given the mean and standard […]
Management Chapter 6 Homework When one gets sick or wounded or shot down
Ohio Valley Construction Probability Calculations Using the Normal Distribution Template Enter data only in the shaded cells This spreadsheet is designed to calculate the probability of values equal to, or less than, a desired x value, given the mean and […]
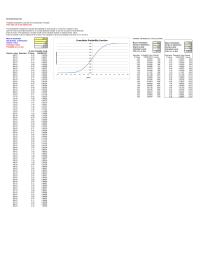
Management Chapter 6 Homework Grande Green Tea Probability Calculations Using The
El Grande Green Tea Probability Calculations Using the Normal Distribution Template Enter data only in the shaded cells This spreadsheet is designed to calculate the probability of values equal to, or less than, a desired x value, given the mean […]
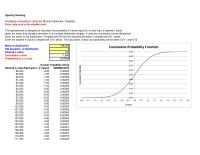
Management Chapter 6 Homework Sparkly Cleaning Probability Calculations Using The Normal
Sparkly Cleaning Probability Calculations Using the Normal Distribution Template Enter data only in the shaded cells This spreadsheet is designed to calculate the probability of values equal to, or less than, a desired x value, given the mean and standard […]
Management Chapter 6 Homework Rainbow Punch Probability Calculations Using The Normal
Rainbow Punch Probability Calculations Using the Normal Distribution – Template Enter data only in the shaded cells This spreadsheet is designed to calculate the probability of values equal to, or less than, a desired x value, given the mean and […]
Management Chapter 6 Homework Define and drive the organization to exceed
Frackly Oil Probability Calculations Using the Normal Distribution Template Enter data only in the shaded cells This spreadsheet is designed to calculate the probability of values equal to, or less than, a desired x value, given the mean and standard […]
Management Chapter 6 Homework Equivalent Probability Using Desired Values Normdist Values
El Grande Green Tea Probability Calculations Using the Normal Distribution Template Enter data only in the shaded cells This spreadsheet is designed to calculate the probability of values equal to, or less than, a desired x value, given the mean […]
Management Chapter 6 Homework We discussed the importance of social responsibility
Rainbow Punch Probability Calculations Using the Normal Distribution – Template Enter data only in the shaded cells This spreadsheet is designed to calculate the probability of values equal to, or less than, a desired x value, given the mean and […]
Management Chapter 6 Homework Analyze the data on burrito weights using descriptive statistical
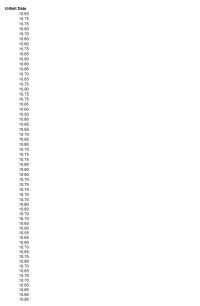
10.70 10.75 10.75 10.80 10.80 10.80 U-Bolt Data 10.65 10.75 10.75 10.60 10.70 10.60 10.70 10.65 10.75 10.90 10.75 10.75 10.65 10.60 10.50 10.80 10.65 10.65 10.70 10.85 10.80 10.70 10.75 10.75 10.70 10.70 10.80 10.80 10.70 10.70 10.65 10.60 […]
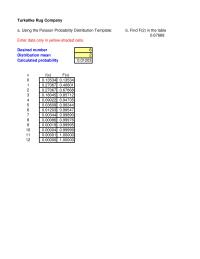
Management Chapter 6 Homework Using the Poisson Probability Distribution Template
Turkalike Rug Company a. Using the Poisson Probability Distribution Template: b. Find F(2) in the table 0.67668 Enter data only in yellow-shaded cells. Desired number 6 4 0.09022 0.94735 5 0.03609 0.98344 6 0.01203 0.99547 7 0.00344 0.99890 8 0.00086 […]
Management Chapter 6 Homework Enter data only in yellow-shaded cells.
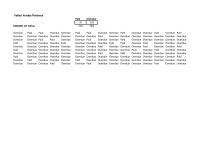
Valles Verdes Partners Paid Overdue 32 118 PERCENT OF TOTAL 21% 79% Overdue Paid Paid Overdue Overdue Paid Paid Overdue Overdue Paid Overdue Overdue Paid Overdue Paid Overdue Overdue Overdue Overdue Overdue Overdue Overdue Paid Overdue Overdue Overdue Overdue Overdue […]
Management Chapter 6 Homework Quality Management Frequency Histogram 300
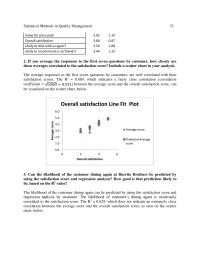
Statistical Methods in Quality Management 32 Value for price paid 3.92 1.19 Overall satisfaction 3.80 0.87 2. If you average the responses to the first seven questions by customer, how closely are those averages correlated to the satisfaction score? Include […]
Management Chapter 6 Homework Lower Limit 10450 The Lower Limit Should
1 2 3 4 5 6 7 8 15 16 17 18 19 20 21 22 23 24 25 26 27 28 29 30 31 32 710.83 10.89 14 810.89 10.95 2 910.95 11.01 0 10 11.01 11.08 0 0 […]
Management Chapter 6 Homework Tessler Electric utility requires service operators to answer
Statistical Methods in Quality Management 21 The sample proportion is p = 60/400 = 0.15 17. Tessler Electric utility requires service operators to answer telephone calls from customers in an average time of 0.1 minute or less. A sample of […]
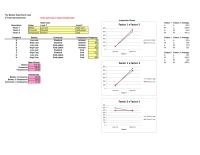
Management Chapter 6 Homework Low High Main Effects Factor
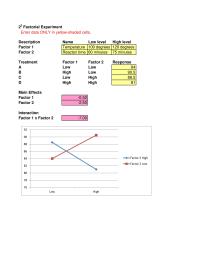
22 Factorial Experiment Enter data ONLY in yellow-shaded cells. Factor 2 -2.50 Description Name Low level High level Factor 1 Temperature 100 degrees 120 degrees Main Effects Factor 1 -0.50 Interaction Factor 1 x Factor 2 -7.00 80 82 84 […]
Management Chapter 6 Homework Describe Factorial Experiment Provide Some Examples Factorial
Statistical Methods in Quality Management 1 CHAPTER 6 Statistical Methods in Quality Management Teaching Notes This chapter describes concepts of statistics, statistical thinking, statistical methodology, sampling, experimental design, and process capability. Students should be encouraged to take a big picture […]
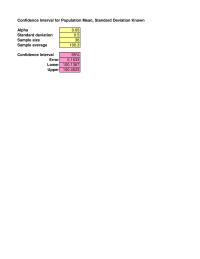
Management Chapter 6 Homework Confidence Interval Value Error Lower Upper 005
Confidence Interval for Population Mean, Standard Deviation Known Alpha 0.05 Standard deviation 0.5 Sample size 36 Sample average 100.3 Confidence Interval 95% Error 0.1633 Lower 100.1367 Upper 100.4633 Confidence Interval for Population Mean, Standard Deviation Unknown Alpha 0.05 Sample standard […]
Management Chapter 6 Homework Consider the following social responsibility principles
The Battery Experiment Case 23 Factorial Experiment Enter data only in yellow-shaded cells. Interaction Charts Base Case Factor 1 Factor 2 Average Description Name Level 1 Level 2 L L 82.5 Factor 1 Battery Low cost High Cost H L […]
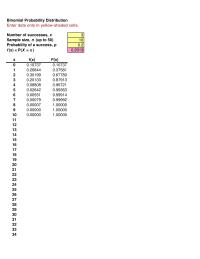
Management Chapter 6 Homework Binomial Probability Distribution
Binomial Probability Distribution Enter data only in yellow-shaded cells. Number of successes, x3 Sample size, n (up to 50) 10 Probability of a success, p0.2 f(x) = P(X = x)0.2013 x f(x) F(x) 00.10737 0.10737 10.26844 0.37581 20.30199 0.67780 30.20133 […]
Management Chapter 6 Homework Location Fry Number Container Number Order Size Length Visual Inspection Results
2571 7 L 7.3 burnt skin 1 2572 7 L 8.1 wilty 1 2573 7 L 7.2 0 2574 7 L 5.9 brown 1 2575 7 L 6.5 0 2576 7 L 1.9 transparent 1 2577 8 M 3.6 piece […]
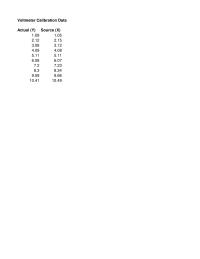
Management Chapter 6 Homework Intercept Source X Source X Line Fit
Voltmeter Calibration Data Actual (Y) Source (X) 1.09 1.05 2.12 2.15 3.08 3.12 4.09 4.08 5.11 5.11 6.08 6.07 7.2 7.23 8.3 8.34 9.59 9.66 10.41 10.49 Total 9 90.34321 Coefficients Standard Error t Stat P-value Lower 95% Upper 95% […]
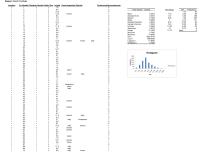
Management Chapter 6 Homework Maggie’s French Fry Study Fry Number container Number order
Maggie’s French Fry Study Location Fry Number Container Number Order Size Length Visual Inspection Results Conforming/Nonconforming 1 1 1 L 7.6 0 1 2 1 L 6.4 0 Total Sample – Lengths Bin Range Bin Frequency 1 3 1 L […]
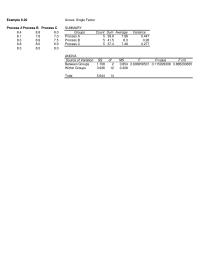
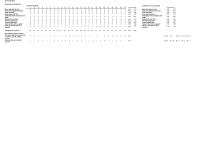
Management Chapter 6 Homework Variation Between Groups Within Groups 1708
Example 6.20 Anova: Single Factor Process A Process B Process C SUMMARY Within Groups 3.936 12 0.328 Total 5.644 14 8.4 8.8 8.0 Groups Count Sum Average Variance 8.3 8.0 8.0 ANOVA Source of Variation SS df MS F P-value […]
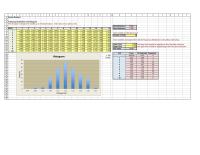
Management Chapter 6 Homework Enter smallest and largest limits for the frequency distribution
1 2 3 4 5 6 7 8 9 10 11 17 18 19 20 21 22 23 24 25 26 27 28 29 30 31 32 33 34 35 36 81.16 1.19 15 91.19 1.22 2 10 1.22 1.25 […]
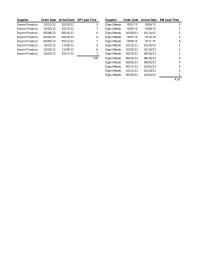
Management Chapter 6 Homework Metals Elgin Metals Elgin Metals Elgin Metals
Supplier Order Date Arrival Date BP Lead Time Supplier Order Date Arrival Date EM Lead Time Bryant Products 10/15/12 10/20/12 5 Elgin Metals 10/01/12 10/06/12 5 Bryant Products 10/20/12 10/27/12 7 Elgin Metals 10/03/12 10/08/12 5 Bryant Products 08/08/12 08/14/12 […]
Management Chapter 6 Homework Residuals Likely to dine with us again?
Burrito Brothers Customer survey Results Customer Number Customer survey responses 1 2 3 4 5 6 7 8 9 10 11 12 13 14 15 16 17 18 19 20 21 22 23 24 25 Avg Std. dev. Avg Std. […]
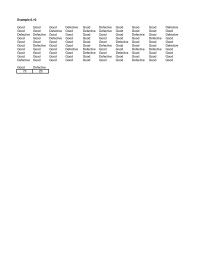
Management Chapter 6 Homework Size Length Visual Inspection Results
Example 6.10 Good Good Good Defective Good Defective Good Good Good Defective Good Good Defective Good Defective Defective Good Good Good Good Defective Defective Good Good Good Good Good Defective Good Defective Good Good Defective Good Good Good Good Good […]
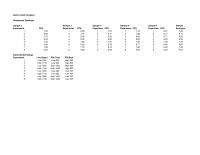
Management Chapter 6 Homework This shows the synergistic value of teamwork
Berton Card Company Roughness Readings Sample 1 Sample 2 Sample 3 Sample 4 Sample 5 Sample Experiment PPS Experiment PPS Experiment PPS Experiment PPS Experiment 5 Low 1000 Low 900 Low 765 6 High 1150 Low 900 Low 765 7 […]
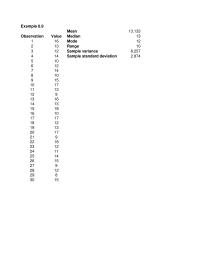
Management Chapter 6 Homework Mean Median Mode Range Sample Variance Sample
213 Range 10 312 Sample variance 8.257 22 18 23 12 24 11 25 14 26 15 27 9 28 12 29 8 30 15 Example 6.9 Mean 13.133 Observation Value Median 13 116 Mode 12 414 Sample standard deviation […]
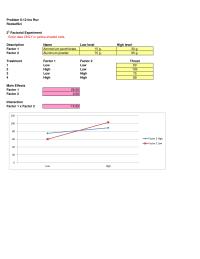
Management Chapter 6 Homework Factor High Level Thrust 103
Problem 6-12 Ins Rsv RocketSci 22 Factorial Experiment Enter data ONLY in yellow-shaded cells. Factor 2 0.50 Interaction Factor 1 x Factor 2 -14.50 Factor 2 Aluminum powder 75 g. 95 g. Description Name Low level High level Factor 1 […]
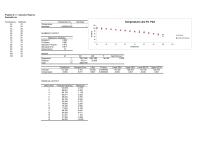
Management Chapter 6 Homework Coefficients 127350 0694 Standard Error
Problem 6-11 – Instructor Reserve Durarubb, Inc Temperature Hardness Temperature vs. Hardness 35 97 Temperature 1 40 94 Hardness -0.938581842 1 100 52 ANOVA 105 42 df SS MS F Significance F Regression 1 3367.289 3367.289 96.185 0.000 Residual 13 […]
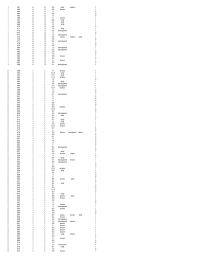
Management Chapter 6 Homework burnt skin transparent piece brown transparent
2489 7 L 9 broken 1 2490 7 L 14.8 wilty 1 2491 7 L 10.7 wilty 1 2492 7 L 11.8 broken 1 2493 7 L 7.2 0 2494 7 L 12 wilty 1 2495 7 L 5.6 transparent […]
Management Chapter 6 Homework Source of Variation Between Groups Within Groups
The Battery Experiment Case 23 Factorial Experiment Enter data only in yellow-shaded cells. Interaction Charts Base Case Factor 1 Factor 2 Average Description Name Level 1 Level 2 L L 82.5 Factor 1 Battery Low cost High Cost H L […]
Management Chapter 6 Homework Maggie’s French Fry Study Fry Number 100
Maggie’s French Fry Study Location Fry Number Container Number Order Size Length Visual Inspection Results Conforming/Nonconforming 1 1 1 L 7.6 0 1 2 1 L 6.4 0 Total Sample – Lengths Bin Range Bin Frequency 1 3 1 L […]