Statistical Methods in Quality Management 21
The sample proportion is p = 60/400 = 0.15
17. Tessler Electric utility requires service operators to answer telephone calls from
customers in an average time of 0.1 minute or less. A sample of 25 actual operator times
was drawn, and the results are given in the following table. In addition, operators are
expected to determine customer needs and either respond to them or refer the customer to
the proper department within 0.5 minute. Another sample of 25 times was taken for this
job component and is also given in the table. If these variables can be considered to be
independent, are the average times taken to perform each component statistically different
from the standards?
Component
Mean Time
Standard Deviation
Answer
0.1023
0.0183
Service
0.5290
0.0902
The hypothesis test for answer time is:
H0: Mean response time: ≤ 0.10
Note that the Excel function T.INV (probability, deg_freedom) may be used to calculate the
Critical t value with parameters, α = 0.05, and 24 degrees of freedom. This results in a negative
Conclusion is to not reject the null hypothesis.
Statistical Methods in Quality Management 22
x
18. A quality manager at Newvis Pharmaceutical Company is monitoring a process that
fills vials with a liquid medication designed to prevent glaucoma in the eyes of the user. The
company wants to ensure that each vial contains at least 60 ml. (2.03 fluid oz.) of the
product. A sample of 40 vials is tested, and a mean of 63 ml. and a sample standard
deviation of 10 ml. are found. The quality manager wishes to test the null hypothesis that
vials contain less than or equal to 60 ml. using an α = 0.05 significance level (rejecting this
hypothesis provides evidence that the vials contain at least the required amount). Conduct
the test and explain your results.
The hypothesis to be tested is:
H0: Mean fill volume ≤ 60
The appropriate test statistic is
𝑡= 𝑥̅− 𝜇
𝑠
√𝑛= 𝑥̅− 60
𝑠
√𝑛= 63−60
10
√40 = 1.8974
Because this is a one-tailed test, the critical value is tn-1, . Using a critical level of significance
of 0.05, t39, α = 1.6849.
19. The quality manager at Olvista Pharmaceutical Company is certifying a new process
that must produce 95 percent (or better) good product before certification can be
completed. A sample of 30 containers from the process line are tested, and 92 percent are
Statistical Methods in Quality Management 23
found to be good. Formulate the appropriate hypotheses and test them using an = 0.05
significance level. Explain your results.
The hypothesis which requires testing is:
H0: Proportion of good product ≥ 95
H1: Proportion of good product < 95
Since the value of the test statistic is -0.754, we cannot reject the null hypothesis and the
manager can conclude that there is no statistical evidence that the population proportion is less
than 95 percent.
20. Rabbitfoot Community Bank makes a large number of home equity loans each year.
The vice president of loan administration wishes to determine if their time for paperwork
processing is lower than the average time of their top competitor. Data for a sample of 30
loans taken at Rabbitfoot Bank are provided in the Ch06Data Excel workbook. Data
obtained from competitor of 36 applications are also provided in the workbook.
a) Use the Excel Descriptive Statistics tool to find the mean and variance of each data set.
b) Test the null hypothesis that his bank’s processing time is greater than or equal to the
competitor’s average, versus the alternative hypothesis that the bank’s time is less than the
competitor at the 5 percent significance level. Use the z-Test: Two Sample Assuming Equal
Variances from the Data Analysis menu in Excel.
See the instructor’s Excel solution file Problem 6.20.
To conduct this hypothesis test for comparing the processing time, select t–test: Two-Sample
Assuming Equal Variances from the Data Analysis menu.
Let 𝜇1= the mean of the Rabbitfoot Bank data and 𝜇2=the mean of the industry data
The hypothesis may be stated as:
𝐻1: 𝜇1− 𝜇2≥0
Statistical Methods in Quality Management 24
𝐻2: 𝜇1− 𝜇2<0
The test results from the Excel Data Analysis menu are as shown in the table, below.
t-Test: Two-Sample Assuming Equal
Variances
Rabbitfoot
Industry Data
Mean
38.0967
39.4750
Variance
6.6307
6.1534
Observations
30.0000
36.0000
Pooled Variance
6.3696
21. Softswell, a software developer, is trying to determine if any of three potential
subcontractors has better programmers in order to outsource a development project. The
three subcontractors agreed to test 5 programmers, using a standardized test provided by
Softswell, as provided in the data in the Ch06Data Excel workbook. Use the single factor
ANOVA Excel tool to determine if there is a significant difference between the scores of
programmers at the three contractors at the 5 percent level.
See the instructor’s Excel solution file Problem 6.21.
The hypothesis test is:
H0: µ1 = µ2 = µ3
The ANOVA results from the Excel Data Analysis menu are as shown below.
Anova: Single Factor
SUMMARY
Groups
Count
Sum
Average
Variance
Hypothesized Mean Difference
0.0000
df
64.0000
t Stat
P(T<=t) one-tail
0.0154
t Critical one-tail
1.6690
P(T<=t) two-tail
0.0307
t Critical two-tail
1.9977

Statistical Methods in Quality Management 25
Sub 1
10
767
76.7
75.5667
Sub 2
10
840
84
63.5556
ANOVA
Source of Variation
SS
df
MS
F
P-value
F crit
Between Groups
410.6
2
205.3
2.9544
0.0691
3.3541
Within Groups
1876.2
27
69.4889
Total
2286.8
29
22. The process engineer at Sival Electronics was trying to determine whether three
suppliers would be equally capable of supplying the mounting boards for the new “gold
plated” components that she was testing. The table found in the worksheet Prob. 6-23 in the
Excel workbook C06Data shows the coded defect levels for the suppliers, according to the
finishes that were tested. Lower defect levels are preferable to higher levels. Using
ANOVA, analyze these results. What conclusion can be reached?
See the instructor’s Excel solution file Problem 6.22.
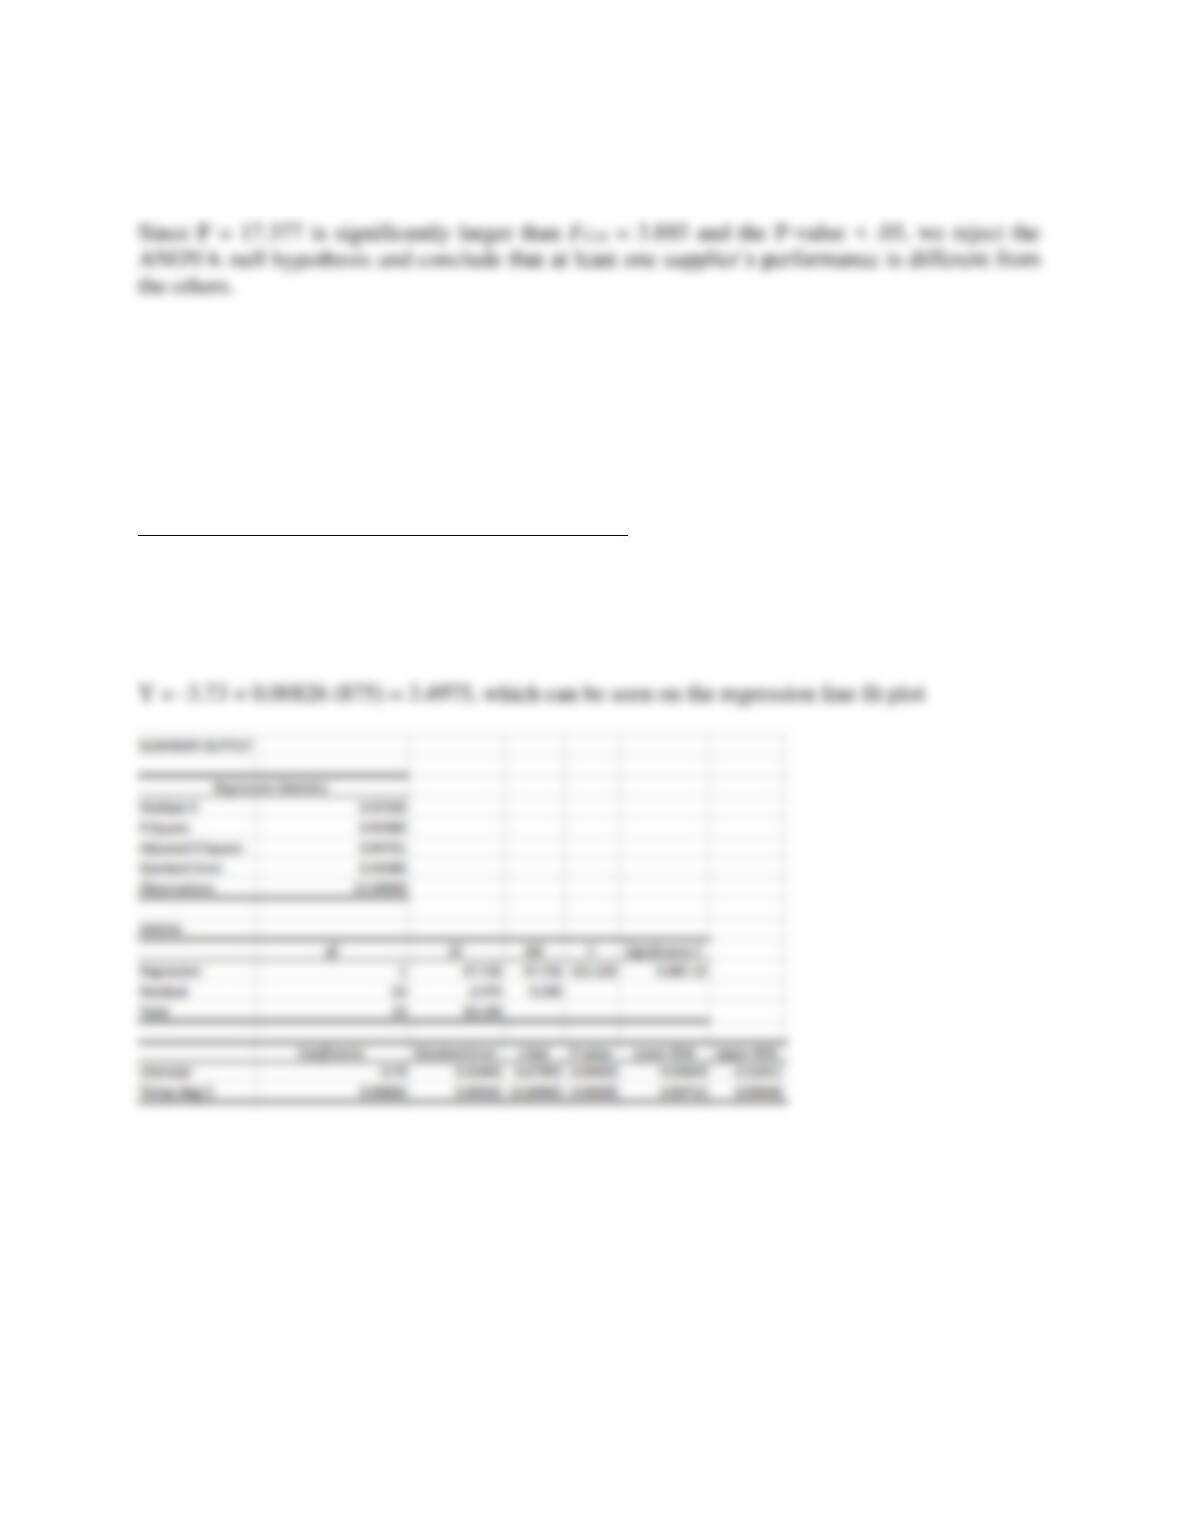
The ANOVA output is shown below.
SUMMARY
Groups
Count
Sum
Average
Variance
Supplier 1
5
54.6
10.92
4.762
Supplier 2
5
35.6
7.12
0.697
Supplier 3
5
64.1
12.82
1.812
ANOVA
Source of Variation
SS
df
MS
F
P-value
F crit
Between Groups
84.233
2
42.117
17.377
0.00029
3.885
Within Groups
29.084
12
2.424
Total
14
Sub 3
10
757
75.7
69.3444
Statistical Methods in Quality Management 26
23. At White Clay Pottery a kiln is used to bake ceramic pottery. The production manager
wishes to determine the relationship between temperature and brittleness, so he takes
measurements of the brittleness of test items versus the temperature of the oven. (See the
data in the Ch06Data Excel workbook.) Use the Excel Regression tool to determine the
regression equation and the R2 value. Explain the output. If the oven is heated to 875°C,
what would you predict that the brittleness measure will be?
See the instructor’s Excel solution file Problem 6.23.
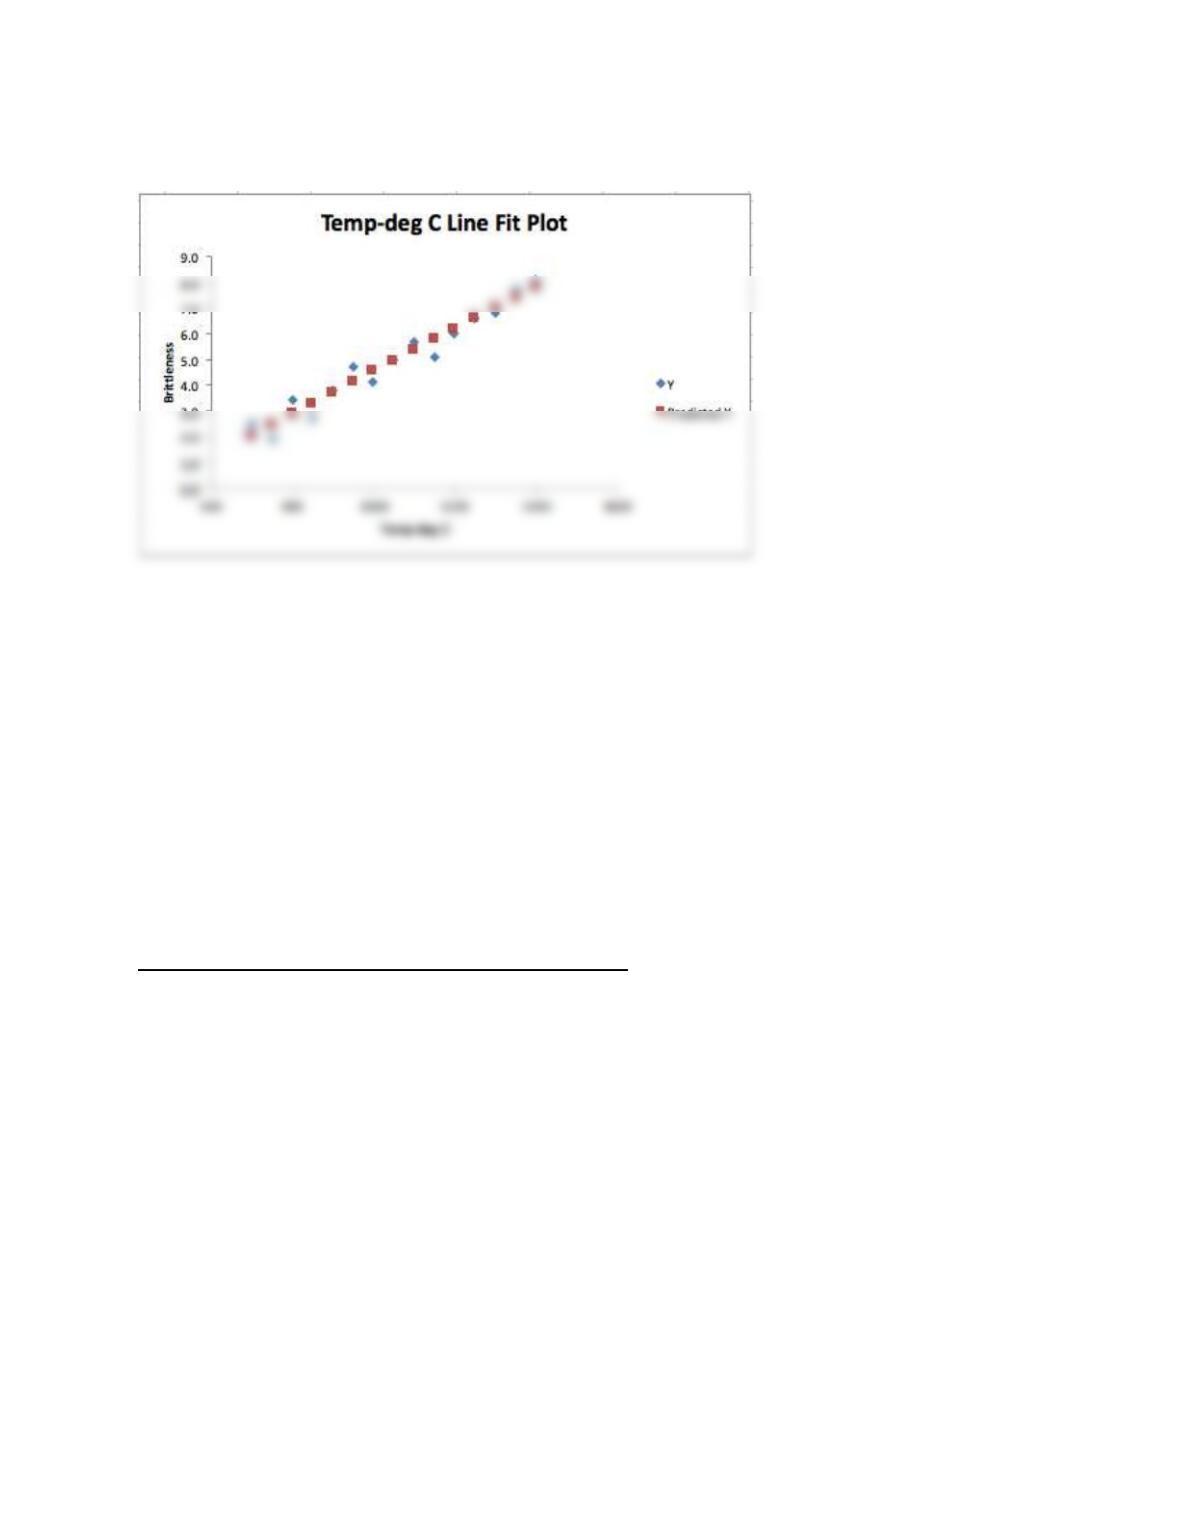
From the output below, we can see that the regression equation is: Y = -3.73 + 0.00826 X, where
X is the independent variable, temperature. The R2 value = 0.95 shows a very good fit. If the
oven is heated to 875 deg. C, we can predict that the brittleness measure will be:
Statistical Methods in Quality Management 27
24. A quality analyst at Paintfast Manufacturing Co. wants to determine if a new paint
formulation, used to paint parts for a customer’s assembly operation will dry fast enough
to meet the customer’s needs. The customer would prefer to obtain a high level of
“dryability” at low temperatures, even if it requires a higher level of drying agent. He
hypothesizes that a high level of drying agent will result in high dryability, high
temperature – alone – will result in a moderately high level of dryability, and low
temperature or a low level of drying agent will result in a low level of dryability. He hopes
that the main and interaction effects with the temperature, which is expensive (because an
oven would need to be used), will be minimal. The data found in the worksheet Prob. 6-24
in the Excel workbook C06Data were gathered in testing all combinations. What
recommendation would you make?
See the instructor’s Excel solution file Problem 6.24.
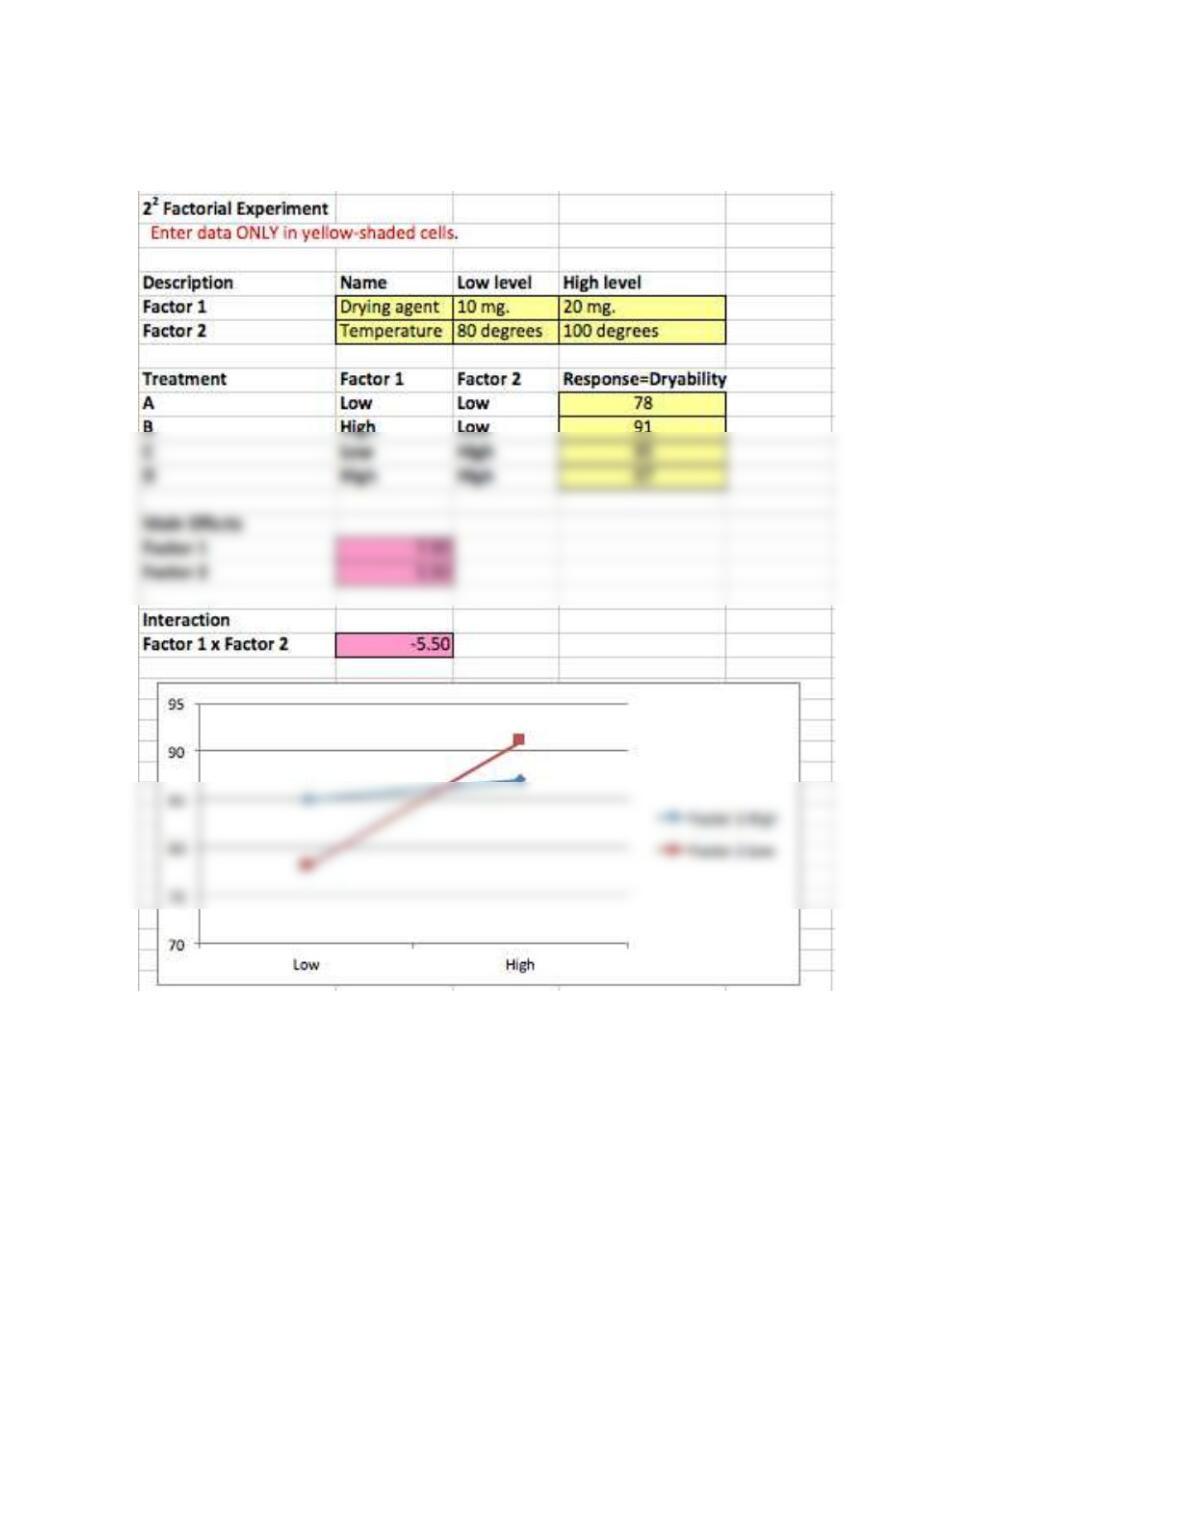
The results using the 22 Factorial Experiment template are shown below. Factor 1 (the drying
agent) has the greatest impact on dryability. This shows that the best results can be obtained by
using a high level of drying agent and a low temperature. However, the interaction effect for the
two factors is moderately strong. The best option is to set the drying agent at the high level and
the temperature at the low level.
Statistical Methods in Quality Management 28
25. The process engineer at Sival Electronics is also trying to determine whether a newer,
more costly design involving a gold alloy in a computer chip is more effective than the
present, less expensive silicon design. She wants to obtain an effective output voltage at
both high and low temperatures, when tested with high and low signal strength. She
hypothesizes that high signal strength will result in higher voltage output, low temperature
will result in higher output, and the gold alloy will result in higher output than the silicon
material. She hopes that the main and interaction effects with the expensive gold will be
minimal. The data found in the worksheet Prob. 6-25 in the Excel workbook C06Data were
gathered in testing of all combinations. What recommendation would you make?

Statistical Methods in Quality Management 29
See the instructor’s Excel solution file Problem 6.25.
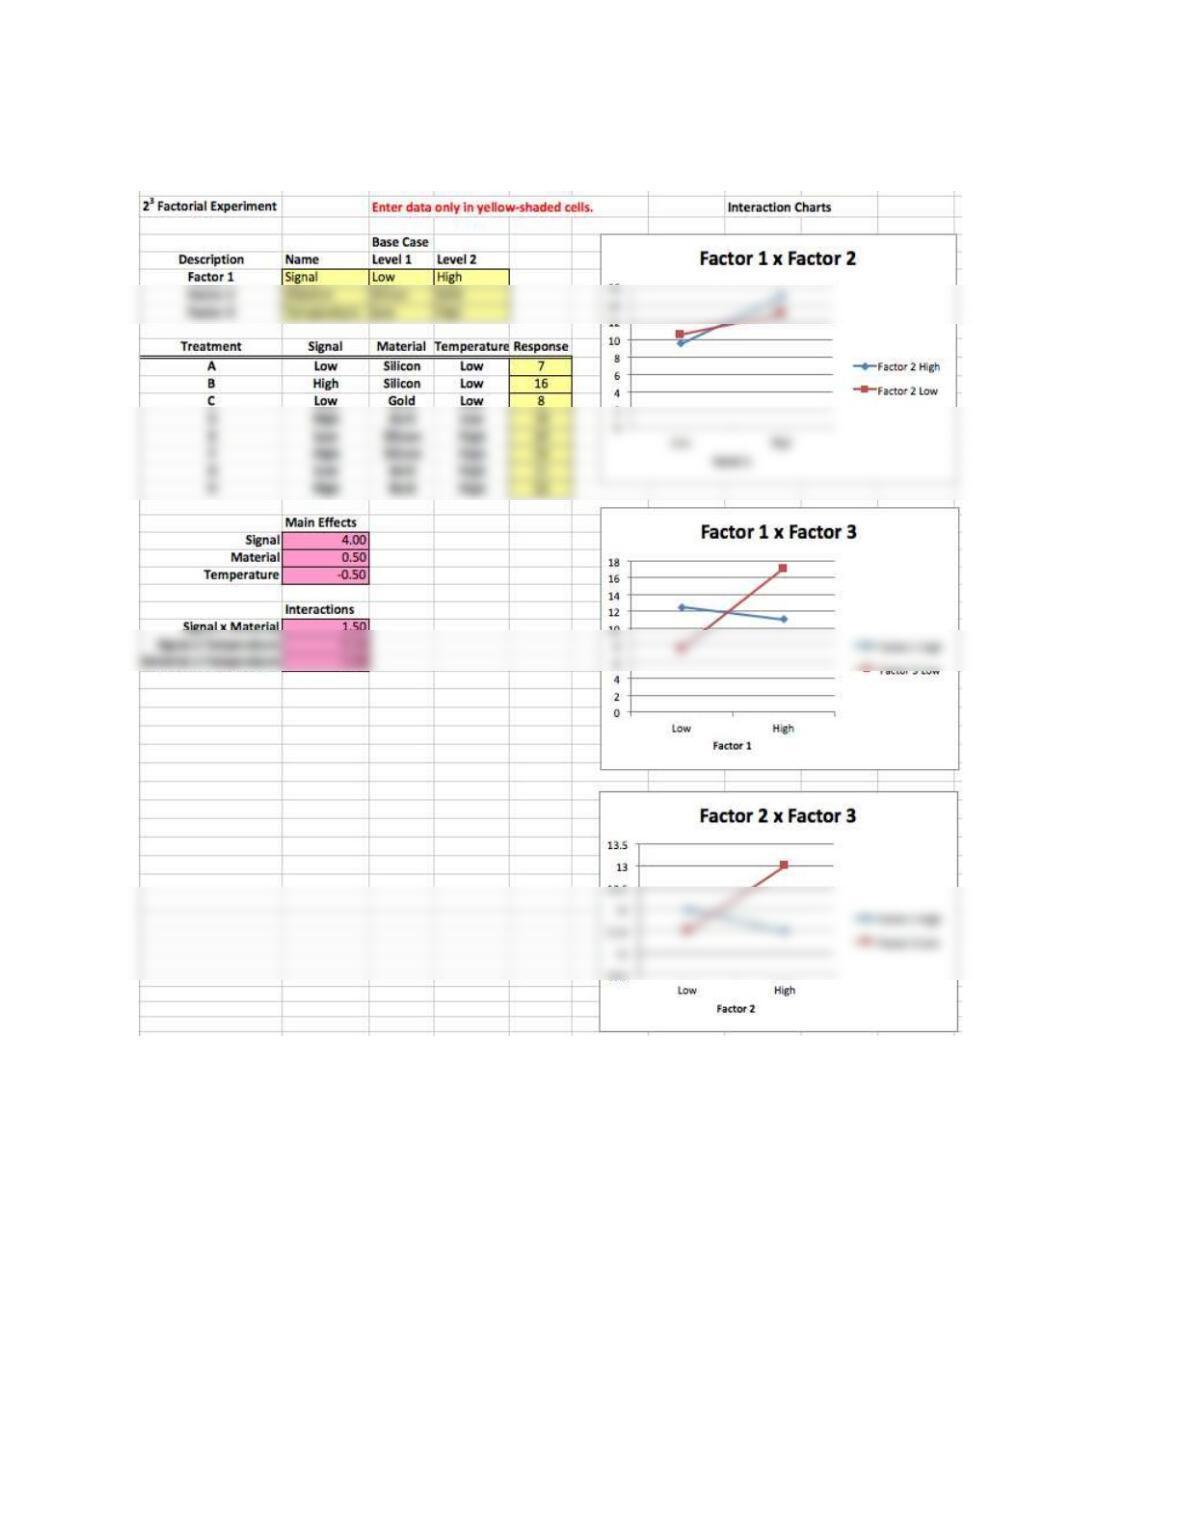
Use the 23 Factorial Experiment template. The main effects are calculated as:
Signal
High (18 + 12 + 16 + 10)/ 4 = 14
Material
Gold (18 + 12 + 8 + 11)/ 4 = 12.25
Temperature
High (12 + 10 + 11 + 14)/ 4 = 11.75
Low (18 + 16 + 8 + 7)/ 4 = 12.25
Statistical Methods in Quality Management 30
SUGGESTIONS FOR PROJECTS, ETC.
1. Devise an experiment similar to the battery performance test case (see the Battery
Experiment case that follows) to test different levels of some factor and conduct a statistical
analysis of the results. Write up your experiment and results in a report along with the
conclusions that you reach from the analysis.
This experiment is designed to give the student experience in elementary experimental design.
Instructors might wish to consult the following paper: “101 Ways to Design an Experiment, or
Some Ideas About Teaching Design of Experiments” by William G. Hunter, Technical Report
Statistical Methods in Quality Management 31
2. The web site http://www.paperhelicopterexperiment.com/ describes how to build a
paper helicopter to conduct a designed experiment. Choose only 3 factors from the list
provided, and build helicopters to identify the best design that keeps the helicopter
airborne for as long as possible. Fly each helicopter 5 times and use the average times as
your response values. Use the 23 Factorial Experiment template to conduct your analysis.
This is a fun experiment that will give the student experience in dealing with design problems in
ANSWERS TO CASE QUESTIONS
Burrito Brothers
Discussion Questions
See the instructor’s Excel solution file in the Ch 06 Case Excel Files folder
1. What conclusions do you reach when you calculate descriptive statistics for the answers
to each of the survey questions in the database?
A frequency count of the 25 customers who were surveyed is evenly divided, from first timers to
those who eat there weekly. The survey averages show that customers were most satisfied with
the menu and order preparation. Courtesy of employees, restaurant cleanliness, and value for
price hovered around a 4. Tastiness of the food and overall satisfaction averaged around 3.8 for
Customer survey responses
Avg
Std. dev.
Menu was easy to read
4.64
0.70
Order was prepared correctly
4.28
0.74