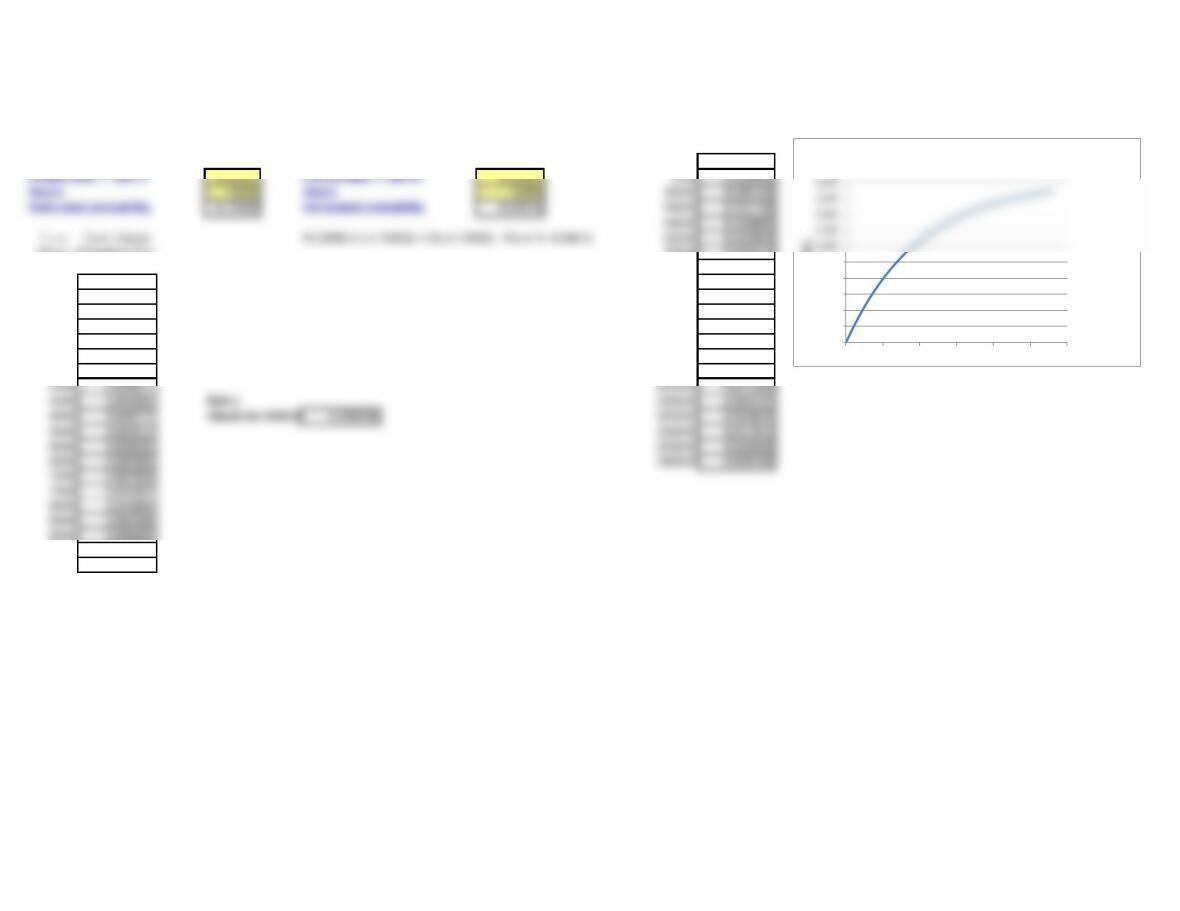
Genjeteye, Inc. Table for chart construction
Exponential Probability Distribution
Enter data only in yellow-shaded cells. T = x Cum. Failure
Hours Probability
Part b 00.000000
Hours
Probability F(x)
Check for 5129.3:
70000 0.503415
85000 0.572585
500 0.004988 100000 0.632121
1000 0.009950 115000 0.683363
1500 0.014888 130000 0.727468
2000 0.019801 145000 0.765430
2500 0.024690 160000 0.798103
3000 0.029554 175000 0.826226
3500 0.034395 190000 0.850431
9500 0.090627
10000 0.095163
0.000
0.100
0.200
0.300
0.400
0.500
0 50000 100000 150000 200000 250000 300000
Probability
Hours to Failure
Cumulative Failure Probability