Rainbow Punch
Probability Calculations Using the Normal Distribution – Template
Enter data only in the shaded cells
This spreadsheet is designed to calculate the probability of values equal to, or less than, a desired x value,
given the mean and standard deviation of a normally distributed variable. It uses the cumulative normal distribution
Enter the mean of the distribution in shaded cell D8 and the standard deviation in shaded cell D9. below.
Enter the desired X-value in shaded cell D10, below. The calculated z-value and probability will be seen in D11 and D12.
Mean of distribution 11.7 NORMAL PROBABILITY CALCULATIONS
Std deviation of distribution 0.18
Calculated z-value 1.20
(X-axis)
Probability Using
Prob. of x, or less 0.88493
Desired x-values
Equivalent – Z Values
NORMS.DIST
10.9 -4.44 0.00000
10.95 -4.17 0.00002
11 -3.89 0.00005
11.05 -3.61 0.00015
12.15 2.50 0.99379
12.2 2.78 0.99726
12.25 3.06 0.99888
12.3 3.33 0.99957
12.35 3.61 0.99985
12.4 3.89 0.99995
12.45 4.17 0.99998
12.5 4.44 1.00000
0.50
0.60
0.70
0.80
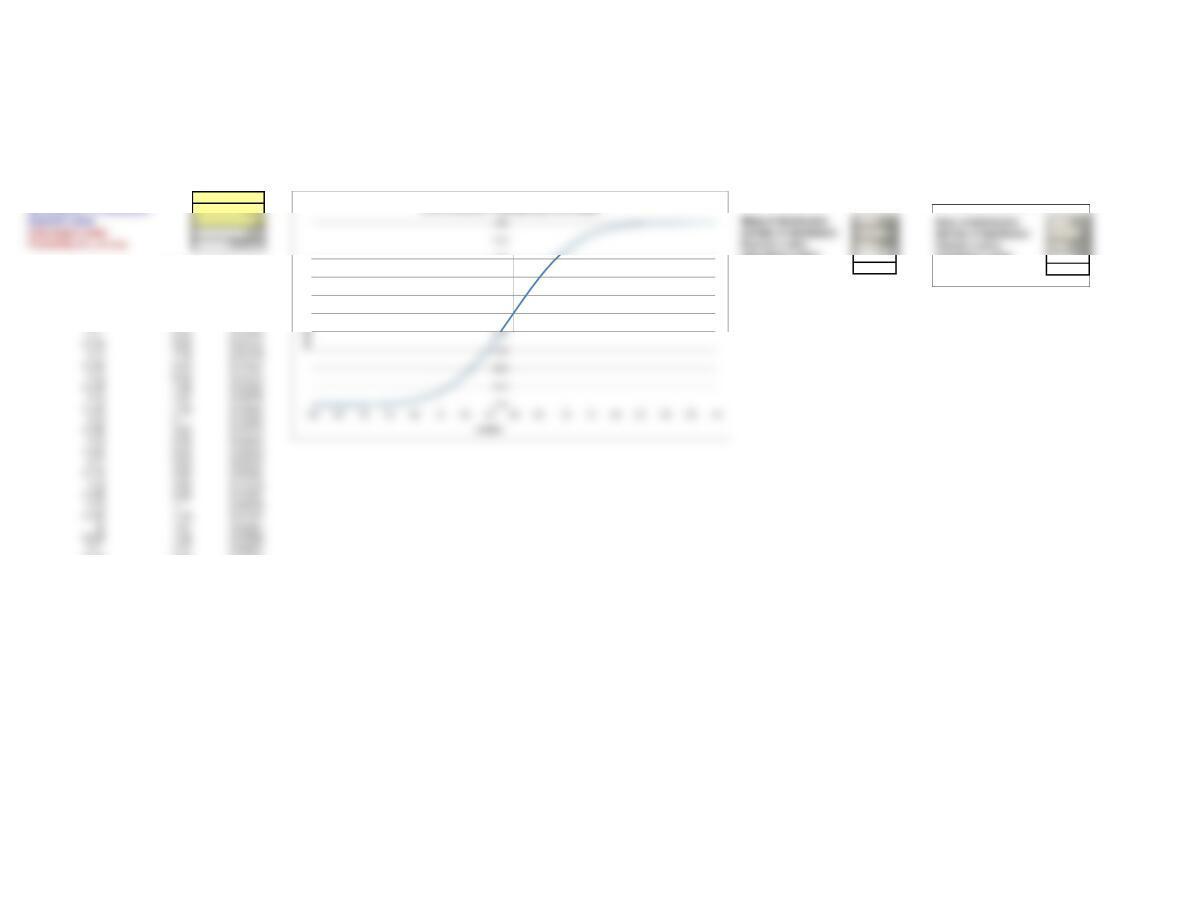
Cumulative Probability Function
Calculated z-value 1.20
Prob. of x, or less 0.88493
Desired x-value 12 Mean of distribution 1020
Mean of distribution 1020
Std Dev of distribution 20
Desired x-value 1044