Sparkly Cleaning
Probability Calculations Using the Normal Distribution Template
Enter data only in the shaded cells
This spreadsheet is designed to calculate the probability of values equal to, or less than, a desired x value,
given the mean and standard deviation of a normally distributed variable. It uses the cumulative normal distribution
Enter the mean of the distribution in shaded cell D8 and the standard deviation in shaded cell D9. below.
Enter the desired X-value in shaded cell D10, below. The calculated z-value and probability will be seen in D11 and D12.
Mean of distribution 128.225
Std deviation of distribution 5
(X-axis)
Probability Using
Desired x-values
Equivalent – Z Values NORMS.DIST
88.225 -8.00 0.00000
89.225 -7.80 0.00000
90.225 -7.60 0.00000
91.225 -7.40 0.00000
92.225 -7.20 0.00000
93.225 -7.00 0.00000
94.225 -6.80 0.00000
95.225 -6.60 0.00000
96.225 -6.40 0.00000
104.225 –4.80 0.00000
105.225 –4.60 0.00000
106.225 –4.40 0.00001
107.225 –4.20 0.00001
108.225 –4.00 0.00003
0.10
0.20
0.30
0.40
0.50
0.60
0.70
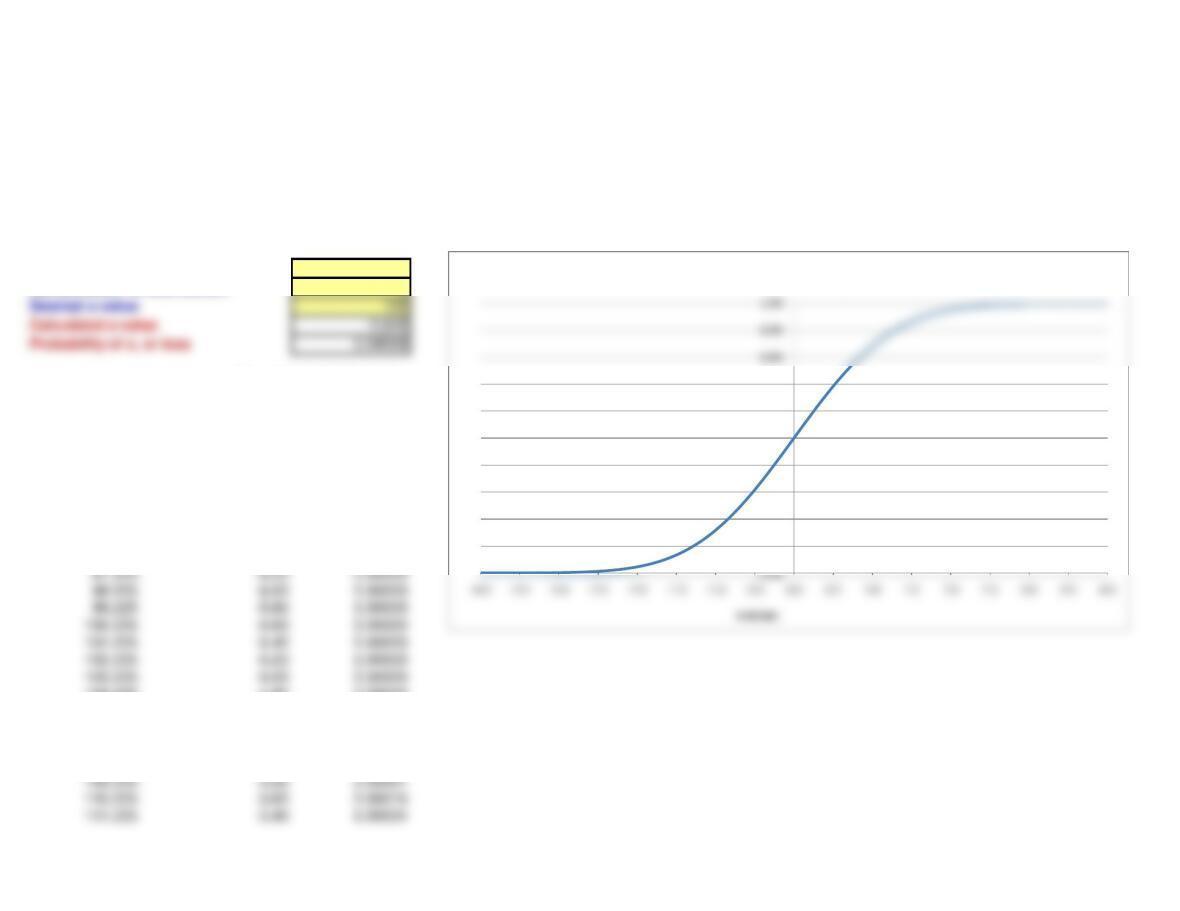
Cumulative Probability
Cumulative Probability Function
Desired x-value 120
112.225 –3.20 0.00069
113.225 –3.00 0.00135
114.225 –2.80 0.00256
115.225 –2.60 0.00466
116.225 –2.40 0.00820
117.225 –2.20 0.01390
125.225 –0.60 0.27425
126.225 –0.40 0.34458
127.225 –0.20 0.42074
128.225 0.00 0.50000
129.225 0.20 0.57926
130.225 0.40 0.65542
131.225 0.60 0.72575
132.225 0.80 0.78814
133.225 1.00 0.84134
134.225 1.20 0.88493
144.225 3.20 0.99931
145.225 3.40 0.99966
146.225 3.60 0.99984
147.225 3.80 0.99993
148.225 4.00 0.99997
149.225 4.20 0.99999
150.225 4.40 0.99999

155.225 5.40 1.00000
156.225 5.60 1.00000
162.225 6.80 1.00000
163.225 7.00 1.00000
164.225 7.20 1.00000
165.225 7.40 1.00000