Ohio Valley Construction
Probability Calculations Using the Normal Distribution Template
Enter data only in the shaded cells
This spreadsheet is designed to calculate the probability of values equal to, or less than, a desired x value,
given the mean and standard deviation of a normally distributed variable. It uses the cumulative normal distribution
Enter the mean of the distribution in shaded cell D8 and the standard deviation in shaded cell D9. below.
Enter the desired X-value in shaded cell D10, below. The calculated z-value and probability will be seen in D11 and D12.
Mean of distribution 15.5
Std deviation of distribution 0.1217
(X-axis)
Probability Using
Desired x-valuesEquivalent – Z Values NORMS.DIST
15.030 -3.86 0.00006
15.048 -3.71 0.00010
15.066 -3.57 0.00018
15.084 -3.42 0.00032
15.102 -3.27 0.00054
15.120 -3.12 0.00090
15.138 -2.97 0.00147
15.156 -2.83 0.00235
15.336 -1.35 0.08890
15.354 -1.20 0.11513
15.372 -1.05 0.14645
15.390 -0.90 0.18303
15.408 -0.76 0.22484
15.426 -0.61 0.27158
15.444 -0.46 0.32271
15.462 -0.31 0.37743
15.480 -0.16 0.43473
15.498 -0.02 0.49344
15.516 0.13 0.55230
15.534 0.28 0.61002
15.678 1.46 0.92821
15.696 1.61 0.94636
15.714 1.76 0.96066
15.732 1.91 0.97170
15.750 2.05 0.98002
15.768 2.20 0.98617
15.786 2.35 0.99061
15.804 2.50 0.99375
15.822 2.65 0.99593
15.840 2.79 0.99740
15.858 2.94 0.99837
0.20
0.30
0.40
0.50
0.60
0.70
0.80
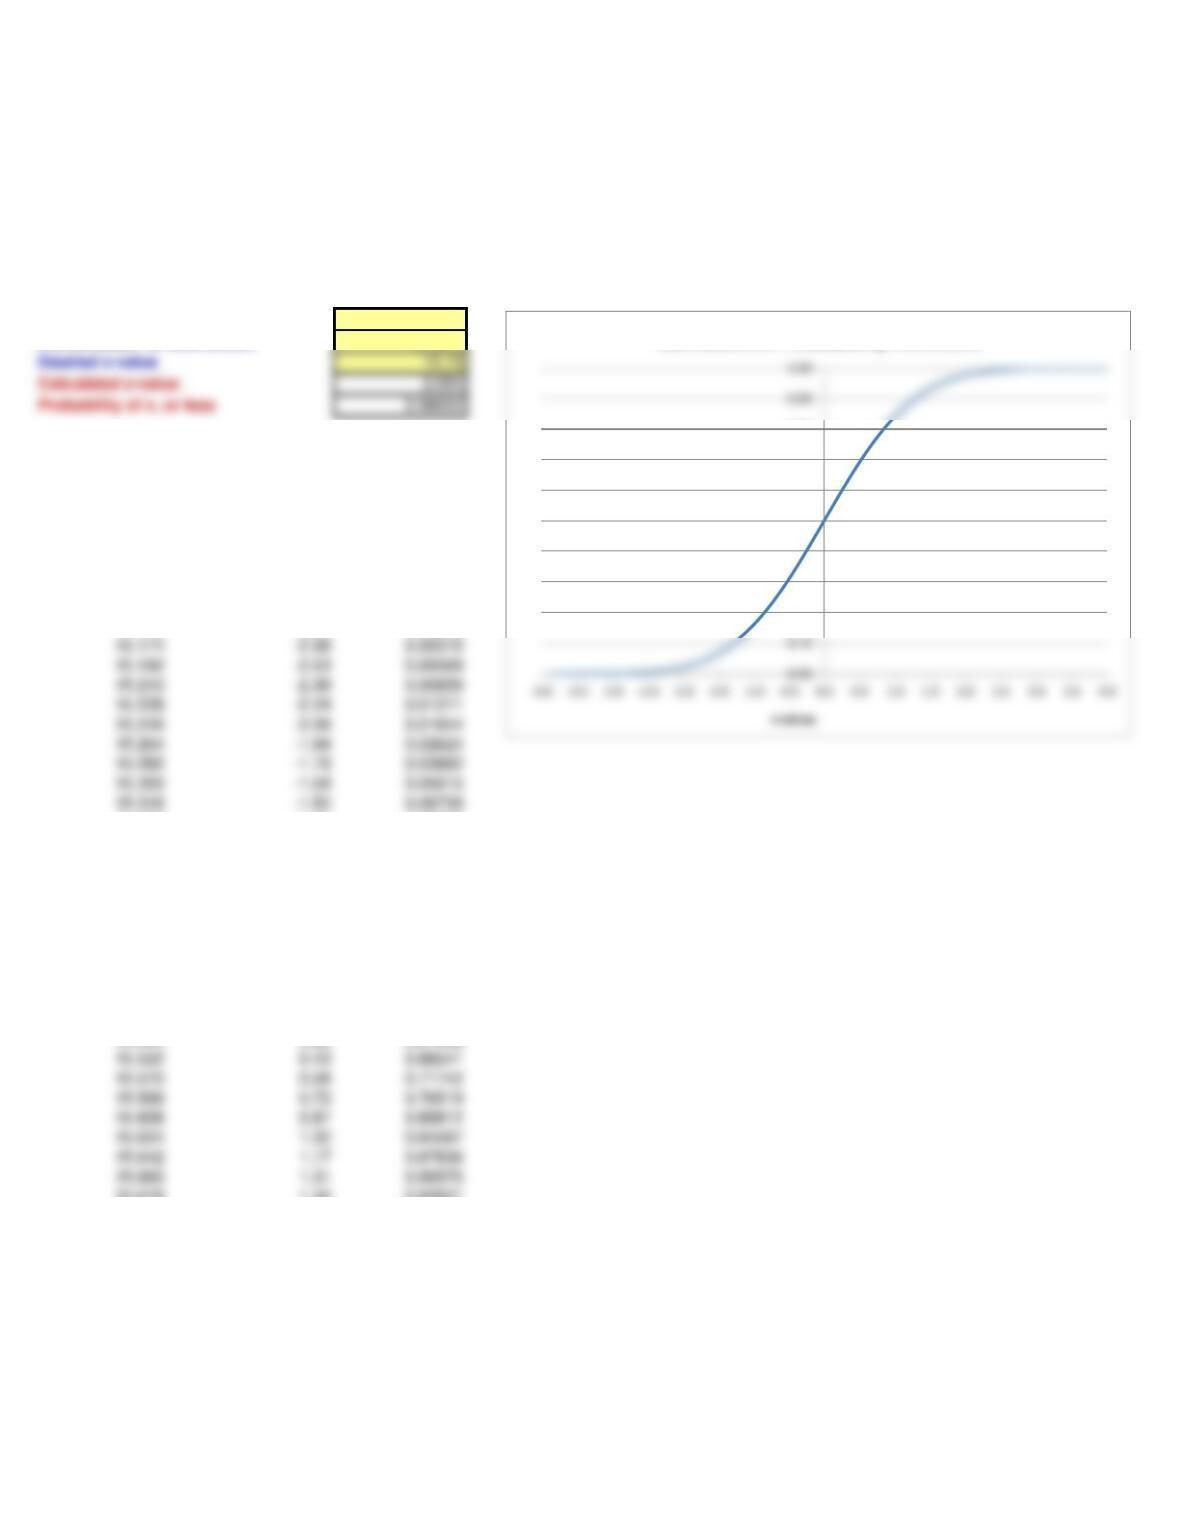
Cumulative Probability
Cumulative Probability Function
Desired x-value 15.75
15.876 3.09 0.99900
15.894 3.24 0.99940
15.912 3.39 0.99964
15.930 3.53 0.99979
15.948 3.68 0.99988
16.092 4.86 1.00000
16.110 5.01 1.00000
16.128 5.16 1.00000
16.146 5.31 1.00000
16.164 5.46 1.00000
16.182 5.60 1.00000
16.200 5.75 1.00000
16.218 5.90 1.00000
16.236 6.05 1.00000
16.254 6.20 1.00000
16.272 6.34 1.00000
16.434 7.67 1.00000
16.452 7.82 1.00000
16.470 7.97 1.00000