Design for Quality and Product Excellence 34
The components that can be purchased from three different suppliers. The reliabilities
of the components are as follows:
Component Supplier 1 Supplier 2 Supplier 3
A 0.99 0.99 0.98
B 0.95 0.96 0.98
C 0.92 0.96 0.98
Transportation and purchasing considerations require that only one supplier be chosen.
Which one should be selected if the player is to have the highest possible reliability?
Supplier 1: RaRbc = (0.96) [1 – (1 – 0.95)(1 – 0.92)] = 0.9860
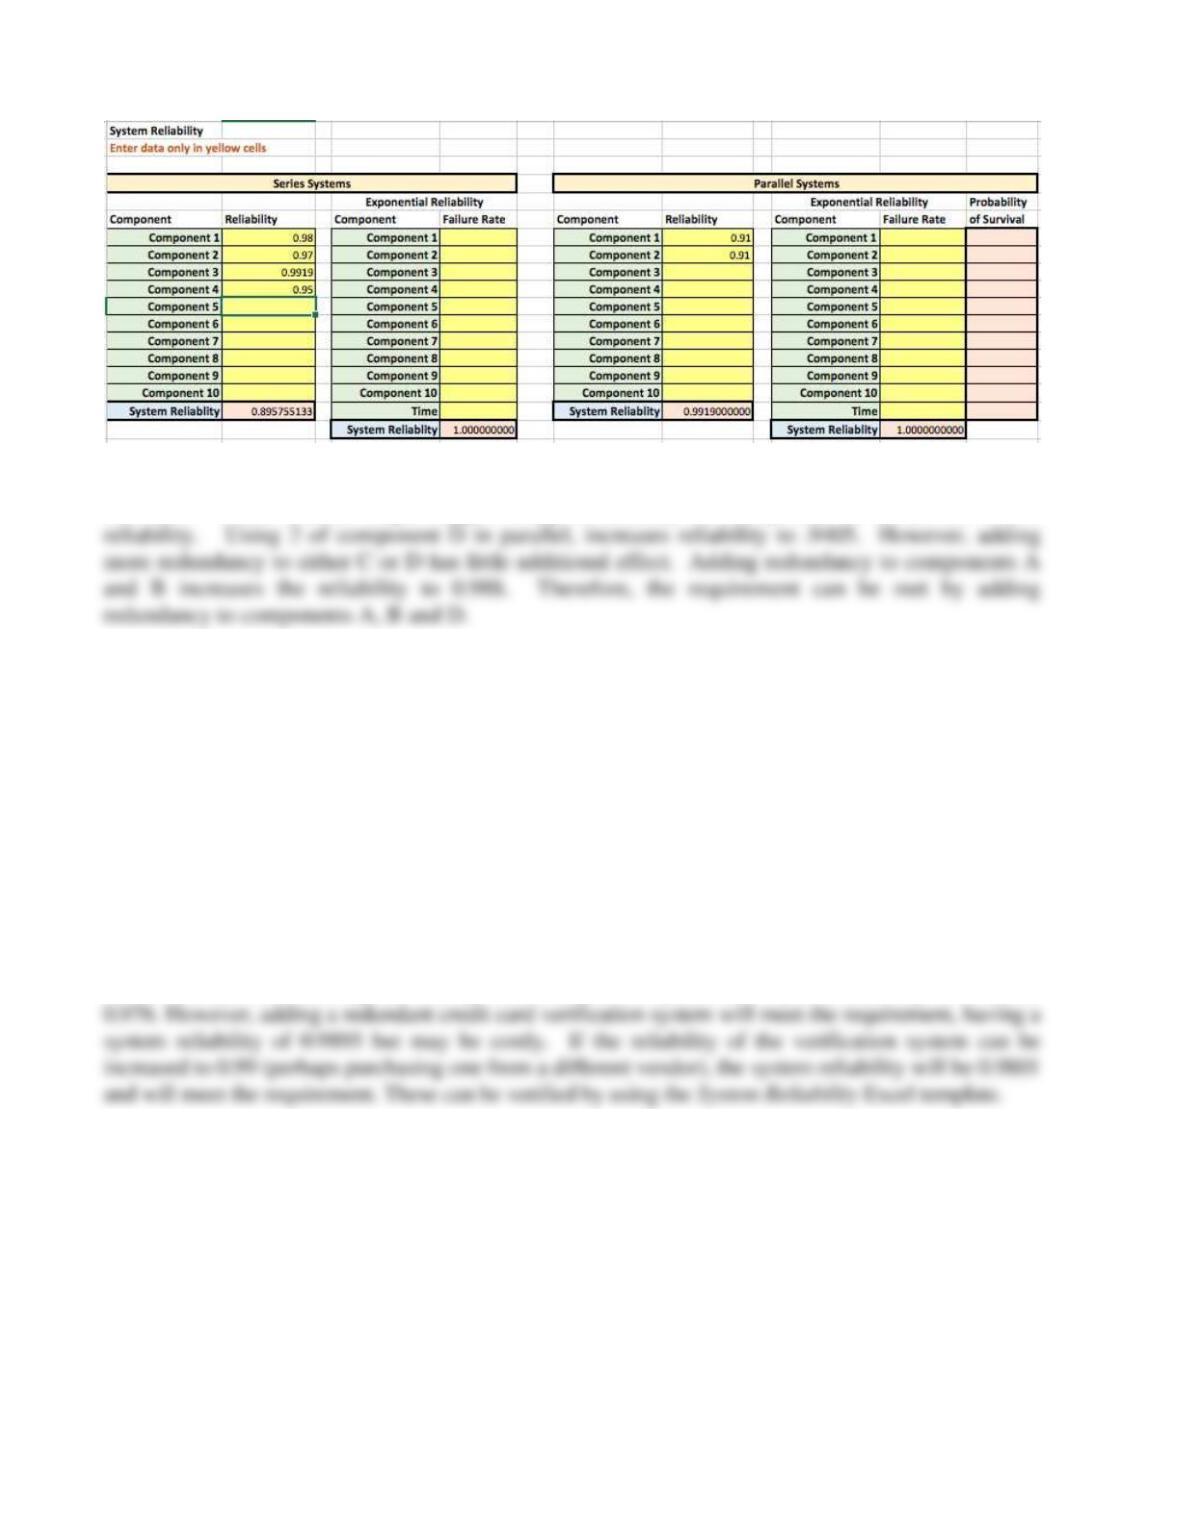
Therefore, choose Supplier 2. Students may use the System Reliability Excel template to compute the
parallel subsystem.
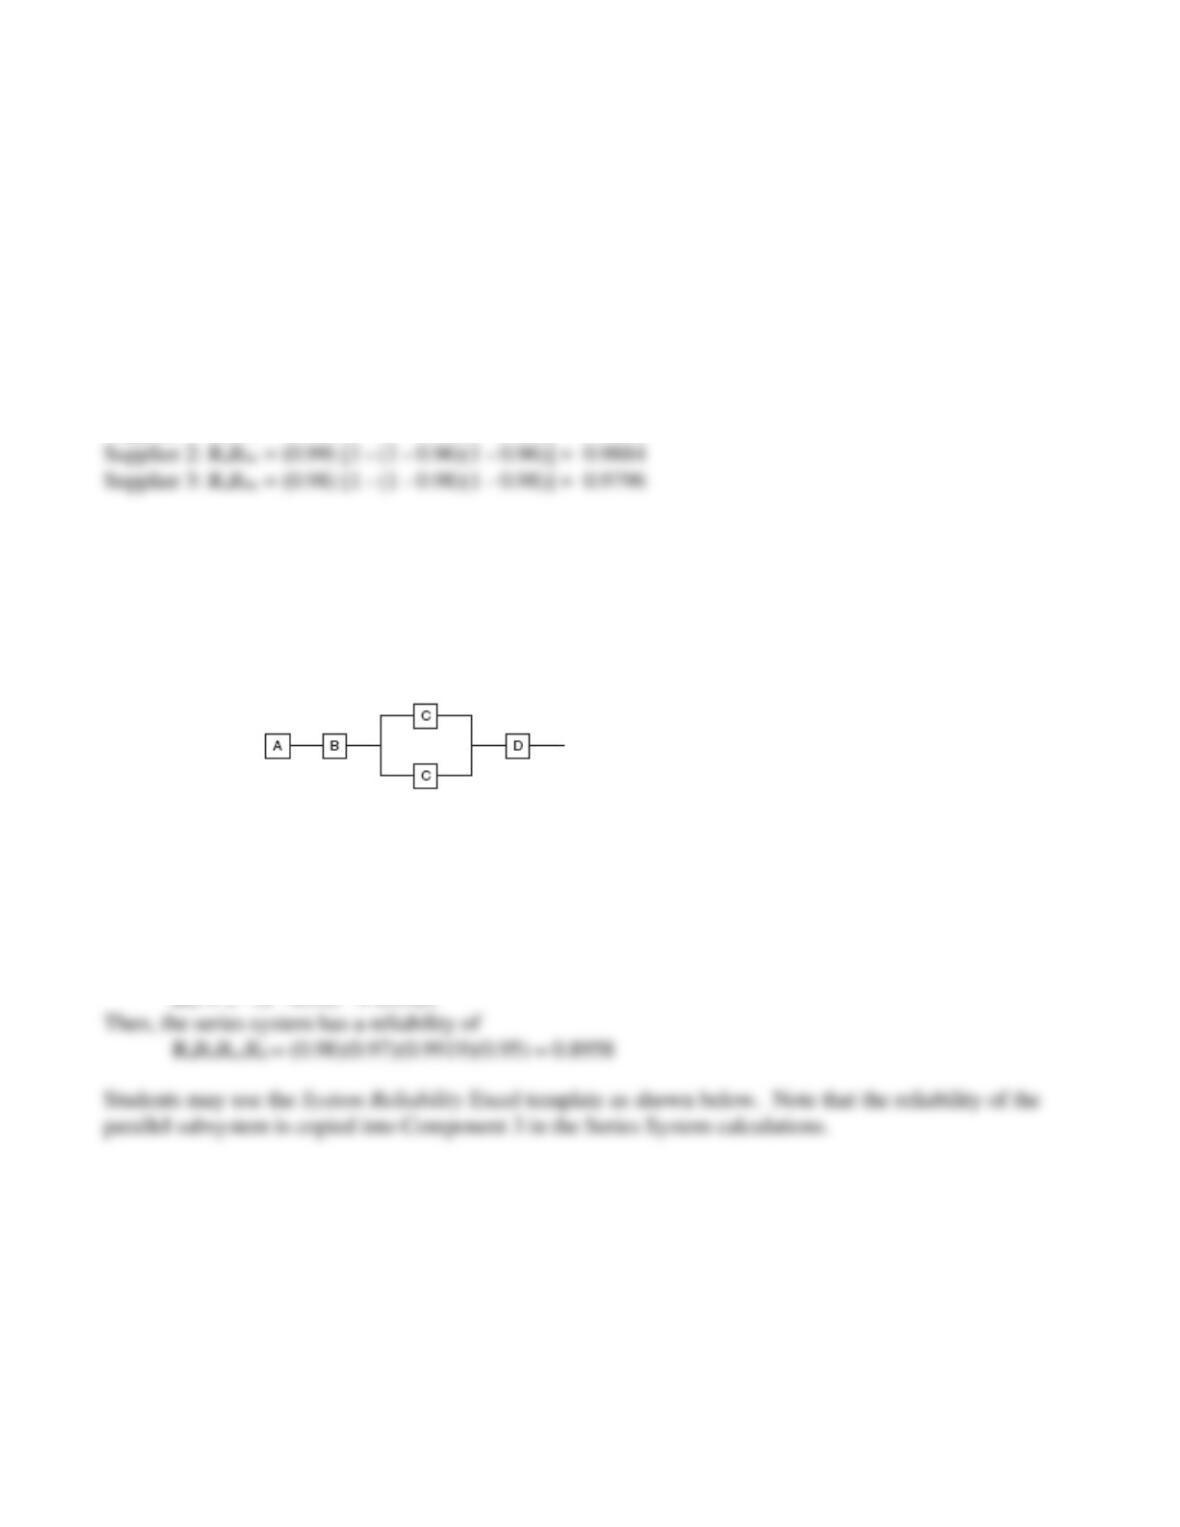
25. An electronic missile guidance system at Mguide, Inc. consists of: Components A, B, C, and
D which have reliabilities of 0.98, 0.97, 0.91, and 0.95, respectively (see the following
diagram). What is the reliability of the entire system?
a. What is the reliability of the entire system?
b. Suppose the customer requires a reliability of at least 0.98. Try to find a configuration that
meets this requirement using the minimum number of components.
a) The reliability of the parallel Rcc shown in the diagram from the problem above, is calculated as:
Rcc = 1 – (1 – 0.91) 2 = 0.9919
Design for Quality and Product Excellence 35
b) A configuration that meets the 0.98 reliability requirement is difficult, but can be attained by trial
and error. First, students might suggest using redundancy for component D, which has a low
26. Bestronics has a three-step process for processing customer sales. First, the cashier must
look up the customer’s loyalty card on the company’s information system. Second, the cashier
enters the transaction on the point-of-sale register. Third, the cashier processes the credit card
through a verification system.
a. If the reliability of the information system is 0.998, the reliability of the point-of-sale register
is 0.992 and the reliability of the credit card verification system is 0.978, what is the overall
system reliability?
b. If the store manager wants to ensure at least a 98 percent system reliability, make a
recommendation of how to do this.
a) RaRbRc = (0.998)(0.992)(0.978) = 0.968
b) If another point–of-sale register were put into the system in parallel, the system reliability will only be
27. Magnaplex, Inc. has a complex manufacturing process, with three operations that are
performed in series. Because of the nature of the process, machines frequently fall out of
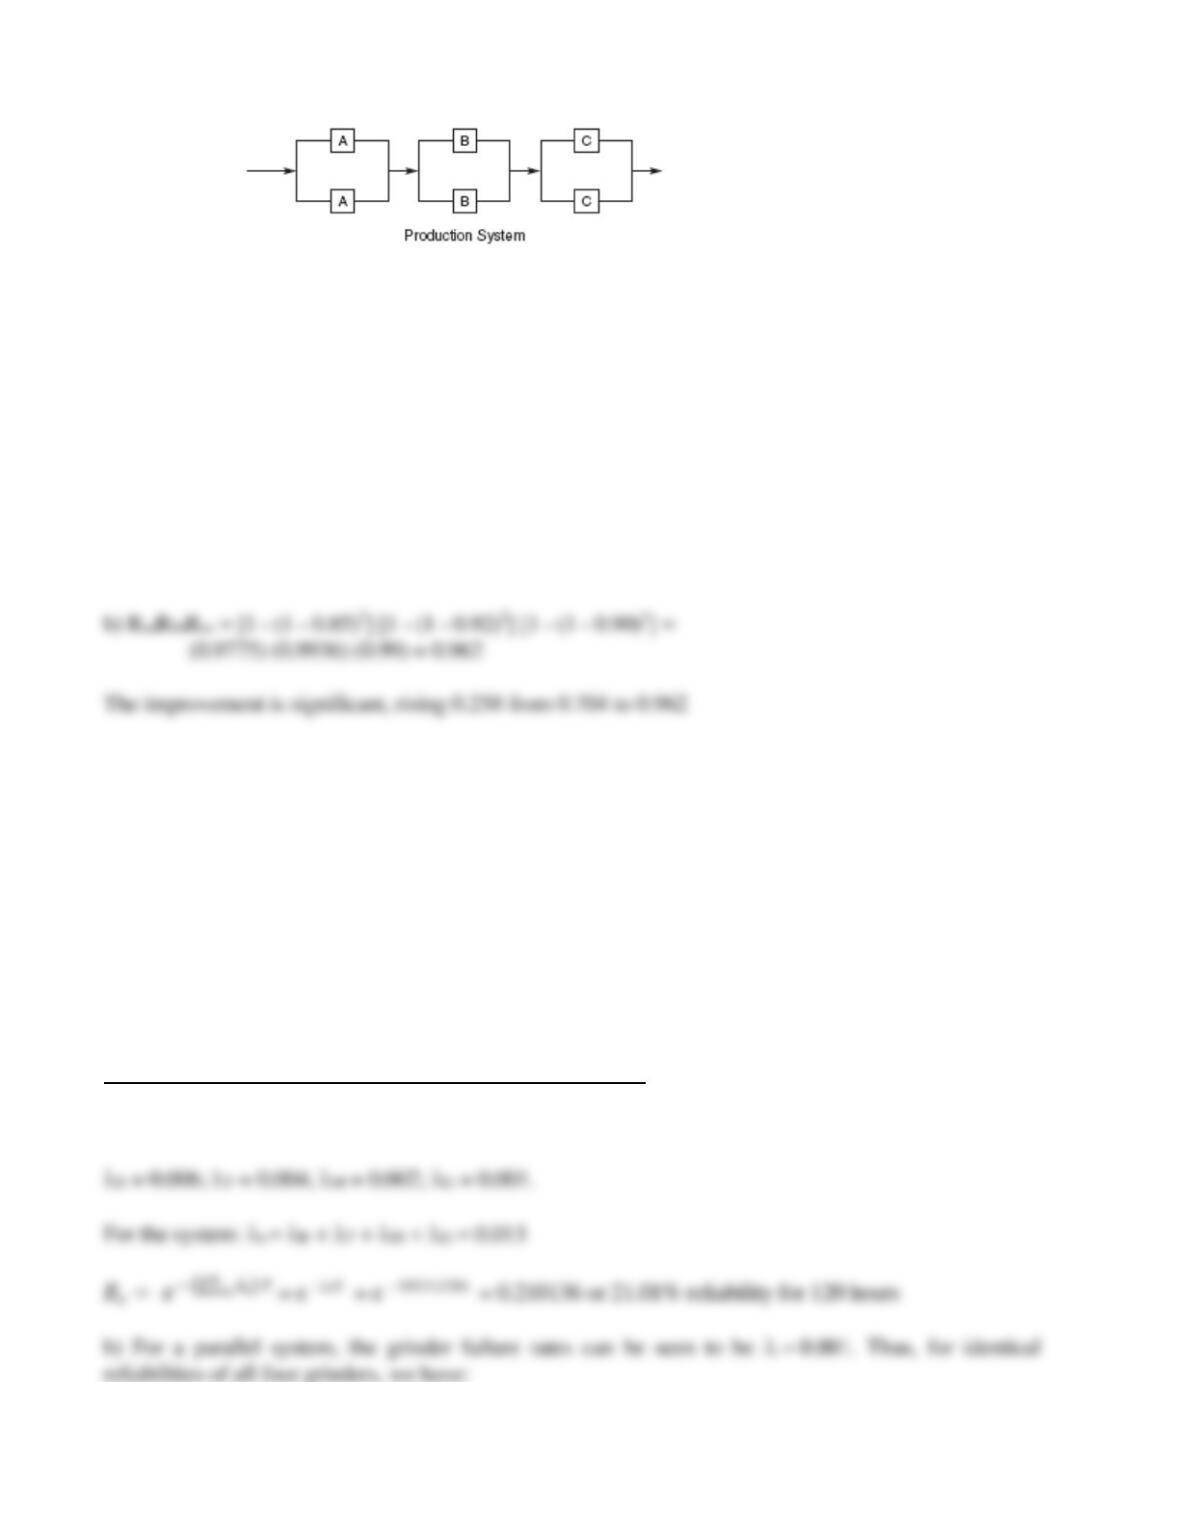
adjustment and must be repaired. To keep the system going, two identical machines are used
at each stage; thus, if one fails, the other can be used while the first is repaired (see
accompanying figure).
Design for Quality and Product Excellence 36
The reliabilities of the machines are as follows:
Machine Reliability
A 0.85
B 0.92
C 0.90
a. Analyze the system reliability, assuming only one machine at each stage (all the backup
machines are out of operation).
b. How much is the reliability improved by having two machines at each stage?
a) RaRbRc = (0.85)(0.92)(0.90) = 0.704
28. An automated production system at Autosys, Inc. consists of three operations: turning,
milling, and grinding. Individual parts are transferred from the prior work center to this
production system by a robot. Hence, if the robot fails or one machine goes down, the process
stops. A production analyst has found that the failure rates for each machine can be described
by an exponential distribution.
a. If the failure rates of the robot, turning center, milling machine, and grinder are 0.006,
0.004, 0.002, and 0.001, respectively, what is the reliability of the system for 120 hours of
operation?
b. Suppose that the critical machine is found to be the grinder. If four grinders are available
(in parallel), with the failure rate of 0.001, each, what is the reliability of the grinder sub–
system for 120 hours of operation?
See the Excel file Problem 7.28 in the instructor materials.
a) For a series system, each of these failure rates can be seen to be a . Thus, we have:
Design for Quality and Product Excellence 37
29. MegaMart, a large department store, has a very successful and profitable package
wrapping department. The department uses two very complex bow-making machines that
work inline to make the bows for the packages. Bow-making Machine #1 has a reliability of
0.97. Machine #2 is old, and has a reliability of only 0.85. There is one skilled operator who
knows how to operate the machines. She had been very reliable, but recently has had
increasing health problems which caused her to miss work about 10 percent of the time.
a. What is the current reliability of the system, including the operator?
b. Management is considering either scrapping Machine #2 and replacing it with a new
machine which has a reliability of 0.98 at a cost of $5,000, or training another operator to fill in
when the first operator is absent, at a cost of $5,100. Management estimates that profits from
the department would increase by $6,000 per year, if the bow-making line operated at 100
percent of capacity. If management wants to pay off its investment in the first year, determine
the expected net profit for each alternative, and recommend which one will be the most
profitable to management.
b) Alternatives
1) Replace machine: (0.97)(0.98)(0.90) = 0.8555
30. National Partamiento installs and maintains thousands of refrigerators and other
appliances in rental apartments across the country. They have conducted a short study of
failure rates based on following the performance of 25,440 refrigerators that were installed
during one month a year ago. The data can be found in the C07 Problem Data workbook. The
data show the number of failures of these 25,440 refrigerators each month over the past year.
a. Compute the average failure rate, . Is the failure rate relatively constant each month?
b. Use regression analysis to predict future failures. What is the predicted number of failures
each month for the next two years (that is, through month 36)?
c. If the refrigerators are typically under a 36-month warranty, how many cumulative failures
would be predicted in 36 months? What percentage of the total does this represent?
d. What are the strengths and limitations of using regression analysis for such reliability
predictions in this setting?
See the Excel file Problem 7.30 in the instructor materials.
Design for Quality and Product Excellence 38
a. The average failure rate is λ = 199 failures / (1708 + [24241 X 12]) unit operating months) =
0.000680109 average failures per month
The logic is sometimes a little difficult to explain to students. We can parallel this problem with
Example Problem 7.7 in the body of the text. Suppose that we had 24440 units tested over 12
months. 199 units failed, with 1, 3, 6, …29 units failing after 1, 2, 3, … 12 months respectively.
24241 units had not failed after 12 months.
The total unit operating months are
1 × 1 = 1
3 × 2 = 6
λ = (199 failures) / ([1+6+18+40+ …348] + [24241 X 12] unit operating hours) =
0.000680109 average failures per hour
The answer is: No, the monthly failure rates are not approximately equal.
Months in
Service
Monthly Failure
Rate
1
0.00004092
2
0.00012275
3
0.00024554
5
0.00045045
6
0.00057356
8
0.00086154
9
0.00094440
0.00127567
0.00119489
Design for Quality and Product Excellence 39
The predicted number of failures each month for the next two years (that is, through month
36), based on the regression formula of: Y = -2.257575 + 2.898601 * (months in service) is
as follows:
Months in
Service
Number
Installed
Number
Failed
Number Not
Failed
Cumulative
Failures
13
24241
35
24206
234
14
24206
38
24168
272
15
24168
41
24127
313
16
24127
44
24083
357
22
23818
62
23756
684
23
23756
64
23692
748
24
23692
67
23625
815
25
23625
70
23555
885
26
23555
73
23482
958
27
23482
76
23406
1034
28
23406
79
23327
1113
29
23327
82
23245
1195
30
23245
85
23160
1280
31
23160
88
23072
1368
32
23072
90
22982
1458
33
22982
93
22889
1551
34
22889
96
22793
1647
35
22793
99
22694
1746
36
22694
22592
1848
17
24083
47
24036
404
18
24036
50
23986
454
19
23986
53
23933
507
20
23933
56
23877
563
21
23877
59
23818
622
Design for Quality and Product Excellence 40
c. The trend that is evident from the data is the increasing number of units which failed. Thus, we
may use regression analysis to forecast the trend, so that percent failure can be calculated from the
results. The regression coefficient is 0.986, which is very strong.
Number installed
Cumulative No.
of failures
Number not
failed
% failures
1st Month
24440
1
24439
0.004092
d. The danger in using regression to forecast both number installed and the number of units failed is
primarily in assuming that these two trends are linear (straight line). Since many failure rate curves
have the bathtub shape, it follows that the percentage of failures might increase at an increasing rate
in the months following the first or second year.
5
10
30
35
Number Failed
Months in Service Line Fit Plot
Predicted Number Failed
36th Month
22694
1848
22592
7.56

Design for Quality and Product Excellence 41
SUGGESTIONS FOR PROJECTS, ETC.
1. Using whatever “market research” techniques are appropriate, define a set of customer
attributes for
a. Purchasing books at your college bookstore
b. A college registration process
c. A hotel room used for business
d. A hotel room used for family leisure vacations
For each case, determine a set of technical requirements and construct the relationship matrix for
the House of Quality.
Customer attributes and technical requirements might be:
Attributes Technical Requirements
a. Book purchase:
Hours Schedule of open hours
Organization By dept./course/professor
Pre-processing availability Reservations on Internet
b. Registration:
Convenience Time, dates, Internet, phone
Speed Process standards
Costs Fees
Accuracy Error prevention
Empathy Understanding/willingness of
personnel to solve problems
c. Hotel room – business:
Convenience Business location , dates, methods
Speed – check in/out Process standards, system knowledge
Technology FAX, Internet connection
d. Hotel room – family:
Convenience Location near recreation, moderate
dining facilities, dates, methods
Speed – check–in Process standards, system knowledge
Design for Quality and Product Excellence 42
Construction of the matrix is left to the student.
2. (This exercise would best be performed in a group.) Suppose that you were developing a small
pizza restaurant with a dining area and local delivery. Develop a list of customer requirements
and technical requirements and try to complete a House of Quality. What service standards
might such an operation have?
Customer requirements would likely include freshness, taste, consistency, appearance of the product;
knowledge, attentiveness, friendliness of customer service personnel; speed and accuracy of the cooks
and order fillers; accuracy and friendliness of the counter personnel. Technical requirements might be
explored to determine what would be required to deliver the product to in-house versus delivery
customers. The former would require wait staff training in customer service techniques, while the latter
3. Most children (and many adults) like to assemble and fly balsa-wood gliders. From your own
experiences or from interviews with other students, define a set of customer requirements for a
good glider. (Even better, buy one and test it to determine these requirements yourself.) If you
were to design and manufacture such a product, how would you define a set of technical
requirements for the design? Using your results, construct a relationship matrix for a House of
Quality.
For a glider the following customer attributes and technical requirements might be:
Attributes Technical Requirements
Ease of assembly “Design for assembly“; Simple instructions
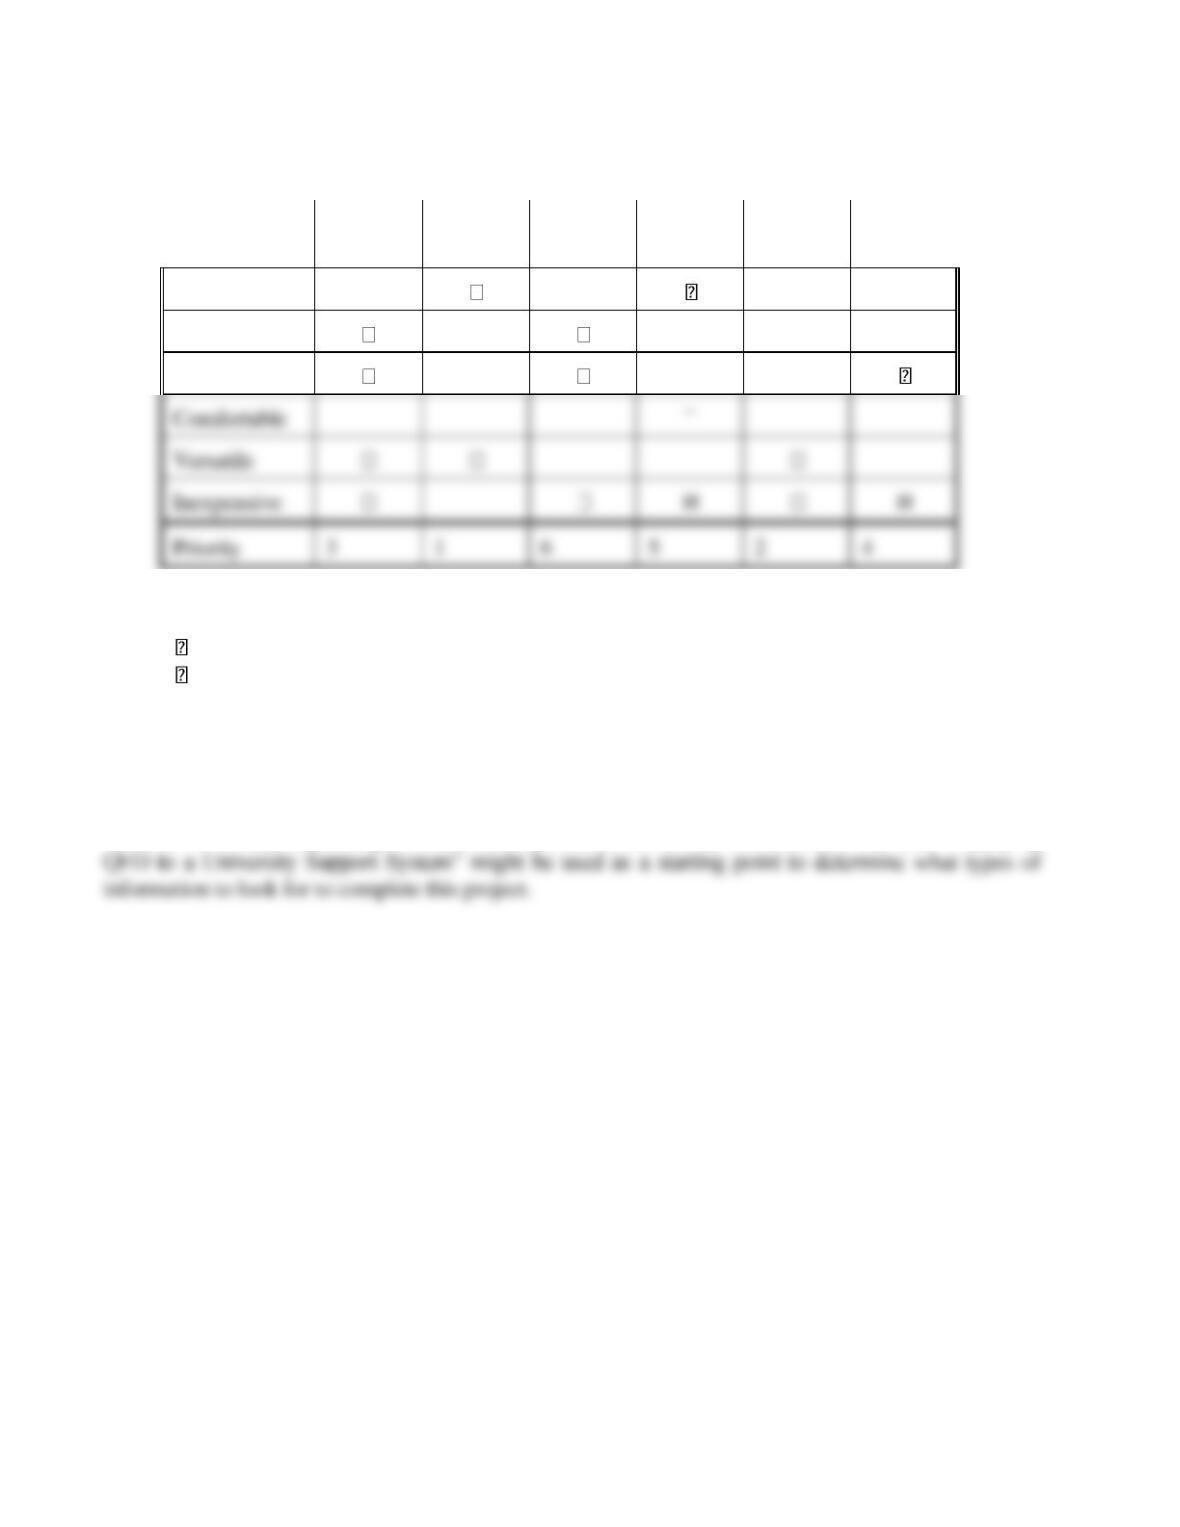
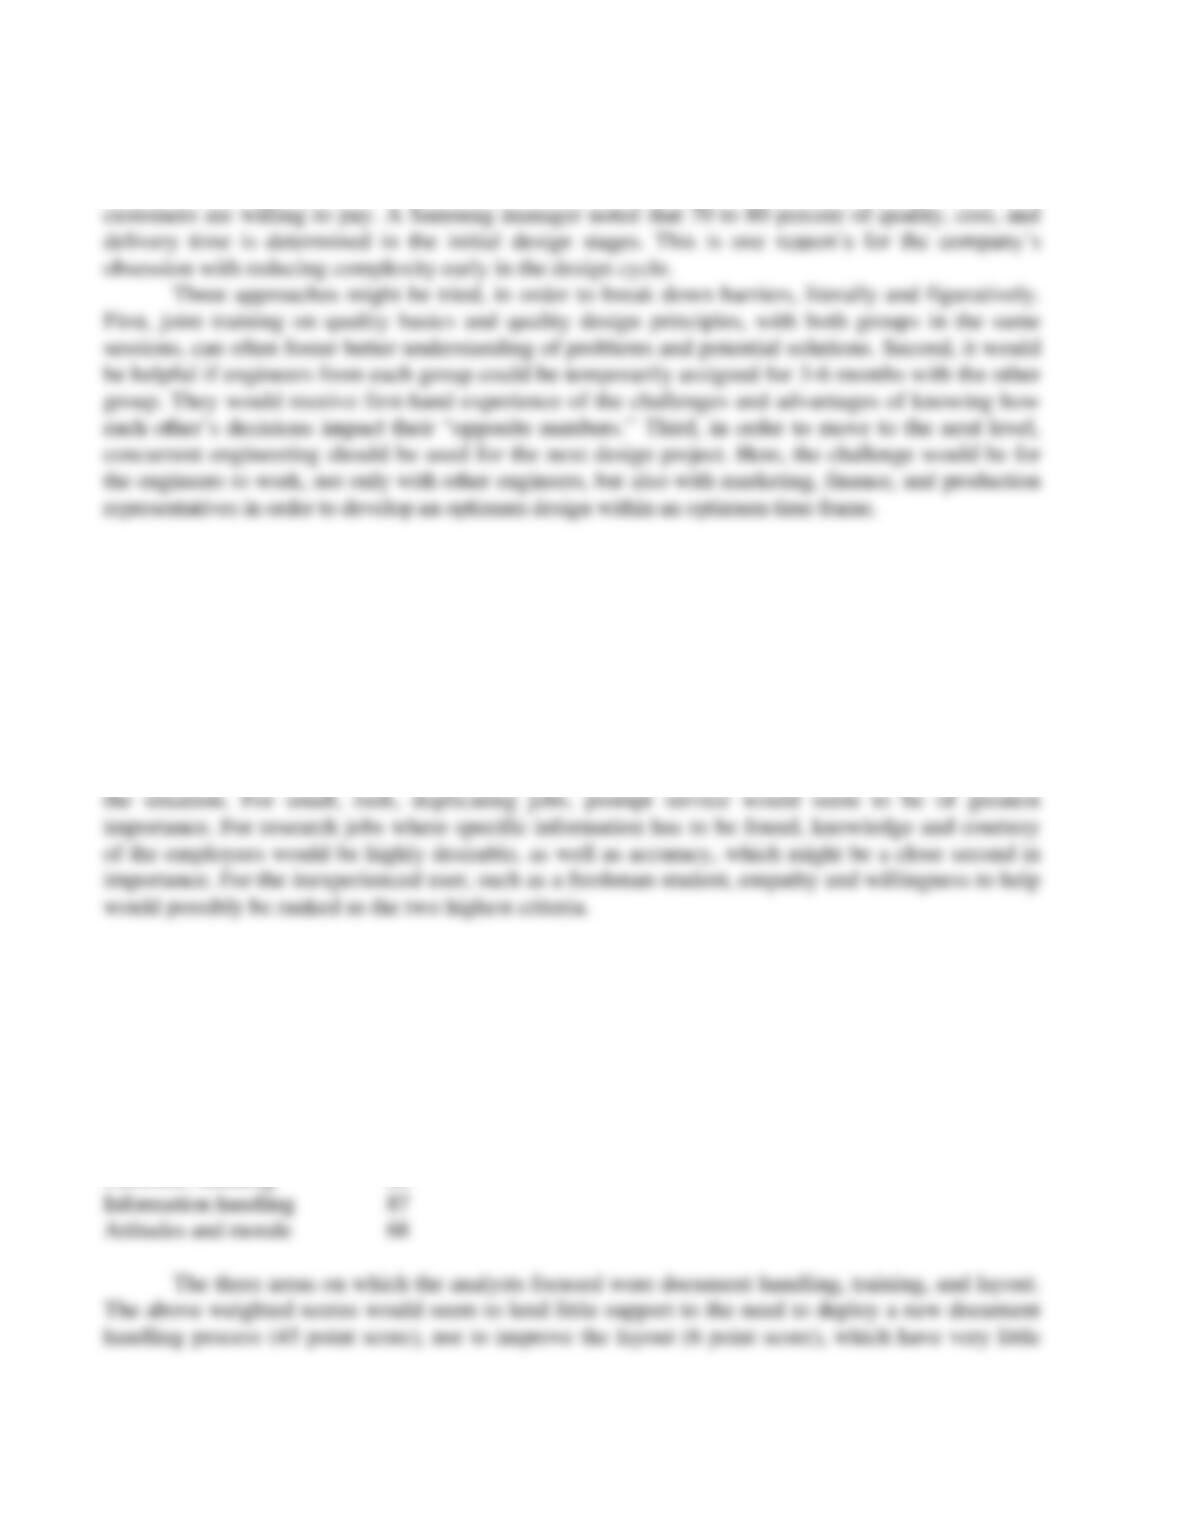
4. Fill in the following relationship matrix of a House of Quality for a screwdriver. By sampling
your classmates, develop priorities for the customer attributes and use these and the relationships
to identify key technical requirements to deploy.
The best way to prioritize the voice of the customer would be to have a focus group of typical
customers, such as craftspeople, do-it–yourselfers, hobbyists to provide input on how they used the
Design for Quality and Product Excellence 43
HOUSE OF QUALITY MATRIX
FOR A SIMPLE SCREWDRIVER
Price
Interchg
Bits
Steel
Shaft
Rubber
Grip
Ratchet
Capabil.
Plastic
Handle
Easy to use
Does not rust
Durable
• = Very strong relationship
= Strong relationship
= Weak relationship
5. Prepare a full DFMEA for a casual dining restaurant. Consider failure modes that might
occur both in food preparation and in service. Clearly explainand justify your choices for the
severity, likelihood, and detection ratings.
Answers will vary, depending on the service processes chosen by the students. The case “Applying
6. Investigate design-for-environment practices in some of your local industries. Describe
company policies and the methods and techniques that they use to address environmental
concerns in product design.
Answers will vary, depending on the organization chosen for study.
ANSWERS TO CASE QUESTIONS
The Elevator Dilemma
What would you do in this situation and why?
The wall of bookcases and file cabinets approach is not a feasible solution for the long term! The
engineers need to be taught the basics of concurrent engineering and design for manufacturability.
Concurrent engineering involves multifunctional teams, usually consisting of 4 to 20 members and
Comfortable
Versatile
Inexpensive
Priority
3
1
6
5
2
4
Design for Quality and Product Excellence 44
including every specialty in the company. The functions of such teams are to perform and coordinate
the activities in the product development process simultaneously, rather than sequentially. Designers
must pay particular attention to cost, quality, and manufacturability in order to meet price targets that
Applying Quality Function Deployment to a University Support Service
1. Do you agree with the relative importance of measures of the voice of the customer in
Figure 7.32? Explain why these rankings are reasonable, or provide counterarguments for a
different ranking.
The answer to the question of whether students agree or disagree with the relative importance
rankings obtained from the study of the RRC at Tennessee Tech ultimately depends on students’
opinions. However, a strong case might be made that the relative importance score would depend on
2. Using the relative importance ratings of the customer attributes and setting a scale of 1 =
weak, 3 = medium, and 5 = strong for the relationship matrix, compute a weighted score for
each of the technical requirements in Figure 7.32. Do your scores support the conclusions of
the study in terms of the key service components to deploy in the QFD process?
Concentrating on the top four characteristics, the following weighted scores can be calculated:
Resources (personnel) 135
Customer handling 68
Design for Quality and Product Excellence 45
3. What conclusions can you reach in terms of the key service components to deploy in the
QFD process? What other recommendations might you suggest based on the information
provided in this case? Propose an improved layout of the RRC and justify your proposal.
Given the high ranking of resources (personnel), it appears that more attention should be paid to
selection and retention issues. Information handling, in second place, also has a major impact, with
Black Elk Medical Center
Suppose that you were consulting for this organization. What would your next steps be? How
would you use data gathered from the checklist? How would you design improved processes
and systems to improve and control the incidence of falls, and to effectively and rapidly reduce
the fall rate to be below 3.4 falls/1000 patient days?
The next steps would include gathering data using the checklist form that the committee designed.
The committee might also want to develop process flow charts, while waiting for the fall data to be
gathered and analyzed.
The data from the checklist should be put into a format, perhaps in a spreadsheet, where it