Problem 7-10 Instructor Reserve
Lapstrake Battery Co. – Reliability
Enter data only in the shaded cells
This spreadsheet is designed to calculate the probability of values equal to, or less than, a desired x value,
given the mean and standard deviation of a normally distributed variable. It uses the cumulative normal distribution
Enter the mean of the distribution in shaded cell D8 and the standard deviation in shaded cell D9. below.
Enter the desired X-value in shaded cell D10, below. The calculated z-value and probability will be seen in D11 and D12.
Mean of distribution 1800 1800 NORMAL PROBABILITY CALCULATIONS
Std deviation of distribution 50 50
Calculated z-value 1.20
(X-axis) Probability Using
Prob. of x, or less 0.88493
Desired x-values
Equivalent – Z Values
NORMS.DIST
1600 -4.00 0.00003 Equivalent Probability Using Desired
1605 -3.90 0.00005 Z Values NORM.DIST x-values
1610 -3.80 0.00007 -4.00 0.00003 940
1615 -3.70 0.00011 -3.60 0.00016 948
1620 -3.60 0.00016 -3.20 0.00069 956
1625 -3.50 0.00023 -2.80 0.00256 964
1630 -3.40 0.00034 -2.40 0.00820 972
1635 -3.30 0.00048 -2.00 0.02275 980
1640 -3.20 0.00069 -1.60 0.05480 988
1645 -3.10 0.00097 -1.20 0.11507 996
1685 -2.30 0.01072 2.00 0.97725 1060
1690 -2.20 0.01390 2.40 0.99180 1068
1695 -2.10 0.01786 2.80 0.99744 1076
1700 -2.00 0.02275 3.20 0.99931 1084
1705 -1.90 0.02872 3.60 0.99984 1092
1710 -1.80 0.03593 4.00 0.99997 1100
1715 -1.70 0.04457
1720 -1.60 0.05480
1725 -1.50 0.06681 <– x = 1725
1730 -1.40 0.08076
1735 -1.30 0.09680
1740 -1.20 0.11507
1745 -1.10 0.13567
1750 -1.00 0.15866
1755 -0.90 0.18406
1760 -0.80 0.21186
1765 -0.70 0.24196
1770 -0.60 0.27425
1820 0.40 0.65542
1825 0.50 0.69146
1830 0.60 0.72575
1835 0.70 0.75804
1840 0.80 0.78814
1845 0.90 0.81594
1850 1.00 0.84134
1855 1.10 0.86433
1860 1.20 0.88493
1865 1.30 0.90320
1870 1.40 0.91924
1875 1.50 0.93319
1880 1.60 0.94520
1885 1.70 0.95543
0.50
0.60
0.70
0.80
0.90
1.00
-4.0-3.8-3.6-3.4-3.2-3.0-2.8-2.6-2.4-2.2-2.0-1.8-1.6-1.4-1.2-1.0-0.8-0.6-0.4-0.2 0.0 0.2 0.4 0.6 0.8 1.0 1.2 1.4 1.6 1.8 2.0 2.2 2.4 2.6 2.8 3.0 3.2 3.4 3.6 3.8 4.0
z-values
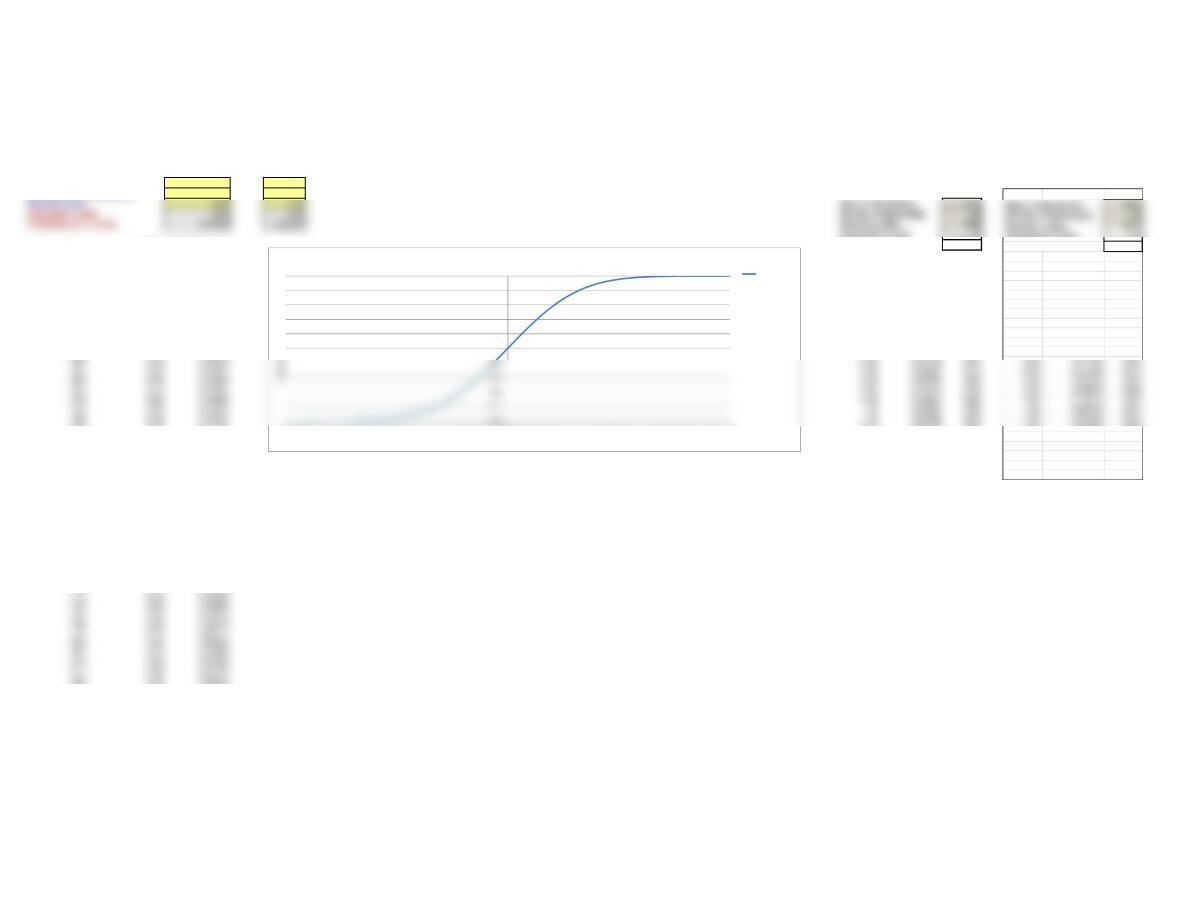
Cumulative Probability Function
NORMS.DIST
Calculated z-value 1.20
Prob. of x, or less 0.88493
Equivalent
Probability Using
Desired
Z Values NORM.DIST x–values
–4.00 0.00003 940
–3.60 0.00016 948
–3.20 0.00069 956
–2.80 0.00256 964
–2.40 0.00820 972
–2.00 0.02275 980
–1.60 0.05480 988
–1.20 0.11507 996
2.00 0.97725 1060
2.40 0.99180 1068
2.80 0.99744 1076
3.20 0.99931 1084
3.60 0.99984 1092
4.00 0.99997 1100

1890 1.80 0.96407
1895 1.90 0.97128
1900 2.00 0.97725
1905 2.10 0.98214
1910 2.20 0.98610
1915 2.30 0.98928
1920 2.40 0.99180
1990 3.80 0.99993
1995 3.90 0.99995
2000 4.00 0.99997
Problem 7-10 Instructor Reserve
Lapstrake Battery Co. – Reliability
X-value Calculations Given Probabilities Using the Inverse Normal Distribution
This spreadsheet is designed to calculate the X-value based on probability of values equal to, or less than a desired x value,
of a normally distributed variable. It requires input of a known mean and standard deviation and uses the inverse of the cumulative normal distribution
Enter the mean of the distribution in cell D8 and the standard deviation in cell D9, below.
Enter the desired probability in cell D10, and the calculated x-value will be seen in D11.
Mean of distribution 1800
Std Dev of distribution 50
x-values Probability
Calculated x-values
Probability Reliability – 1-P 1650 0.00135
1600 0.00003 0.99997 1700 0.02275
1605 0.00005 0.99995 1750 0.15866
1610 0.00007 0.99993 1800 0.50000
1615 0.00011 0.99989 1850 0.84134
1620 0.00016 0.99984 1850 0.84134
1625 0.00023 0.99977 1950 0.99865
1665 0.00347 0.99653
1670 0.00466 0.99534
1675 0.00621 0.99379
1680 0.00820 0.99180
1685 0.01072 0.98928
1690 0.01390 0.98610
1695 0.01786 0.98214
1700 0.02275 0.97725
1705 0.02872 0.97128
1710 0.03593 0.96407
1715 0.04457 0.95543
1720 0.05480 0.94520
1785 0.38209 0.61791
1790 0.42074 0.57926
1795 0.46017 0.53983
1800 0.50000 0.50000
1805 0.53983 0.46017
1810 0.57926 0.42074
0.500
0.600
0.700
0.800
0.900
1.000
X-values
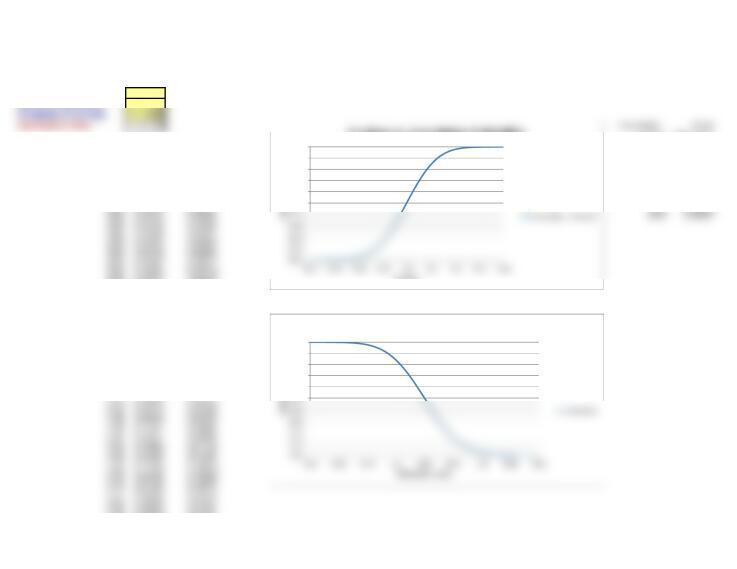
X-values vs. Cumulative Probability
0.600
0.700
0.800
0.900
1.000
Reliability Curve

1815 0.61791 0.38209
1820 0.65542 0.34458
1825 0.69146 0.30854
1830 0.72575 0.27425
1835 0.75804 0.24196
1840 0.78814 0.21186
1845 0.81594 0.18406
1850 0.84134 0.15866
1855 0.86433 0.13567
1860 0.88493 0.11507
1865 0.90320 0.09680
1870 0.91924 0.08076
1875 0.93319 0.06681
1880 0.94520 0.05480
1885 0.95543 0.04457
1890 0.96407 0.03593
1895 0.97128 0.02872
1955 0.99903 0.00097
1960 0.99931 0.00069
1965 0.99952 0.00048
1970 0.99966 0.00034
1975 0.99977 0.00023
1980 0.99984 0.00016
1985 0.99989 0.00011
1990 0.99993 0.00007
1995 0.99995 0.00005
2000 0.99997 0.00003
Problem 7-10 Instructor Reserve
Lapstrake Battery Co. – Reliability
Z and X-value Calculations Given Probabilites, Using the Inverse Normal Distribution – Template
This spreadsheet is designed to calculate the z-value based on probability of values equal to, or less than,
an equivalent x-value of a normally distributed variable. It uses the inverse of the cumulative normal distribution.
Enter the desired probability of the Z-value or less in the shaded cell D8, below.
The calculated z-value will be seen in cell D9.
Calculated Equivalent
Probability Z Values x-values
0.00003 -4.00 1600
0.00005 -3.90 1605
0.00007 -3.80 1610
0.00011 -3.70 1615
0.00016 -3.60 1620
0.00347 -2.70 1665
0.00466 -2.60 1670
0.00621 -2.50 1675
0.00820 -2.40 1680
0.01072 -2.30 1685
0.01390 -2.20 1690
0.01786 -2.10 1695
0.02275 -2.00 1700
0.02872 -1.90 1705
0.03593 -1.80 1710
0.04457 -1.70 1715
0.18406 -0.90 1755
0.21186 -0.80 1760
0.24196 -0.70 1765
0.27425 -0.60 1770
-5.00
-4.00
-3.00
-2.00
-1.00
4.00
5.00
Cumulative
Probability
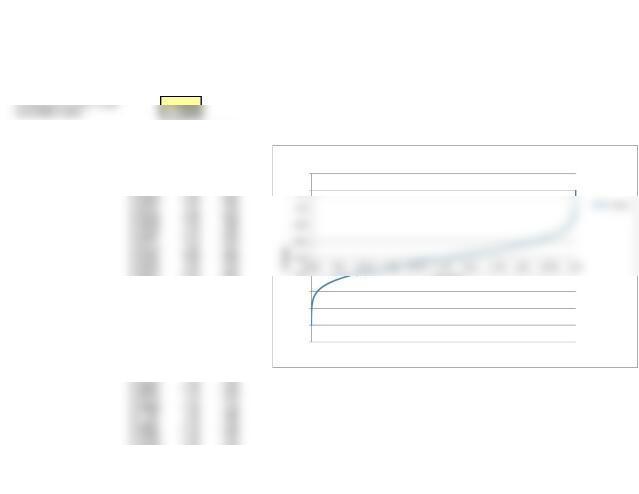
Z Values vs. Probability

0.30854 -0.50 1775
0.34458 -0.40 1780
0.38209 -0.30 1785
0.42074 -0.20 1790
0.46017 -0.10 1795
0.50000 0.00 1800
0.53983 0.10 1805
0.57926 0.20 1810
0.61791 0.30 1815
0.65542 0.40 1820
0.69146 0.50 1825
0.72575 0.60 1830
0.90320 1.30 1865
0.91924 1.40 1870
0.93319 1.50 1875
0.94520 1.60 1880
0.95543 1.70 1885
0.96407 1.80 1890
0.97128 1.90 1895
0.97725 2.00 1900
0.98214 2.10 1905
0.98610 2.20 1910
0.98928 2.30 1915
0.99180 2.40 1920
0.99379 2.50 1925
0.99952 3.30 1965
0.99966 3.40 1970
0.99977 3.50 1975
0.99984 3.60 1980
0.99989 3.70 1985
0.99993 3.80 1990
0.99995 3.90 1995
0.99997 4.00 2000