c. There is a lot of variability of the sample mean values on the run chart; however. no patterns
exist that would indicate a lack of control. As long as the process remains centered near the
middle of the specifications, the output should meet specifications nearly all the time.
25. Twenty-five samples of size 4 resulted in statistics of
x
= 38.0 minutes and
R
= 3.0
minutes for the Turkmaster Cleaning Company’s average time to completely clean a rug.
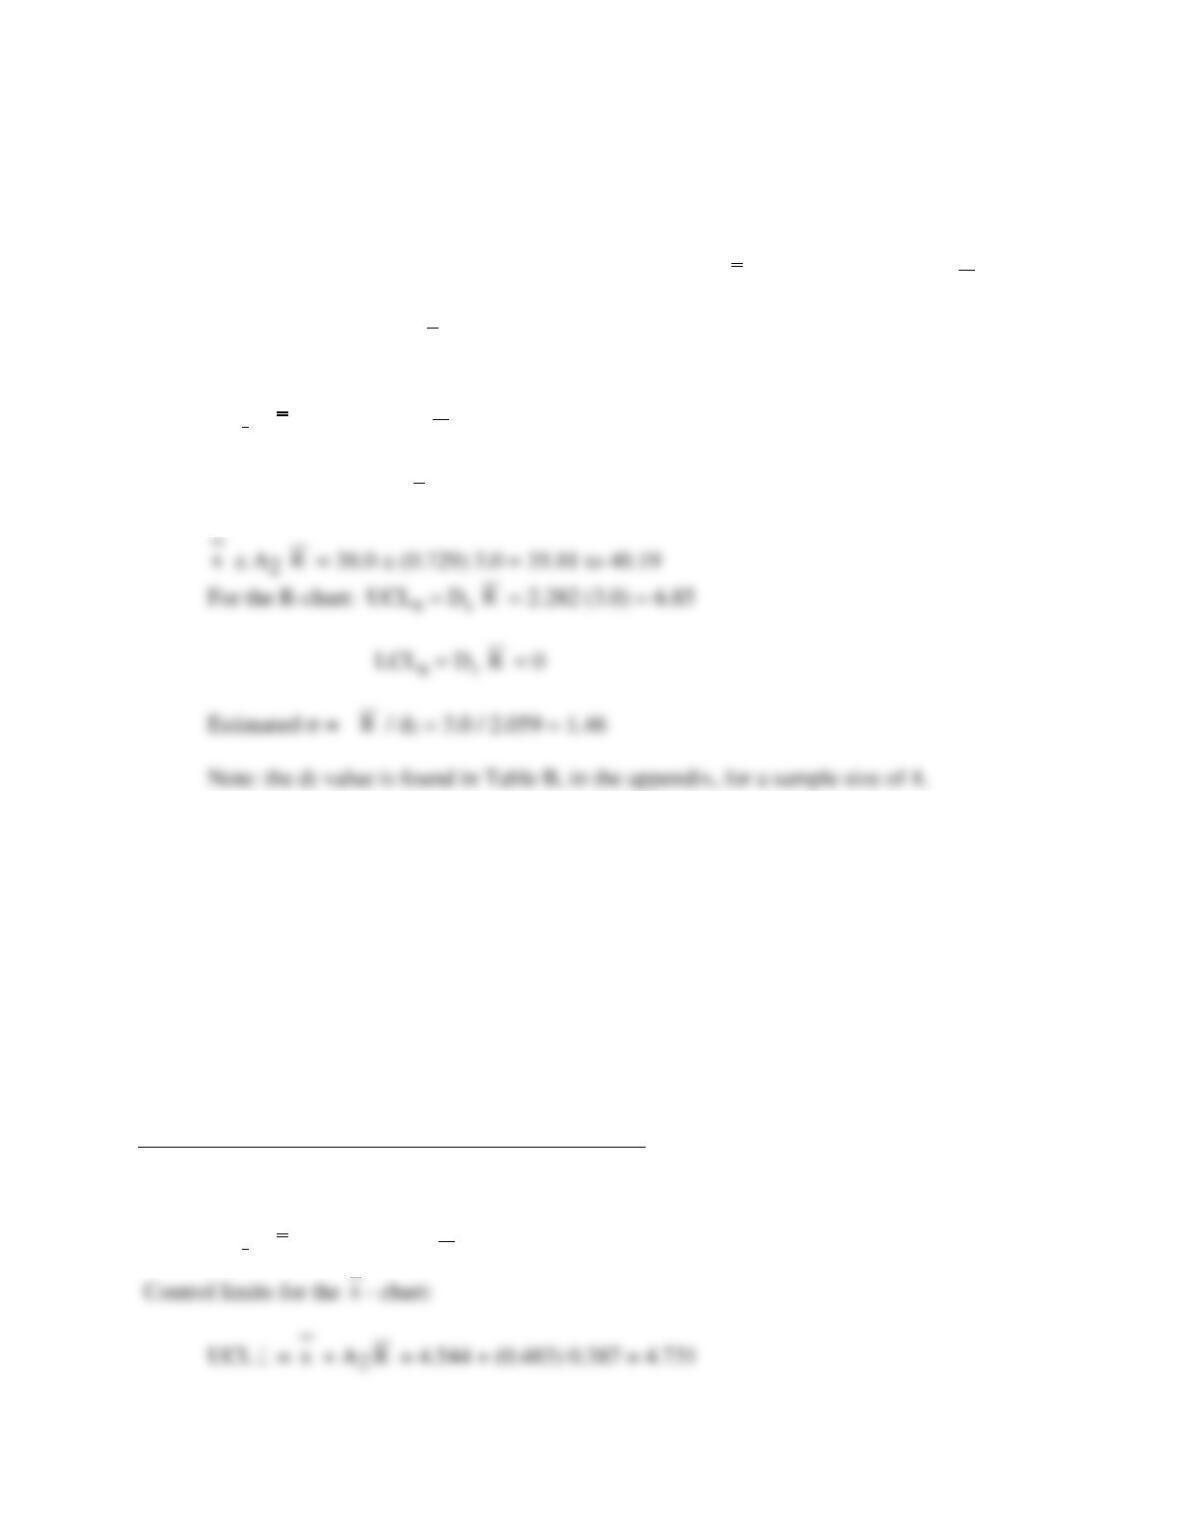
Compute control limits for
x
– and R-charts and estimate the standard deviation of the
process.
CL
x
:
x
= 38.0; CLR :
R
= 3.0
Control limits for the
x
– chart are:
26. After some further analysis, River Bottom Fire Department (Problem 8-22) relocated
one of their fire stations. After doing so, they wanted to evaluate response times to
determine whether or not the response process was in control. Thirty new samples were
taken on consecutive days from the 6 stations. These data can be found in the C08 Problem
Data workbook.
a. Compute the mean and range of each sample and calculate control limits for x-bar and R
charts using the appropriate formulas. Verify your results by using the Xbar&R Excel
template.
b. From the charts constructed in the Excel template, does the process appear to be in
statistical control?
See Excel file Problem 8.26 in the instructor materials.
a. Calculations:
Center lines:
CL
x
:
x
= 4.544; CLR:
R
= 0.387
x
R
R
R
LCL
x
=
x
– A2
R
= 4.544 – (0.483) 0.387 = 4.357
Control limits for the R-chart:
UCLR = D4
R
= (2.004) 0.387= 0.776
LCLR = D3
R
= 0
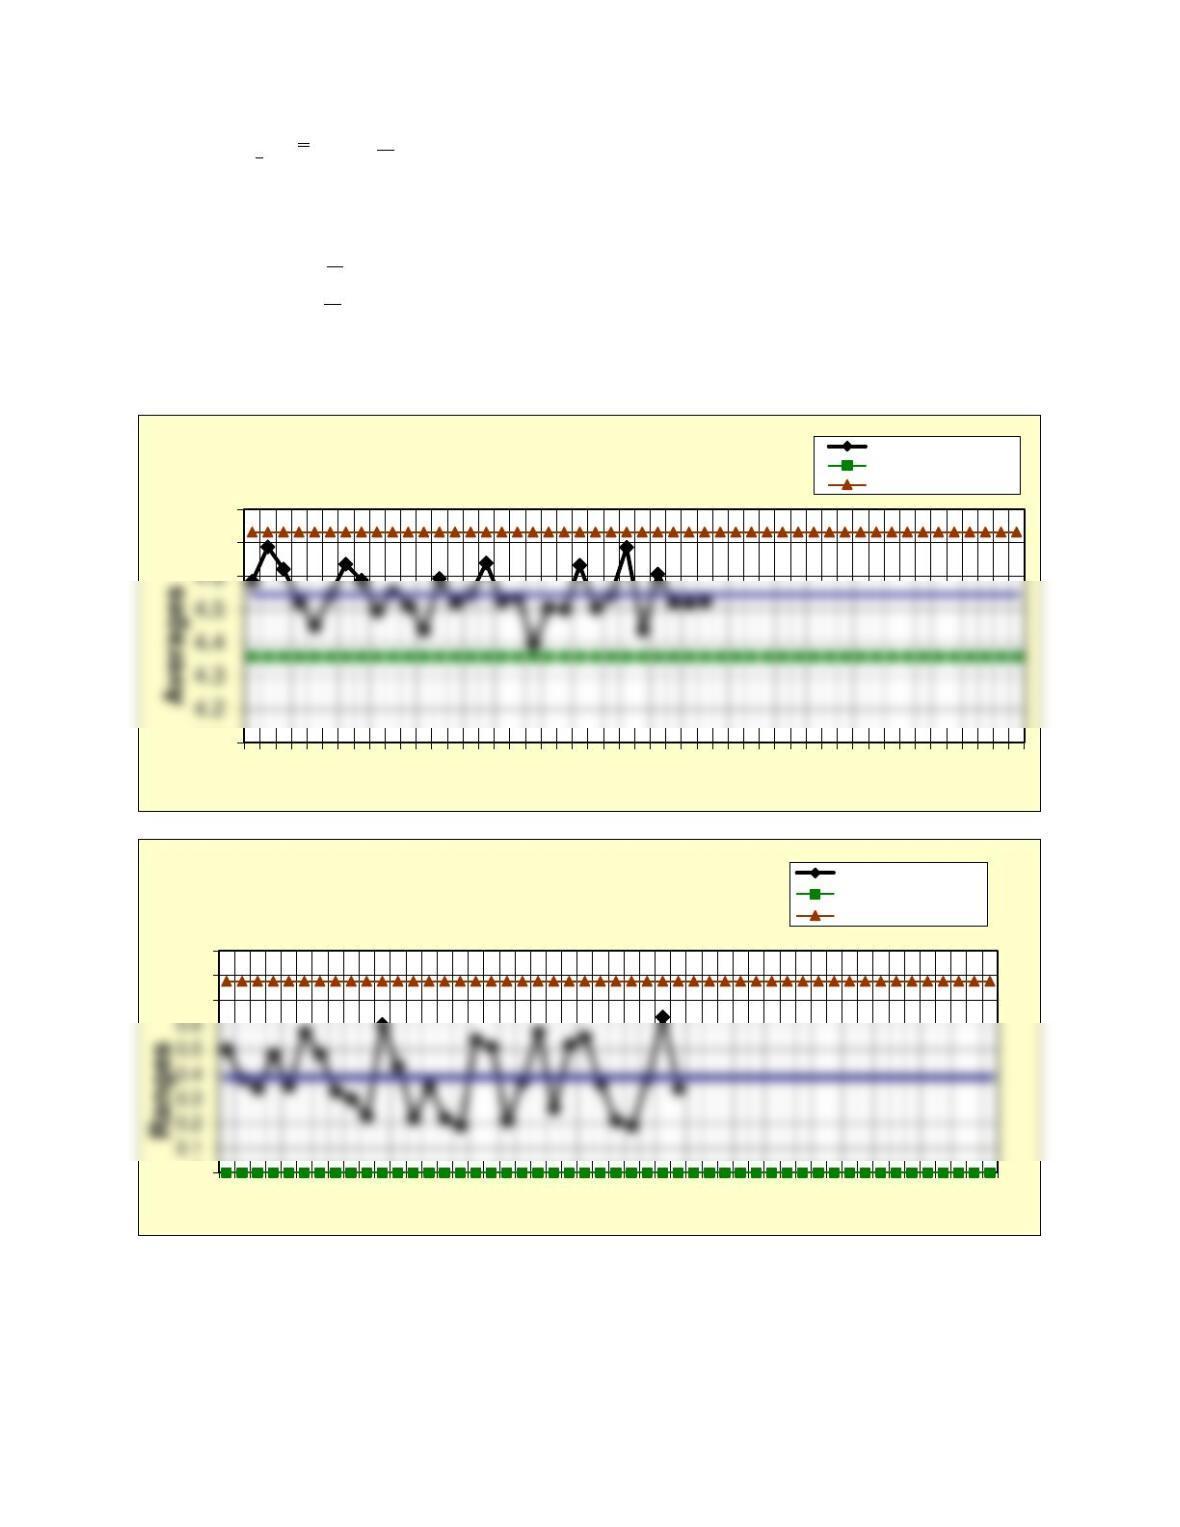
b. Both charts appear to be in control:
27. J. McWilliams Swim Club is trying to calibrate their chlorine pump to ensure that the
right amount of chlorine (1.0–1.5 ppm of free chlorine) is mixed into the water. Thirty
4.1
4.7
4.8
1 3 5 7 9 11 13 15 17 19 21 23 25 27 29 31 33 35 37 39 41 43 45 47 49
Sample number
Prob. 8-26 – X-bar Chart
Averages
Lower control limit
Upper control limit
0
0.7
0.8
0.9
1 3 5 7 9 11 13 15 17 19 21 23 25 27 29 31 33 35 37 39 41 43 45 47 49
Sample number
Prob. 8-26 – R-Chart
Ranges
Lower control limit
Upper control limit
samples of four readings at random times during the week were taken. These data can be
found in the C08 Problem Data workbook.
a. Compute the mean and range of each sample and calculate control limits for x-bar and R
charts using the appropriate formulas. Verify your results by using the Xbar&R Excel
template.
b. From the charts constructed in the Excel template, does the process appear to be in
statistical control?
See Excel file Problem 8.27 in the instructor materials.
a. Calculations
Center Lines:
Control limits for the
x
– chart:
UCL
x
=
x
+ A2
R
= 1.241 + (0.729) 0.096 = 1.311
R
For the R-chart:
UCLR = D4
R
= (2.282) 0.096 = 0.219
R
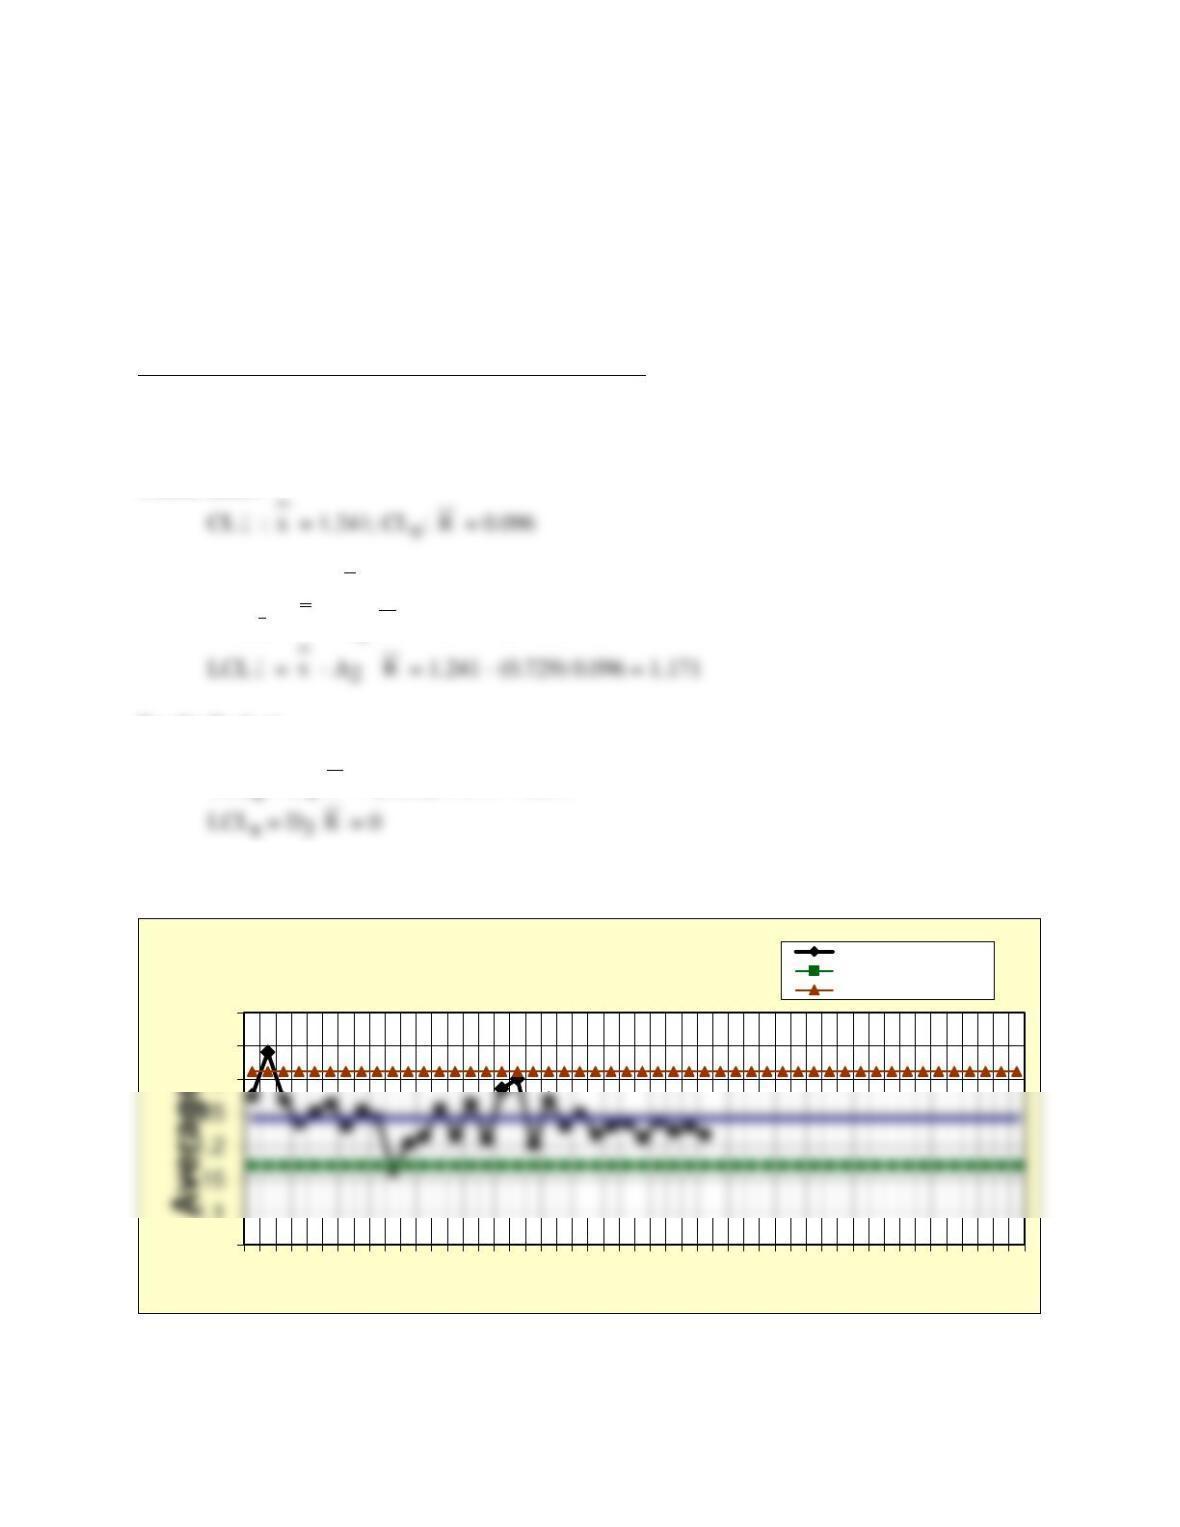
b. Charts are shown next.
1.05
1.1
1.3
1.35
1.4
1 3 5 7 9 11 13 15 17 19 21 23 25 27 29 31 33 35 37 39 41 43 45 47 49
Sample number
Prob. 8-27 X-bar Chart Averages
Lower control limit
Upper control limit
x
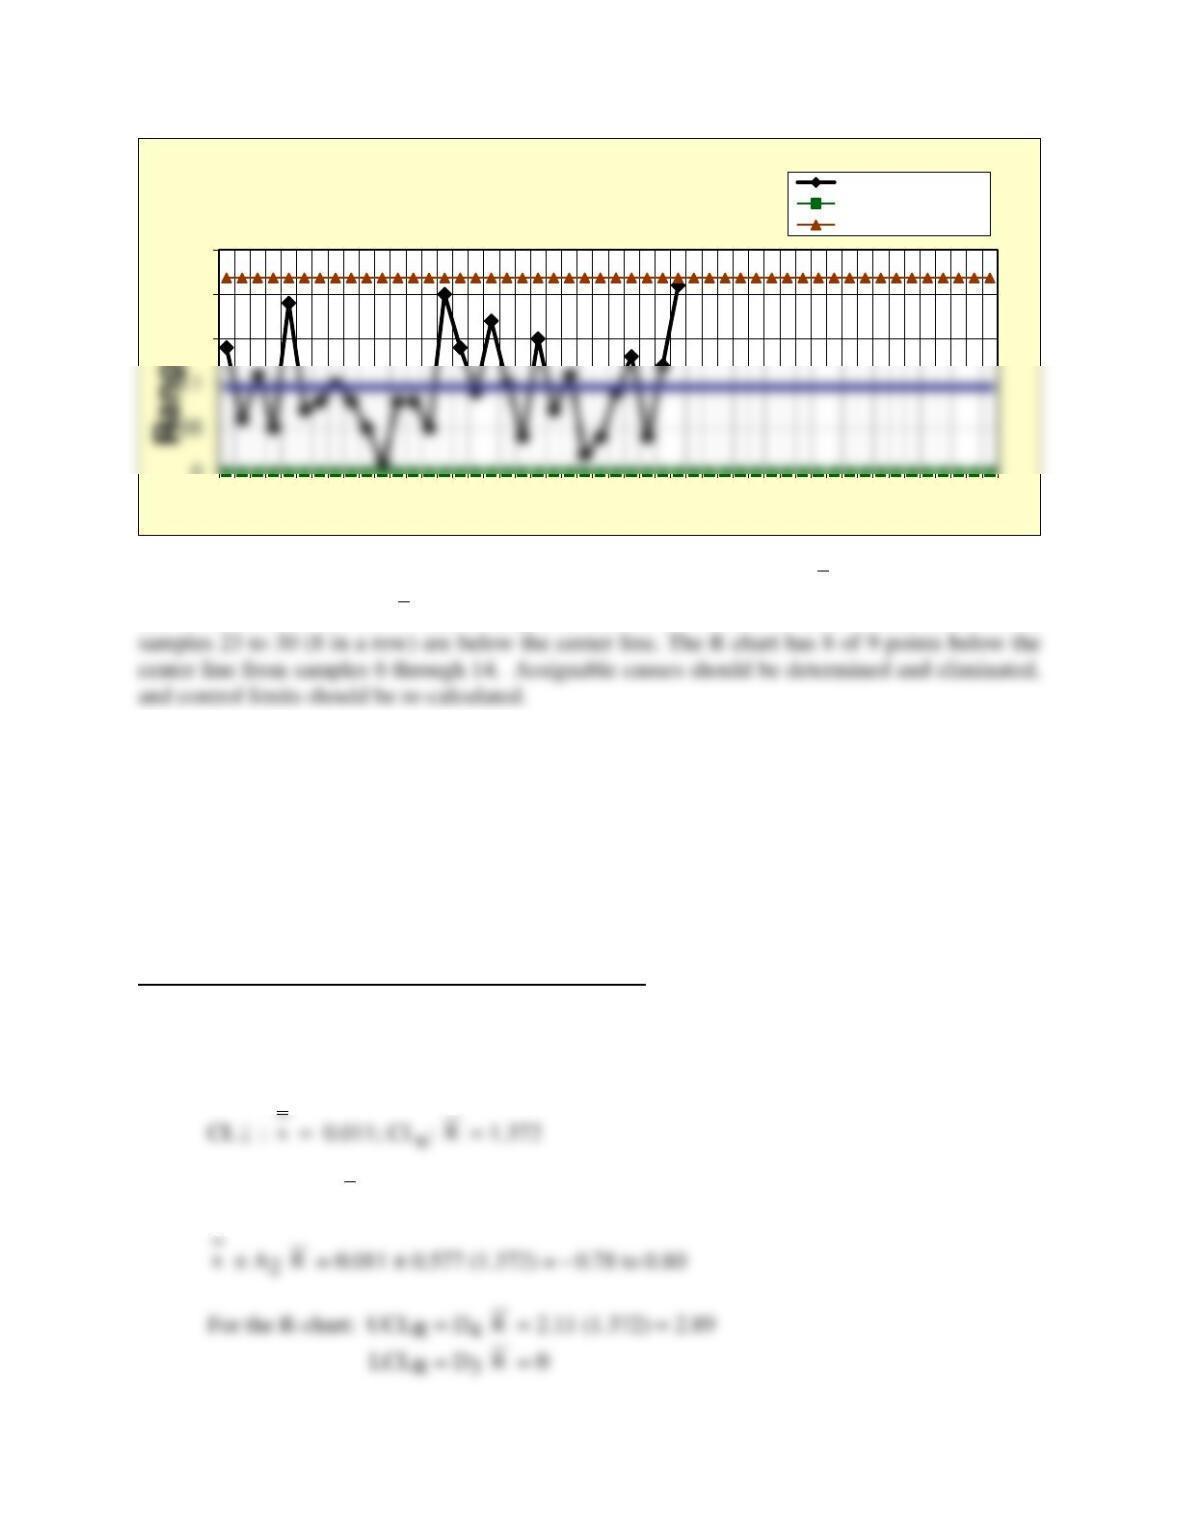
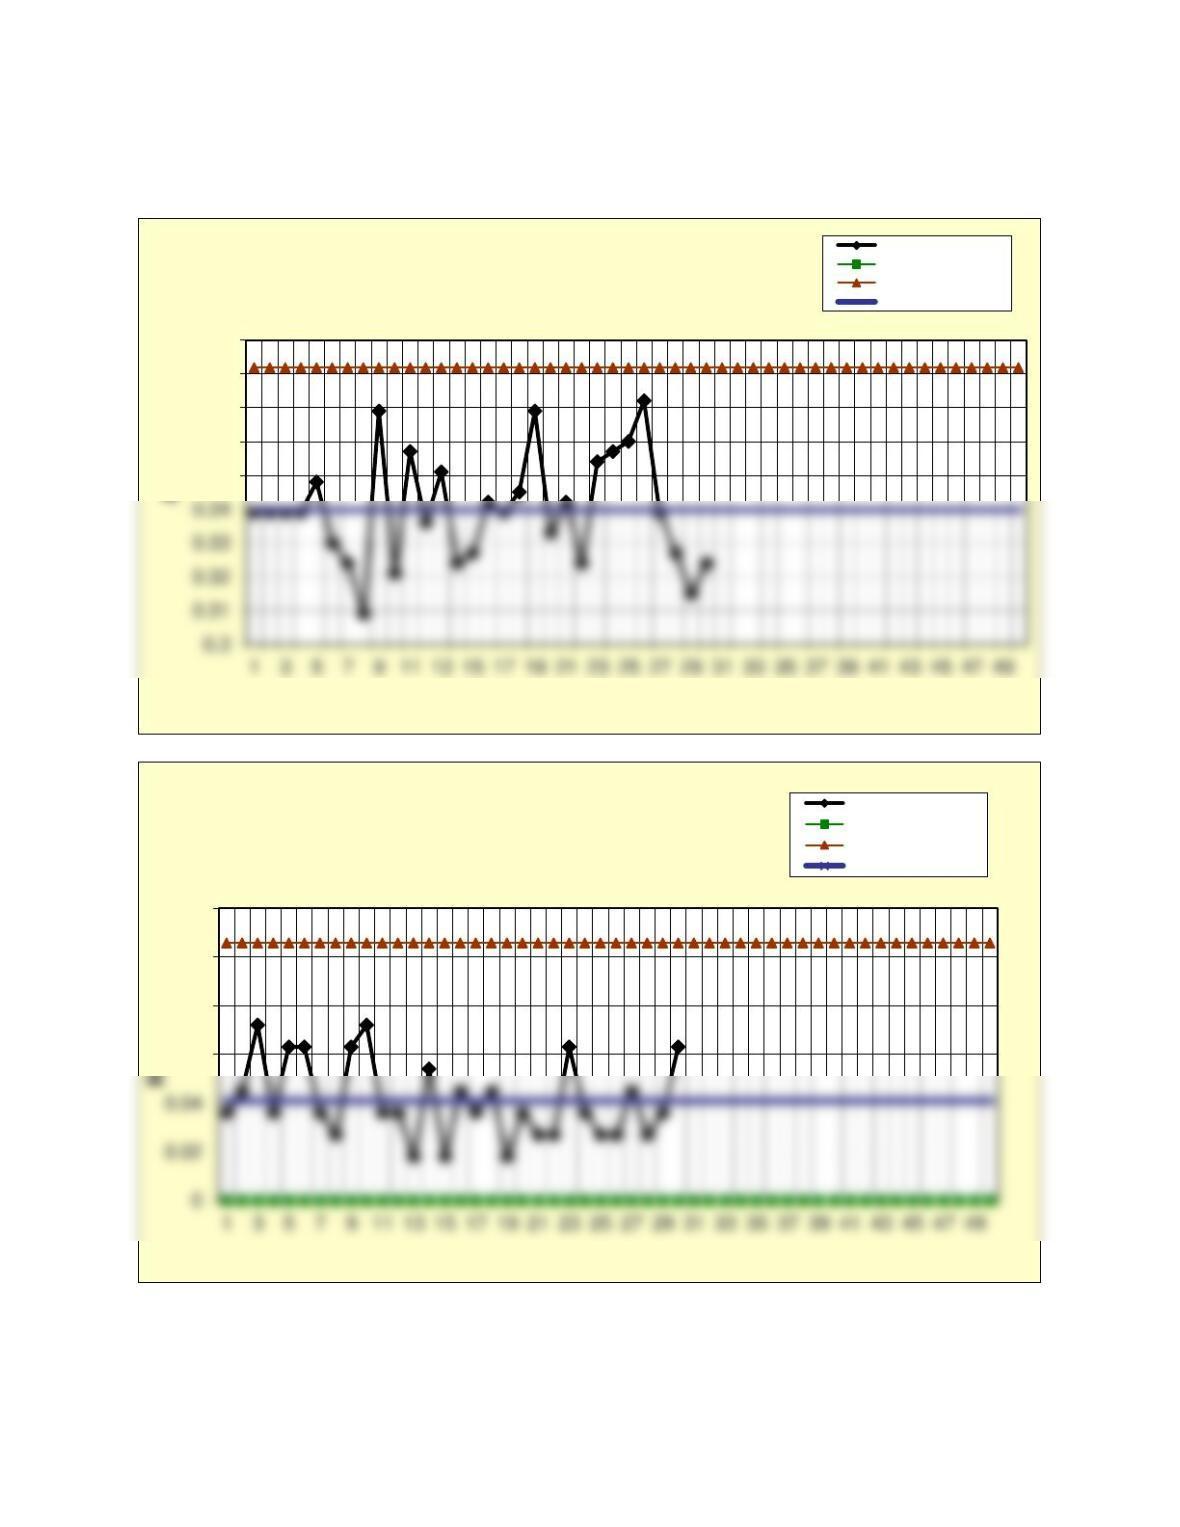
Interpretation of the control charts show that it is highly likely that the
x
chart and the R chart
are out of control. On the
x
chart, samples 2 and 10 are outside of their control limits. Also,
28. Hermitage DNA Labs, LLC collected temperature readings in an analysis process. The
data can be found in the C08 Problem Data workbook.
a. Compute the mean and range of each sample and calculate control limits for x-bar and R
charts using the appropriate formulas. Verify your results by using the Xbar&R Excel
template.
b. From the charts constructed in the Excel template, does the process appear to be in
statistical control?
See Excel file Problem 8.28 in the instructor materials.
a. Calculations
Center Lines:
Control limits for the
x
– chart:
0
0.15
0.2
0.25
1 3 5 7 9 11 13 15 17 19 21 23 25 27 29 31 33 35 37 39 41 43 45 47 49
Sample number
Prob. 8-27 R-Chart Ranges
Lower control limit
Upper control limit
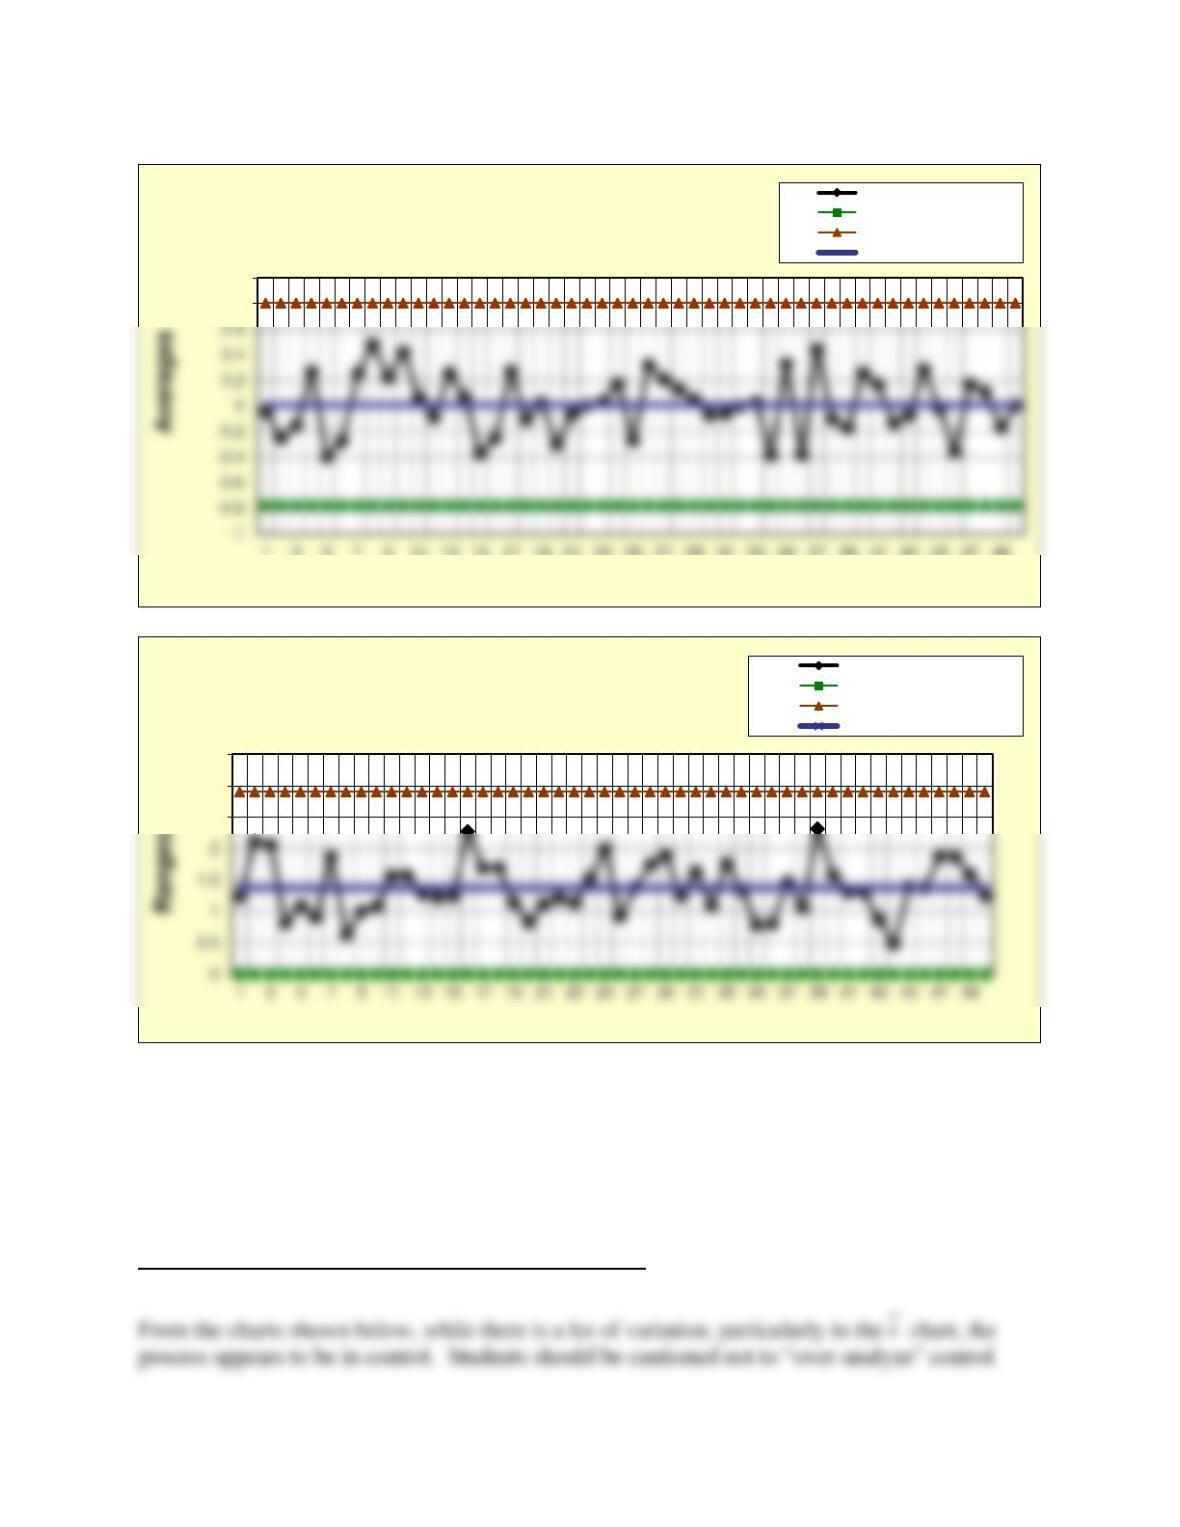
b. The charts appear to be in control.
29. Use the data for Birdseye Magnetronics (Problem 8.24) and the X-bar&R Excel
template to determine if the process appears to be in statistical control.
See Excel file Problem 8.29 in the instructor materials.
0.8
1
1357911 13 15 17 19 21 23 25 27 29 31 33 35 37 39 41 43 45 47 49
Sample number
Prob. 8-28 X-bar Chart
Averages
Lower control limit
Upper control limit
Center line
2.5
3
3.5
Sample number
Prob. 8-28 R-Chart
Ranges
Lower control limit
Upper control limit
Center line
charts and understand that short term patterns (such as in samples 1-4) can, in fact, happen as a
result of randomness.
0.35
0.36
0.37
0.38
0.39
Sample number
Prob. 8-29 X-bar Chart
Averages
Lower control limit
Upper control limit
Center line
0.06
0.08
0.1
0.12
Sample number
Prob 8-29 R-Chart
Ranges
Lower control limit
Upper control limit
Center line
30. The initial data provided in the Excel workbook C08 Problem Data represent
processing time values for 20 samples of size 4 that were taken from Rapid Check Kiters,
Inc., a check processing firm, over a 20-hour period.
See Excel file Problem 8.30 in the instructor materials.
a. Use the X-bar&R Excel template to determine if the process under control. If not,
remove any special cause data and recalculate the control limits.
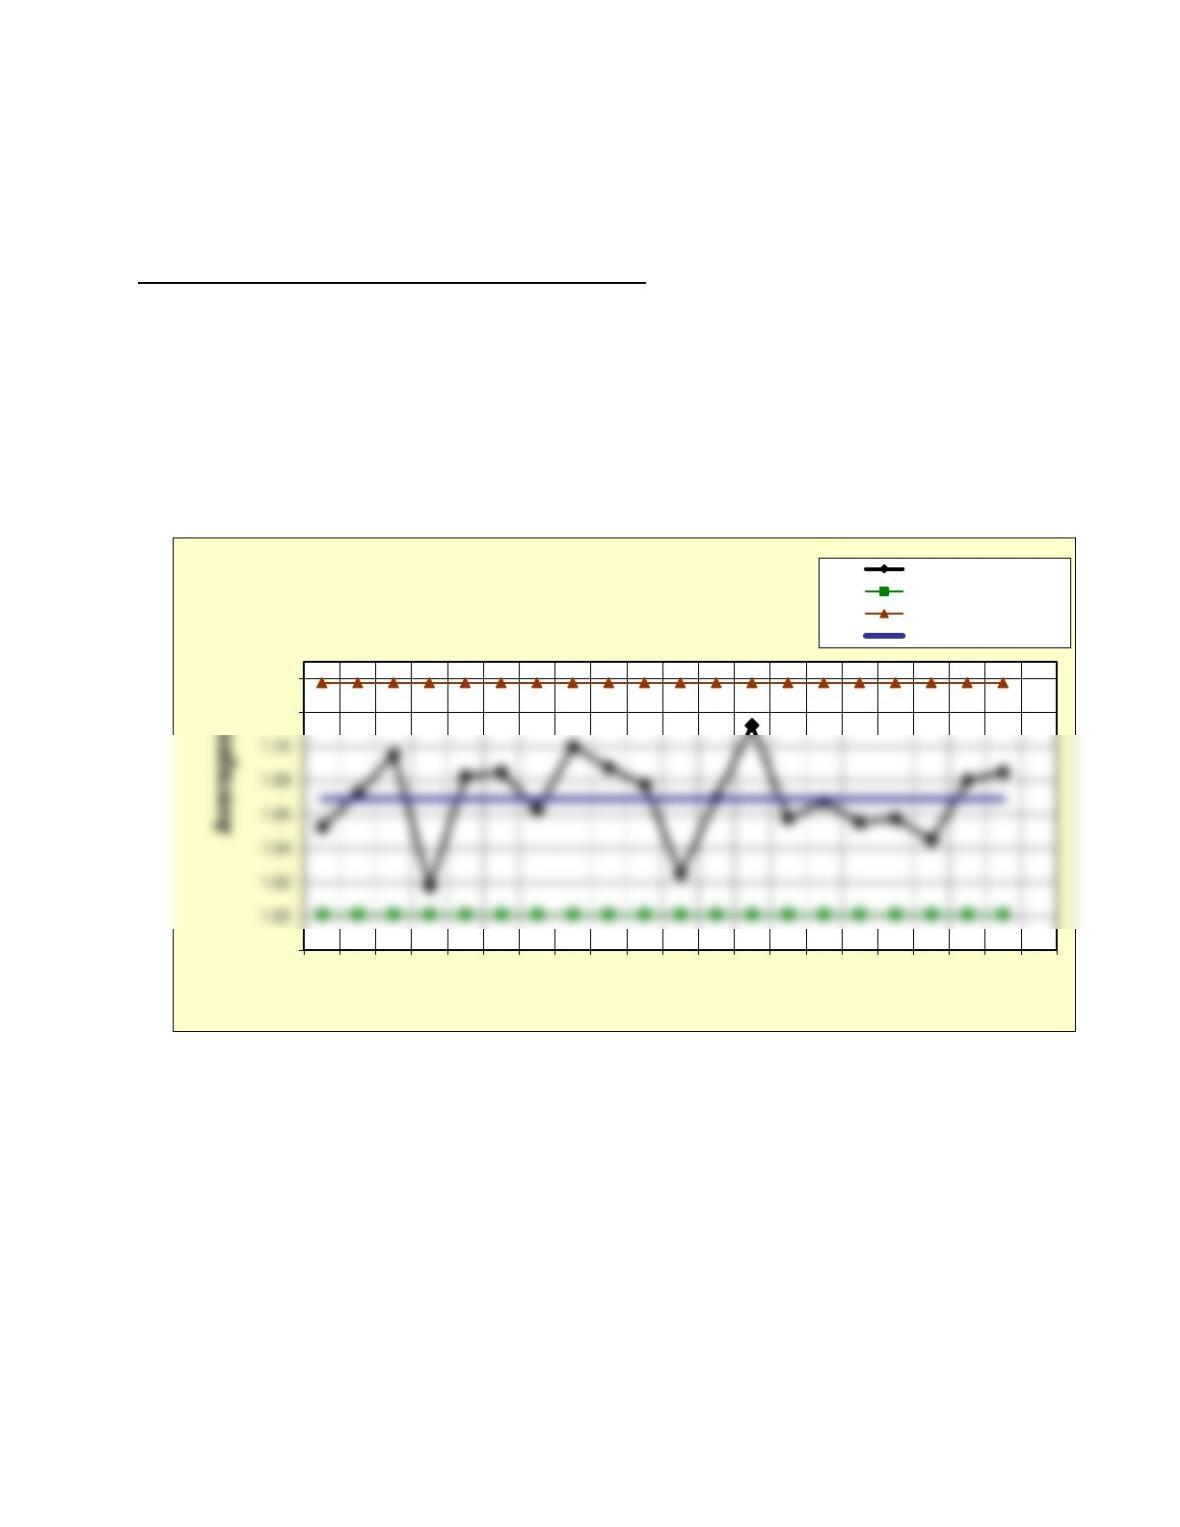
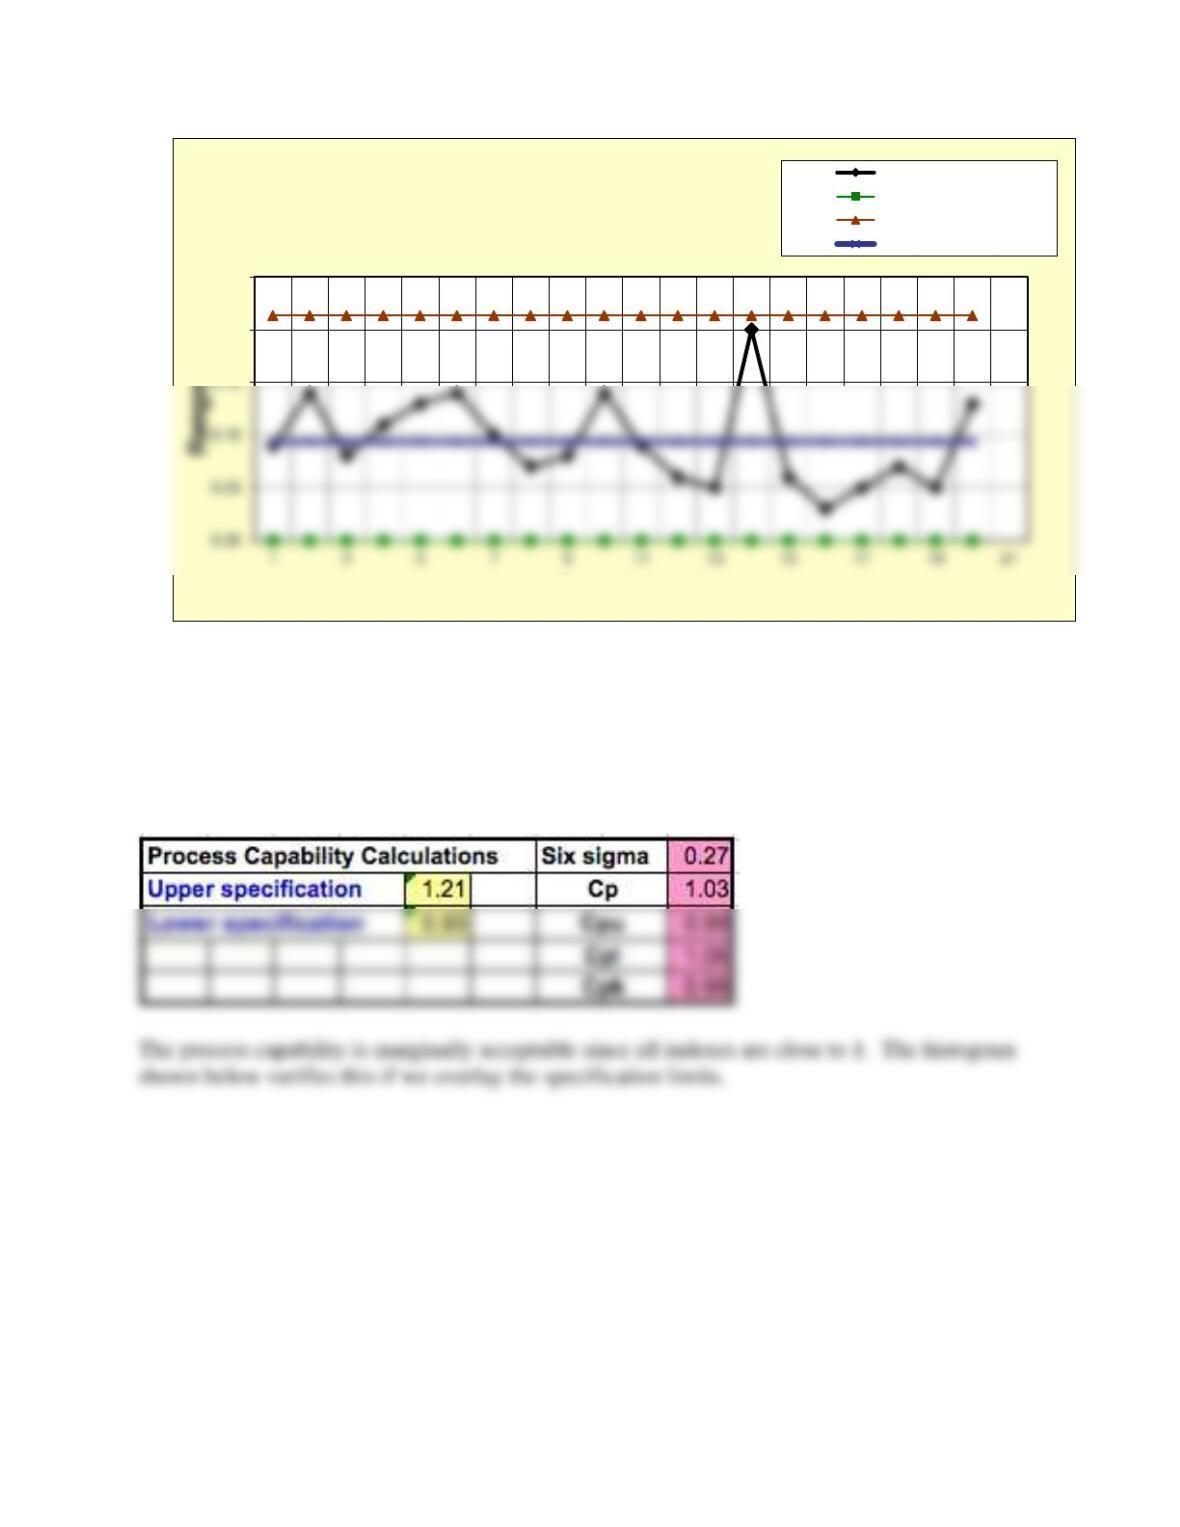
The x-bar and R charts are shown below. The process appears to be in control, and no further
adjustments are necessary.
0.98
1.12
1.14
1 3 5 7 9 11 13 15 17 19 21
Sample number
Prob. 8-30A X-bar Chart
Averages
Lower control limit
Upper control limit
Center line
b. Specifications for the process are 1.065 ± 0.14. If the process is under control, find the
capability indexes Cpu, Cpl, Cp, and Cpk within the Excel template, and verify them
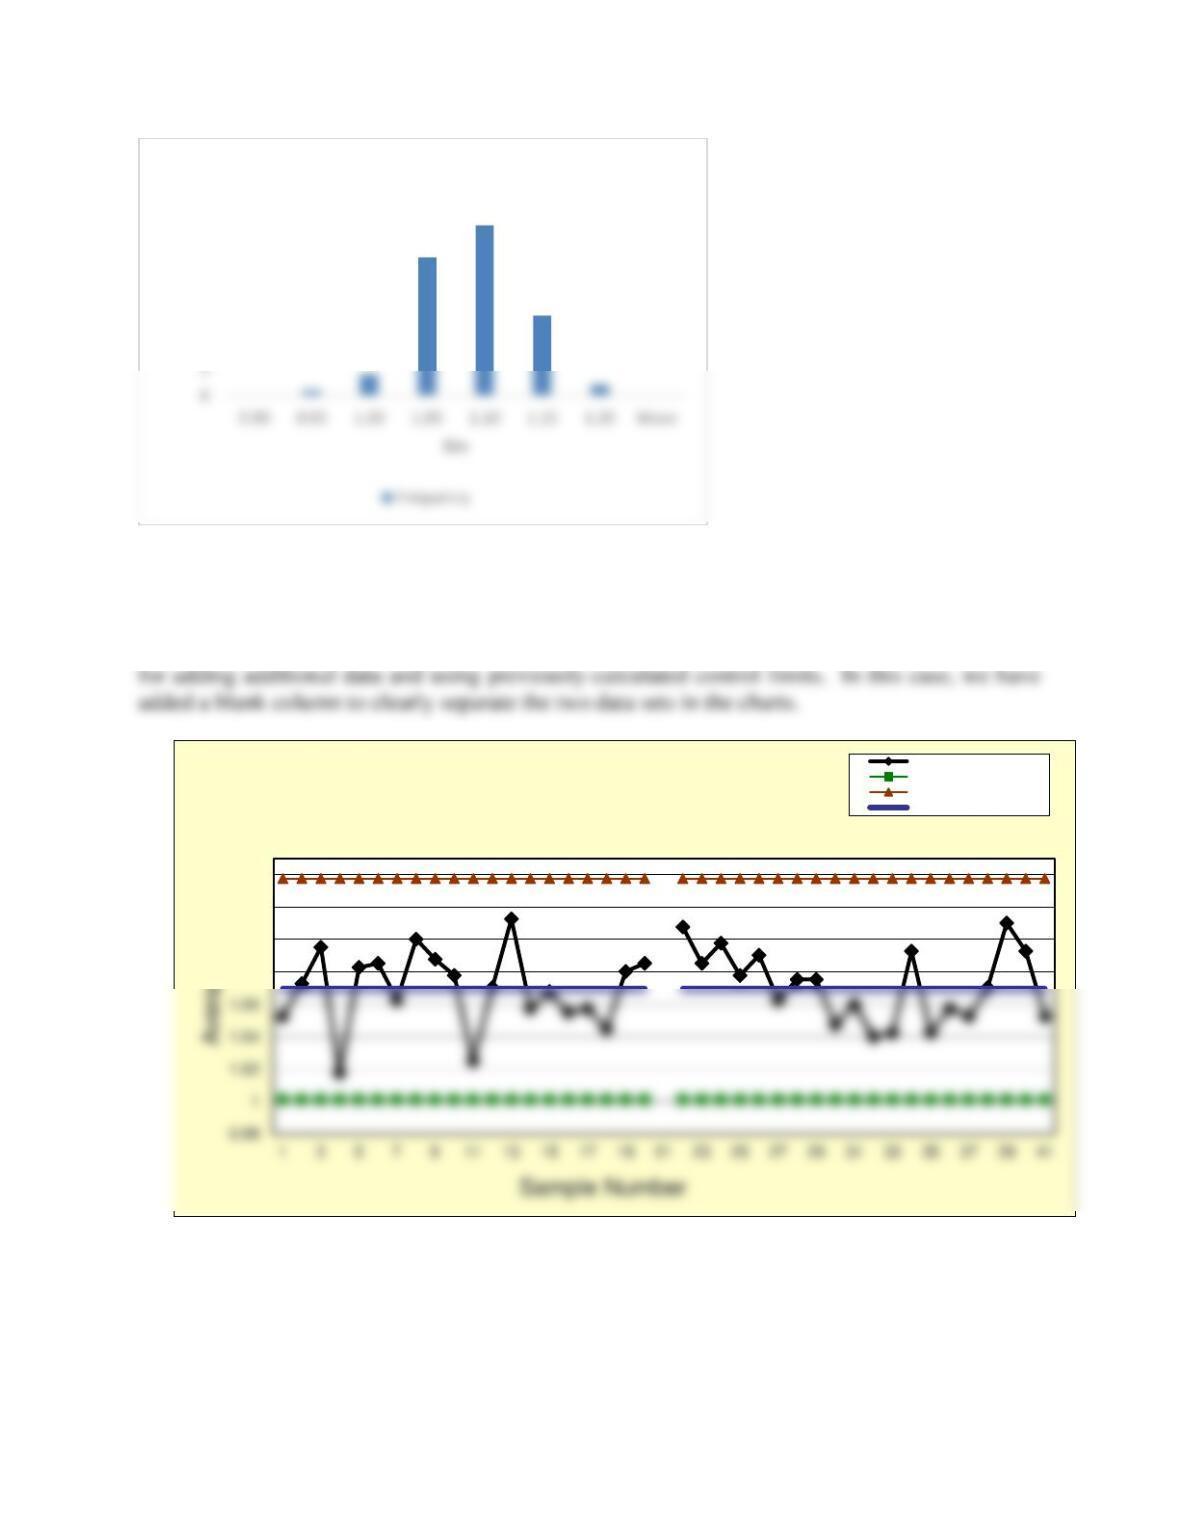
visually by creating a histogram. What do the indexes indicate?
After entering the specification limits, we obtained:
0.20
0.25
Sample number
Prob. 8-30 A R-Chart
Ranges
Lower control limit
Upper control limit
Center line
c. After establishing the control limits, the new data were collected. Use the control chart
template to plot these using the control limits from part a. Interpret the control charts.
Instructors should ensure that students have read the sidebar regarding modifying the template
10
15
20
25
30
35
Frequency
Histogram
1.08
1.1
1.12
1.14
Prob. 8-30c X-bar Chart
Averages
Lower control limit
Upper control limit
Center line
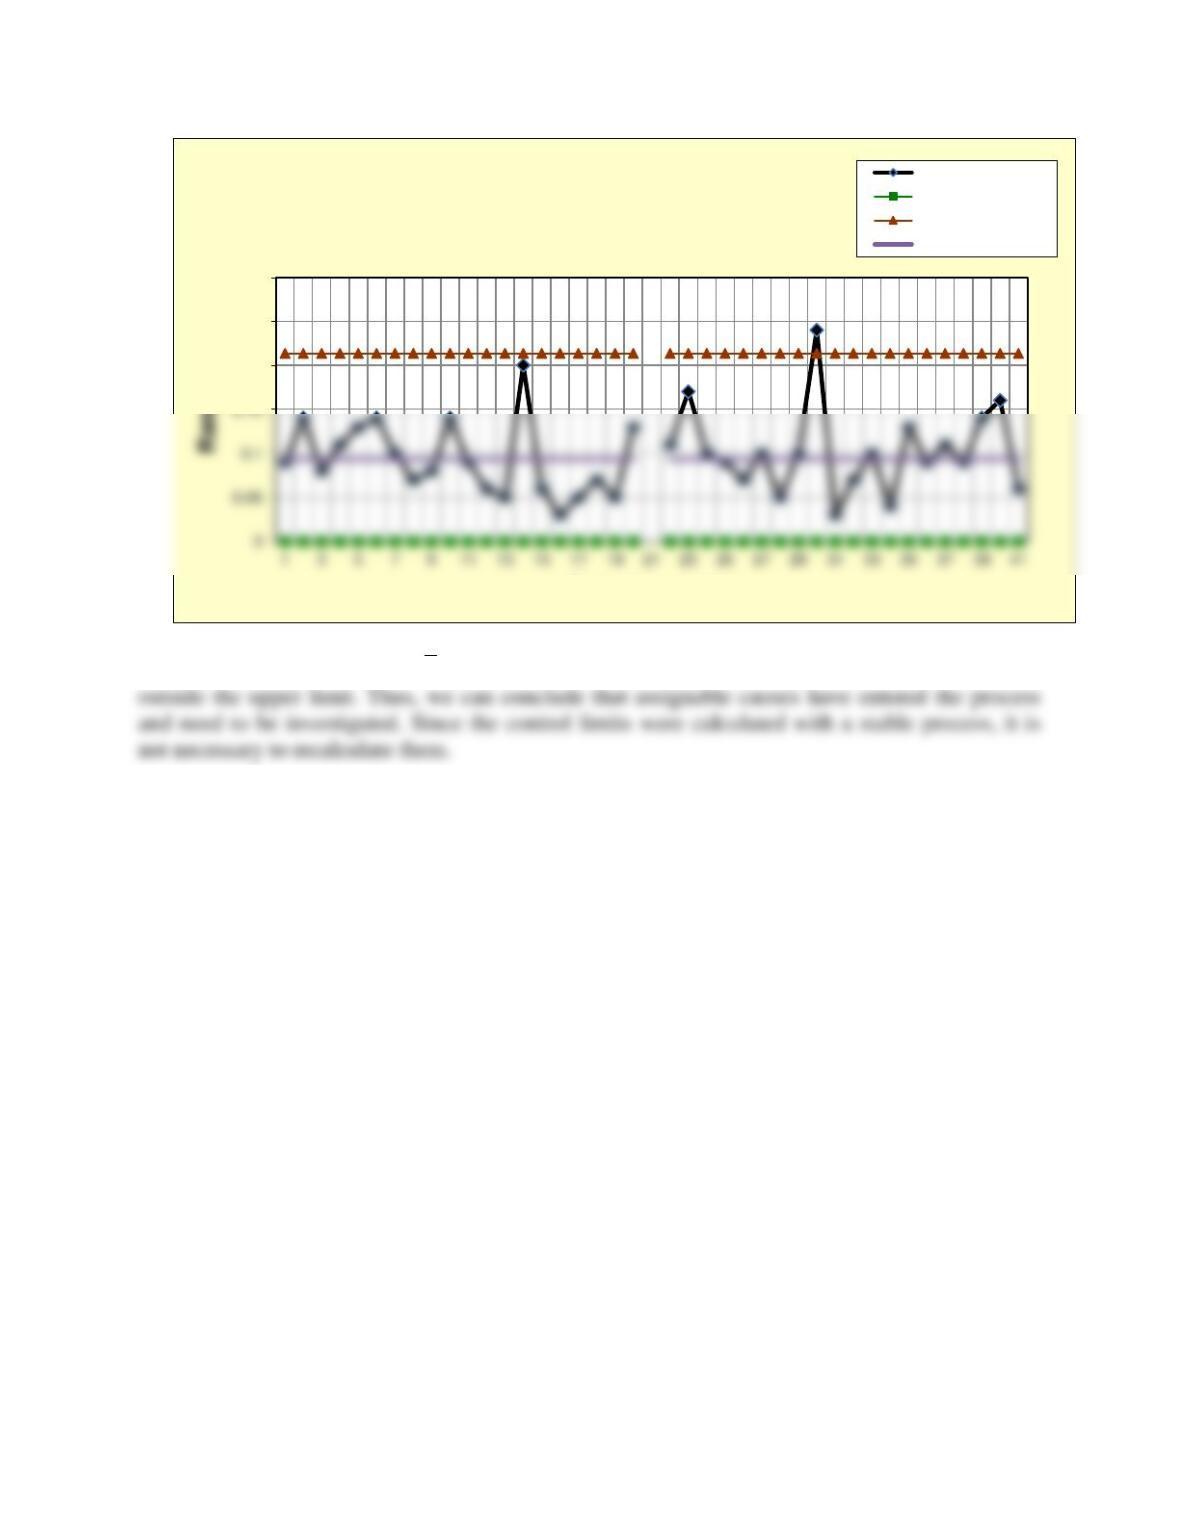
Points 21 through 32 on the
x
-chart show a downward trend and point 29 on the R-chart is
31. For each of the following control charts, assume that the process has been operating
in statistical control for some time. What conclusions should the operators reach at this
point?
0.2
0.25
0.3
Sample number
Prob. 8-30c R-Chart
Ranges
Lower control limit
Upper control limit
Center line
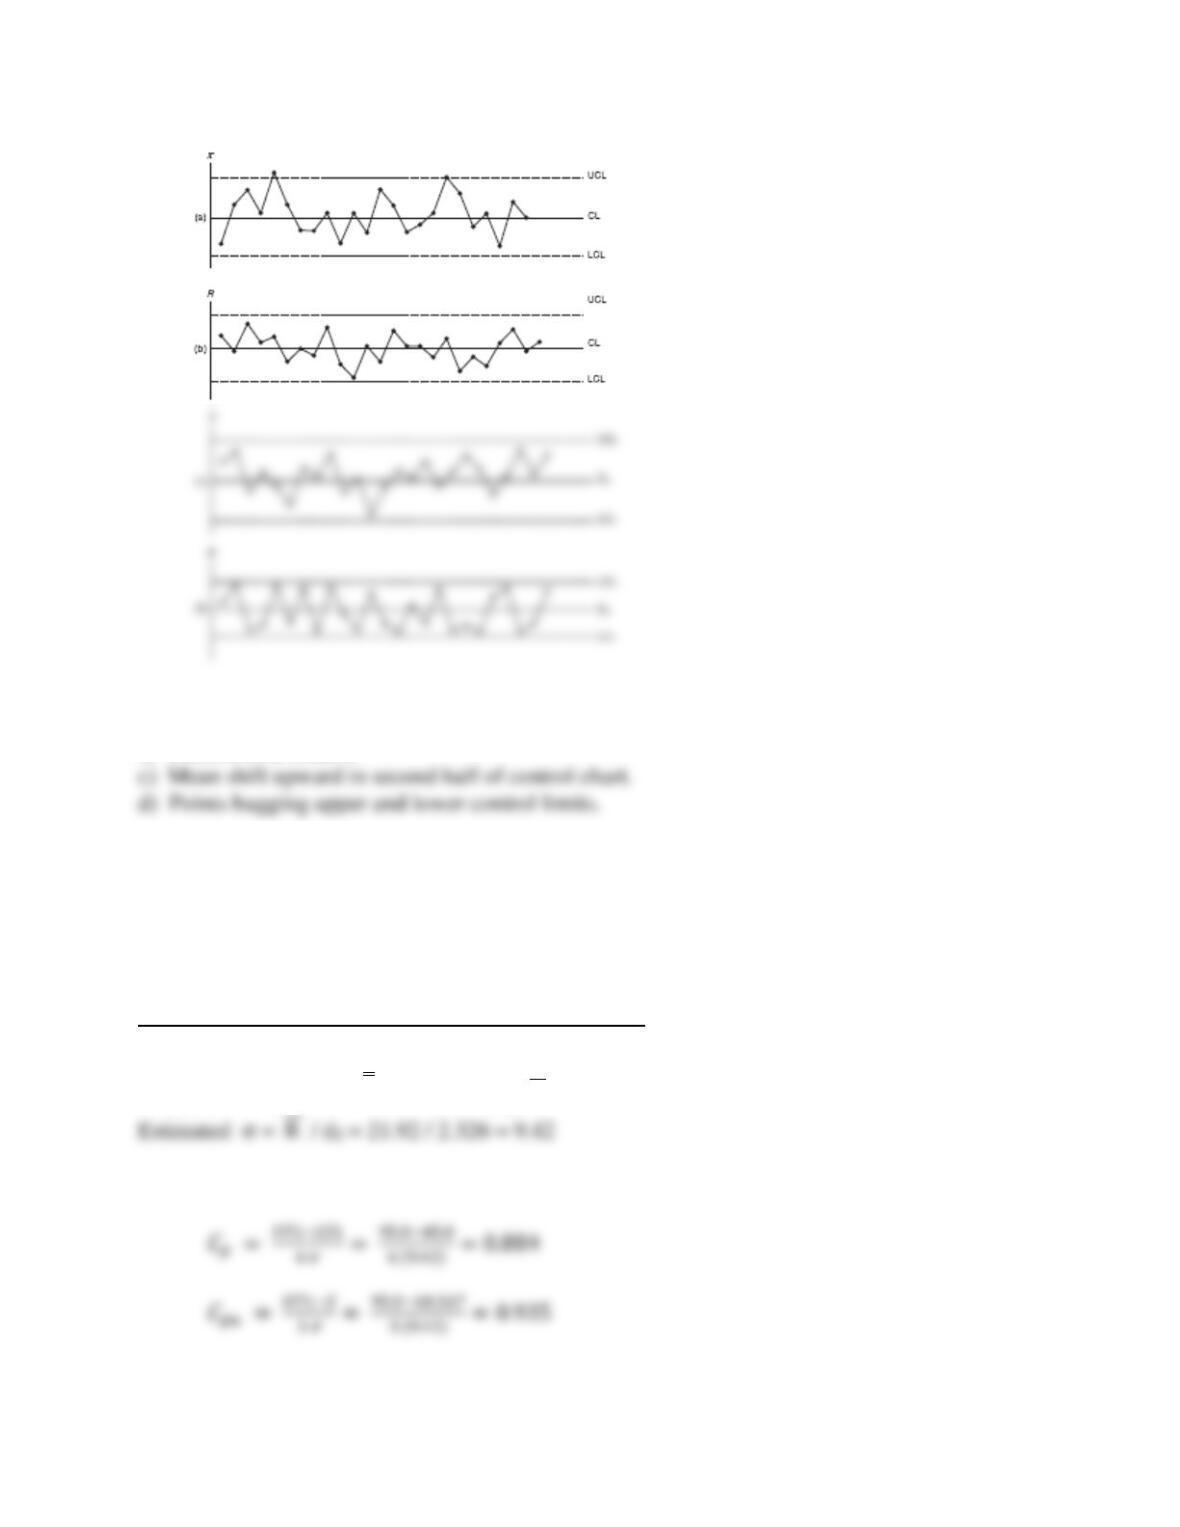
a) Two points outside upper control limit.
b) Process is in control
32. PCDrives has a statistically in-control manufacturing process that is normally
distributed. Sample means and ranges for 15 samples of size 5 can be found in the C08
Problem Data workbook. Determine process capability indexes by estimating the standard
deviation using formula (8.34). If the specifications are 70 ± 25, what percentage will be out
of specification?
See Excel file Problem 8.32 in the instructor materials.
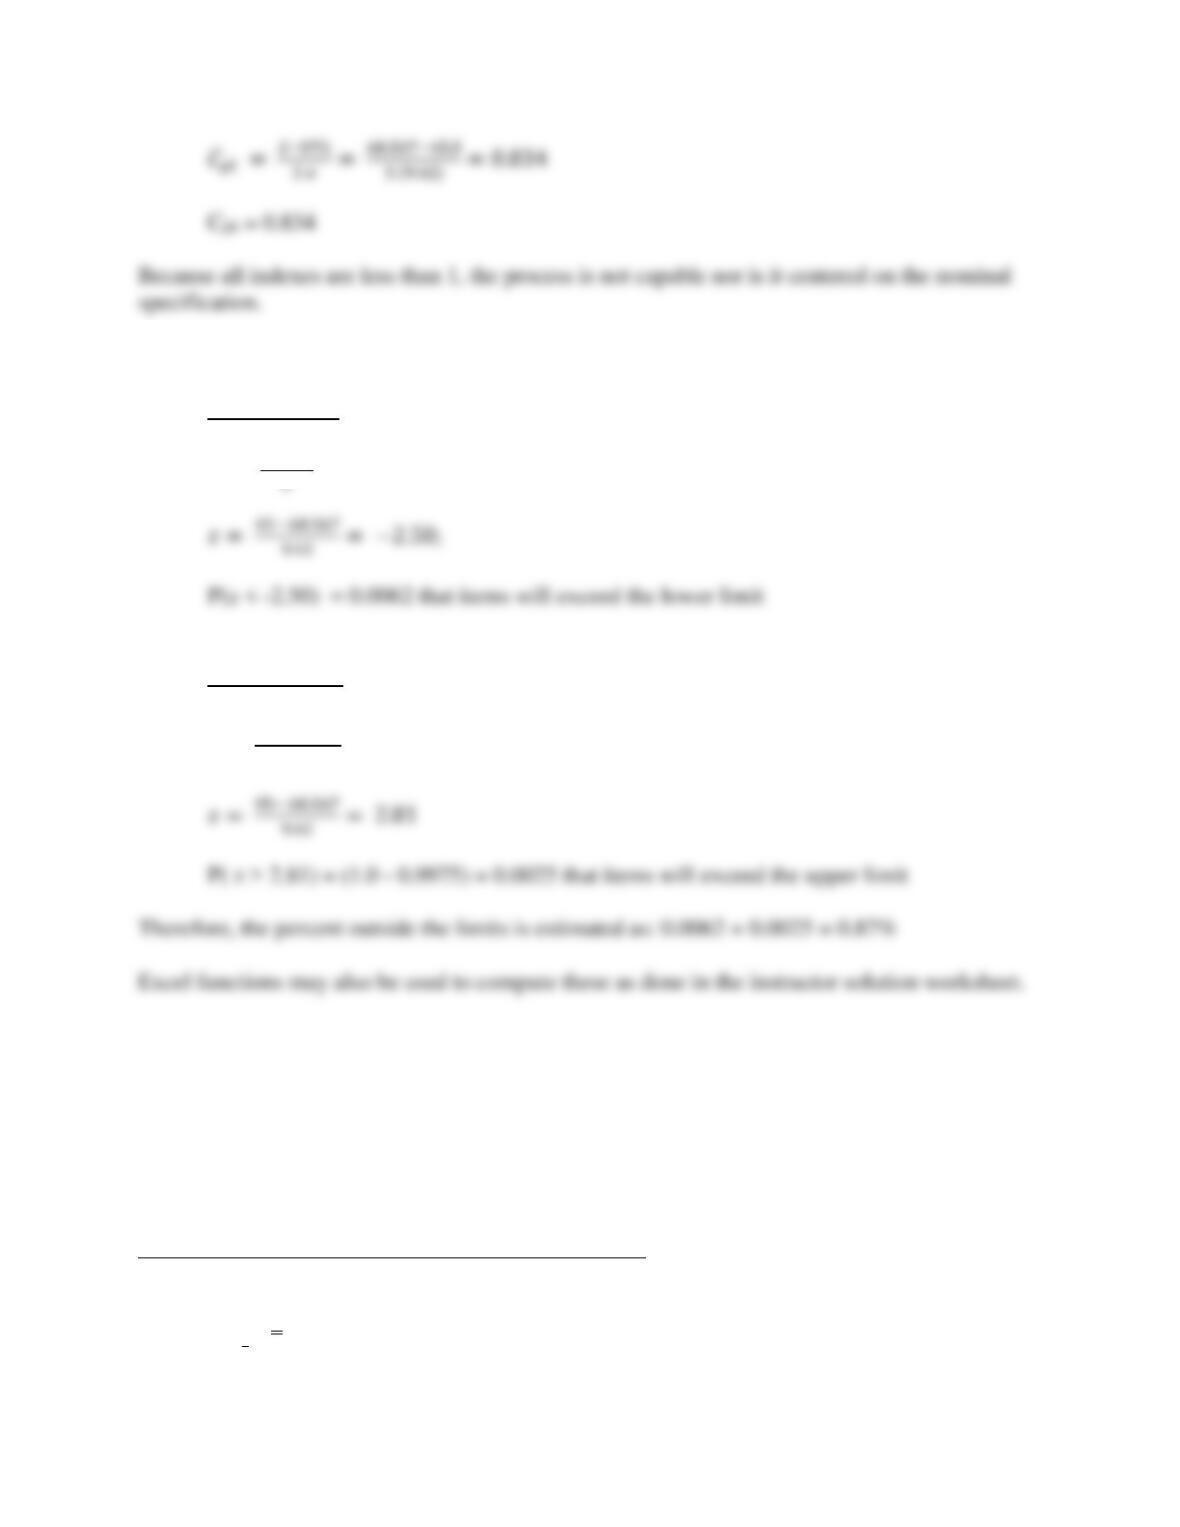
Using the data, we find
x
= 68.567; CLR:
R
= 21.92
To find the percent outside specification limits (45 to 95), use normal distribution calculations.
% Below LSL:
𝑧 = 𝐿𝑆𝐿− 𝑥̿
% Above USL:
𝑧 = 𝑈𝑆𝐿 − 𝑥̿
𝜎
33. Constant Hope Hospital wants to set up x-bar and s control charts for the time required
to perform a critical step in gall bladder surgery. Twenty-five samples of size 4 can be
found in the C08 Problem Data workbook. Find the control limits using the appropriate
formulas and then verify your calculations and create the charts using the Xbar&s Excel
template. What conclusions do you reach concerning the state of the process? Is it under
control? Why or why not?
See Excel file Problem 8.33 in the instructor materials.
Center lines:
CL
x
:
x
= 14.995
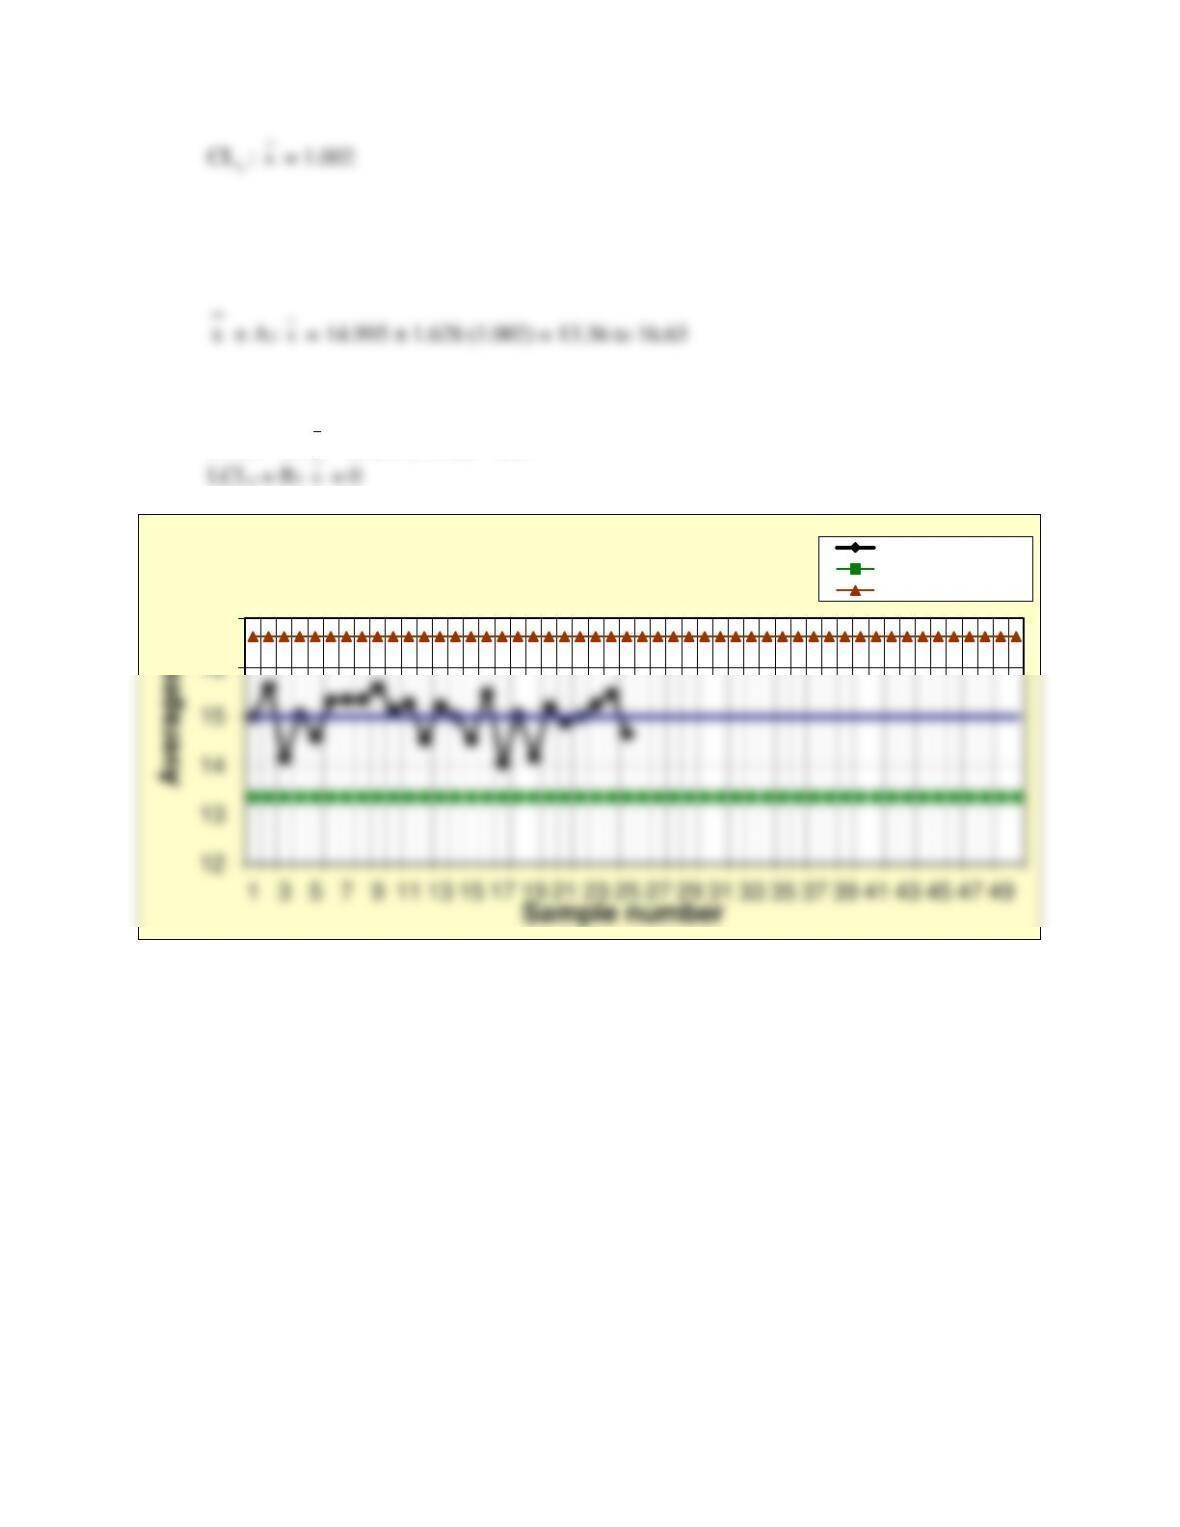
Control limits:
X-bar chart:
s-chart:
UCLs = B4
s
= 2.266 (1.002) = 2.27
17
Prob. 8-33 X-bar Chart Averages
Lower control limit
Upper control limit
s
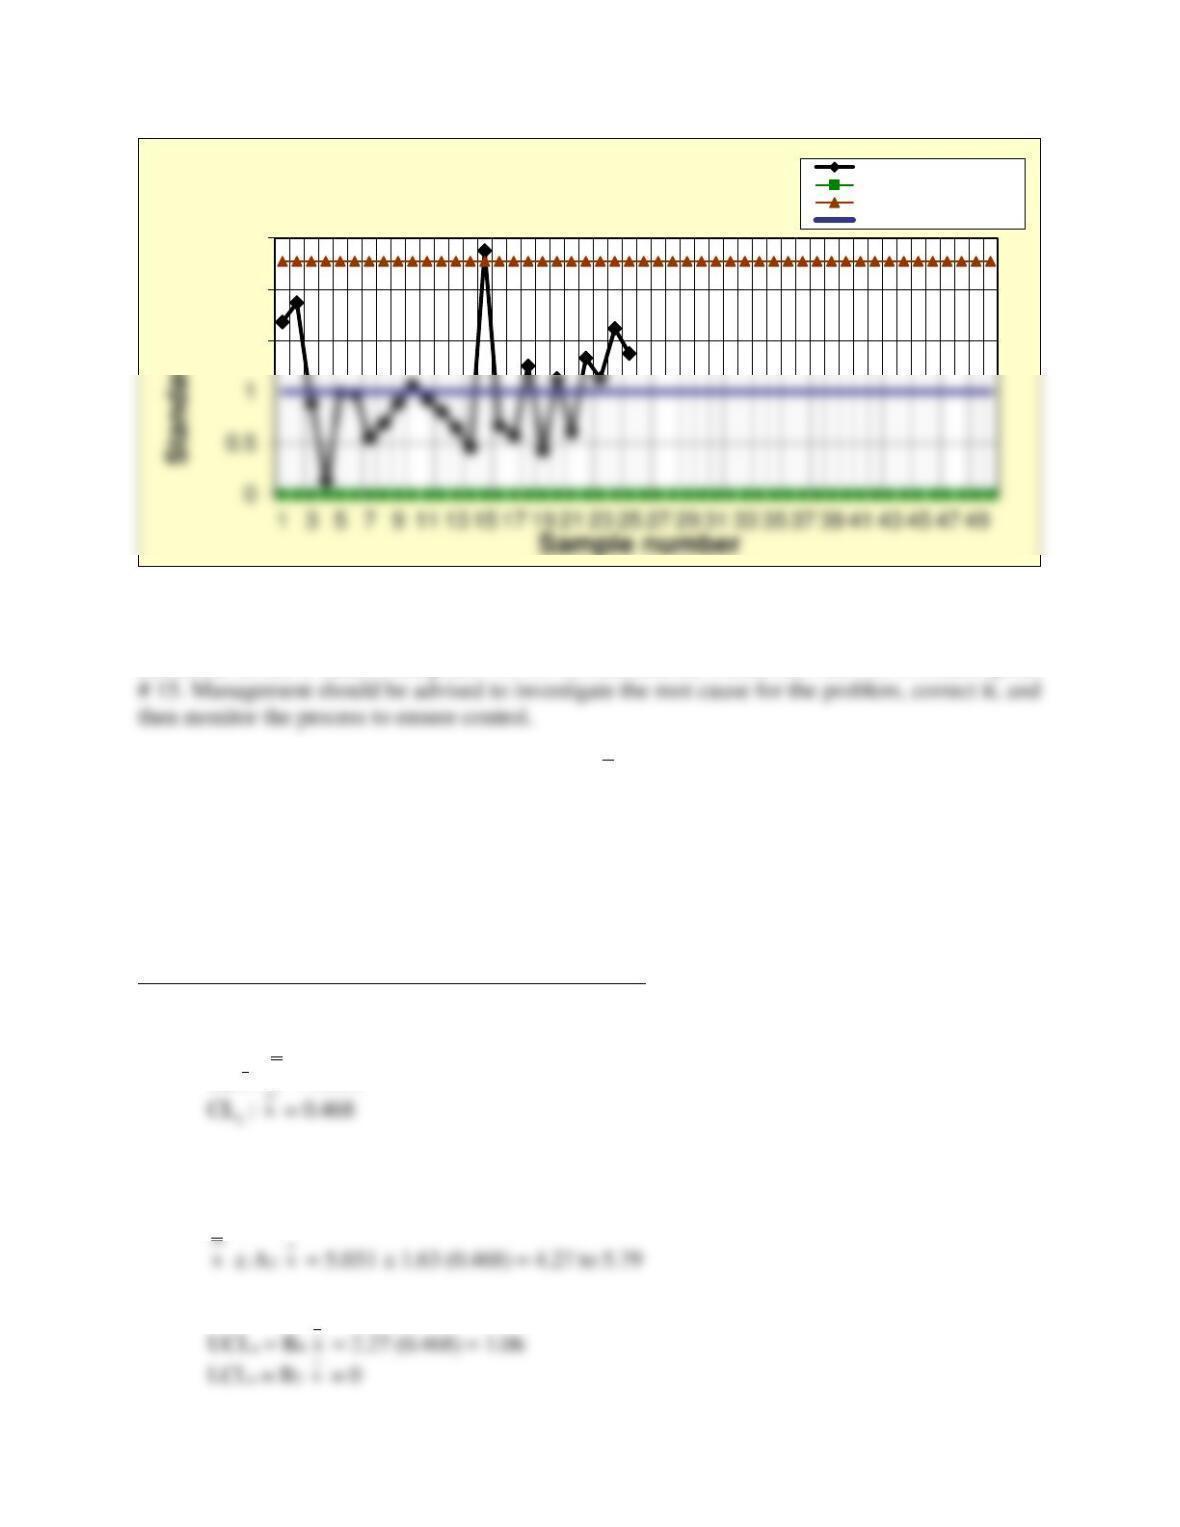
The process appears to be out of control. Seven out of 8 points appear on one side of the
centerline on the 𝑥
̅ chart, from point 4 to 11. In addition, the s-chart has one out-of-control point
34. Fujiyama Electronics wants to construct
x
– and s-charts for circuit boards that are
purchased from an outside supplier. A critical dimension is the distance between two holes
on the board that are supposed to be 5 cm apart. Use the data in the C08 Problem Data
workbook. Find the control limits using the appropriate formulas and then verify your
calculations and create the charts using the Xbar&s Excel template. What conclusions do
you reach concerning the state of the process? Is it under control? Why or why not?
See Excel file Problem 8.34 in the instructor materials.
Center lines:
CL
x
:
x
= 5.031
Control limits:
X-bar chart:
s-chart:
1.5
2
2.5
Prob. 8-33 s-Chart
Standard Deviations
Lower control limit
Upper control limit
Center line
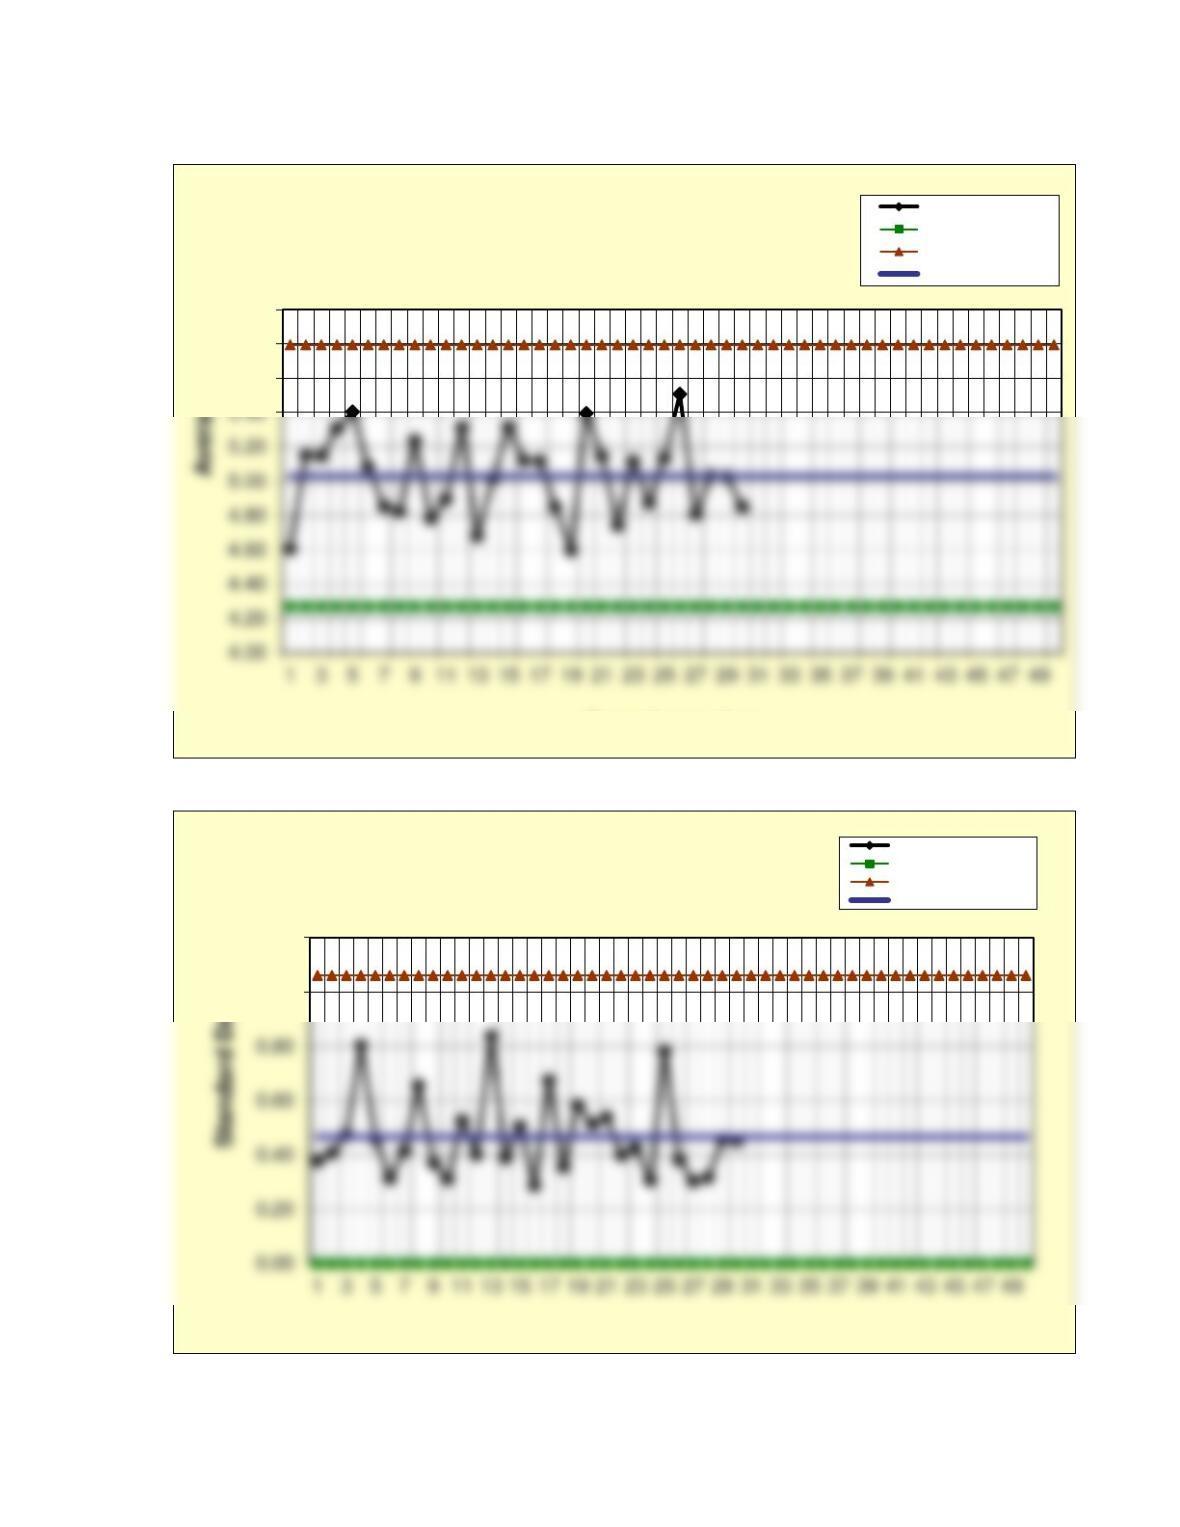
5.60
5.80
6.00
Sample number
Prob. 8-34 X-bar Chart
Averages
Lower control limit
Upper control limit
Center line
1.00
1.20
Sample number
Prob. 8-34 s-Chart
Standard Deviations
Lower control limit
Upper control limit
Center line
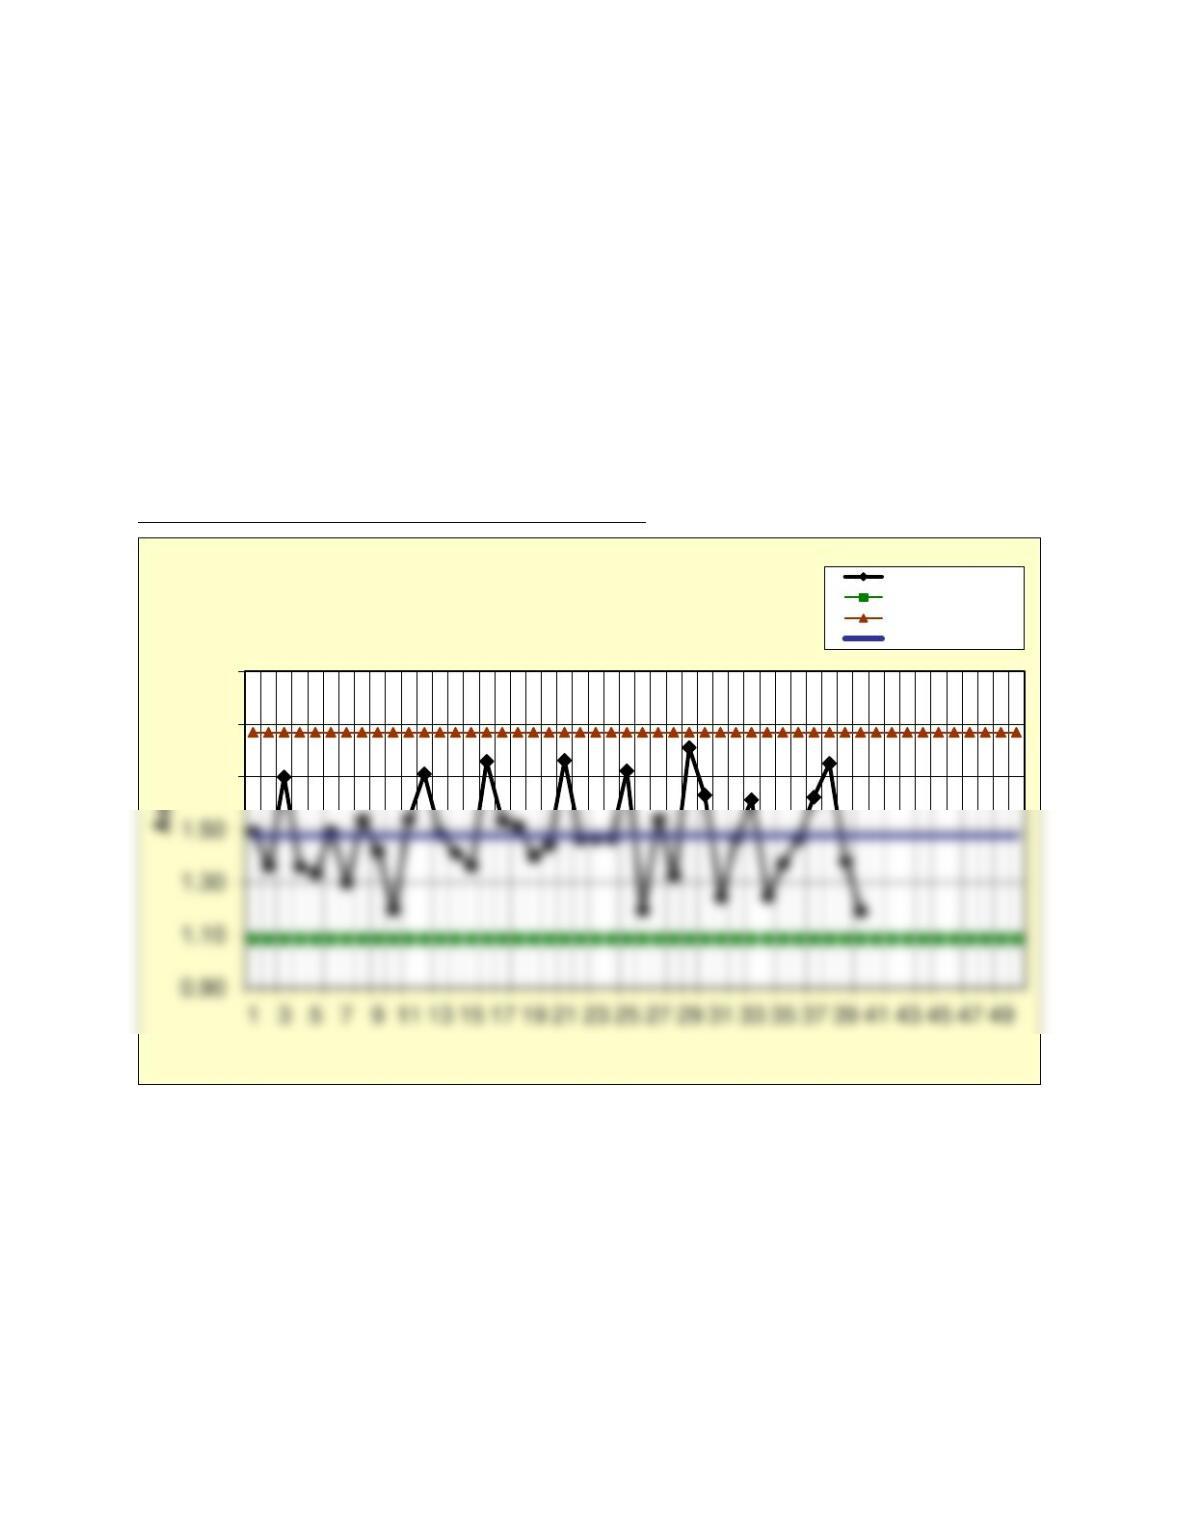
The process appears to be under control. Management should be advised to continue to
monitor the process to ensure control.
35. El Grande Toro Restaurante advertises that customers will have their orders taken
within three minutes after being seated. Management wants to monitor these times, as it is
such an important guarantee for business. Forty samples of size 5 can be found in the C08
Problem Data workbook. Use the X-bar&s Excel template to construct 𝒙
̅– and s-charts.
Does the process appear to be in statistical control? Why or why not? Calculate the
process capability indexes, using three minutes as the upper tolerance limit and zero as the
lower tolerance limit. What recommendation would you make to management concerning
the process?
See Excel file Problem 8.35 in the instructor materials.
1.70
1.90
2.10
Sample number
Prob. 8-35 X-bar Chart
Averages
Lower control limit
Upper control limit
Center line
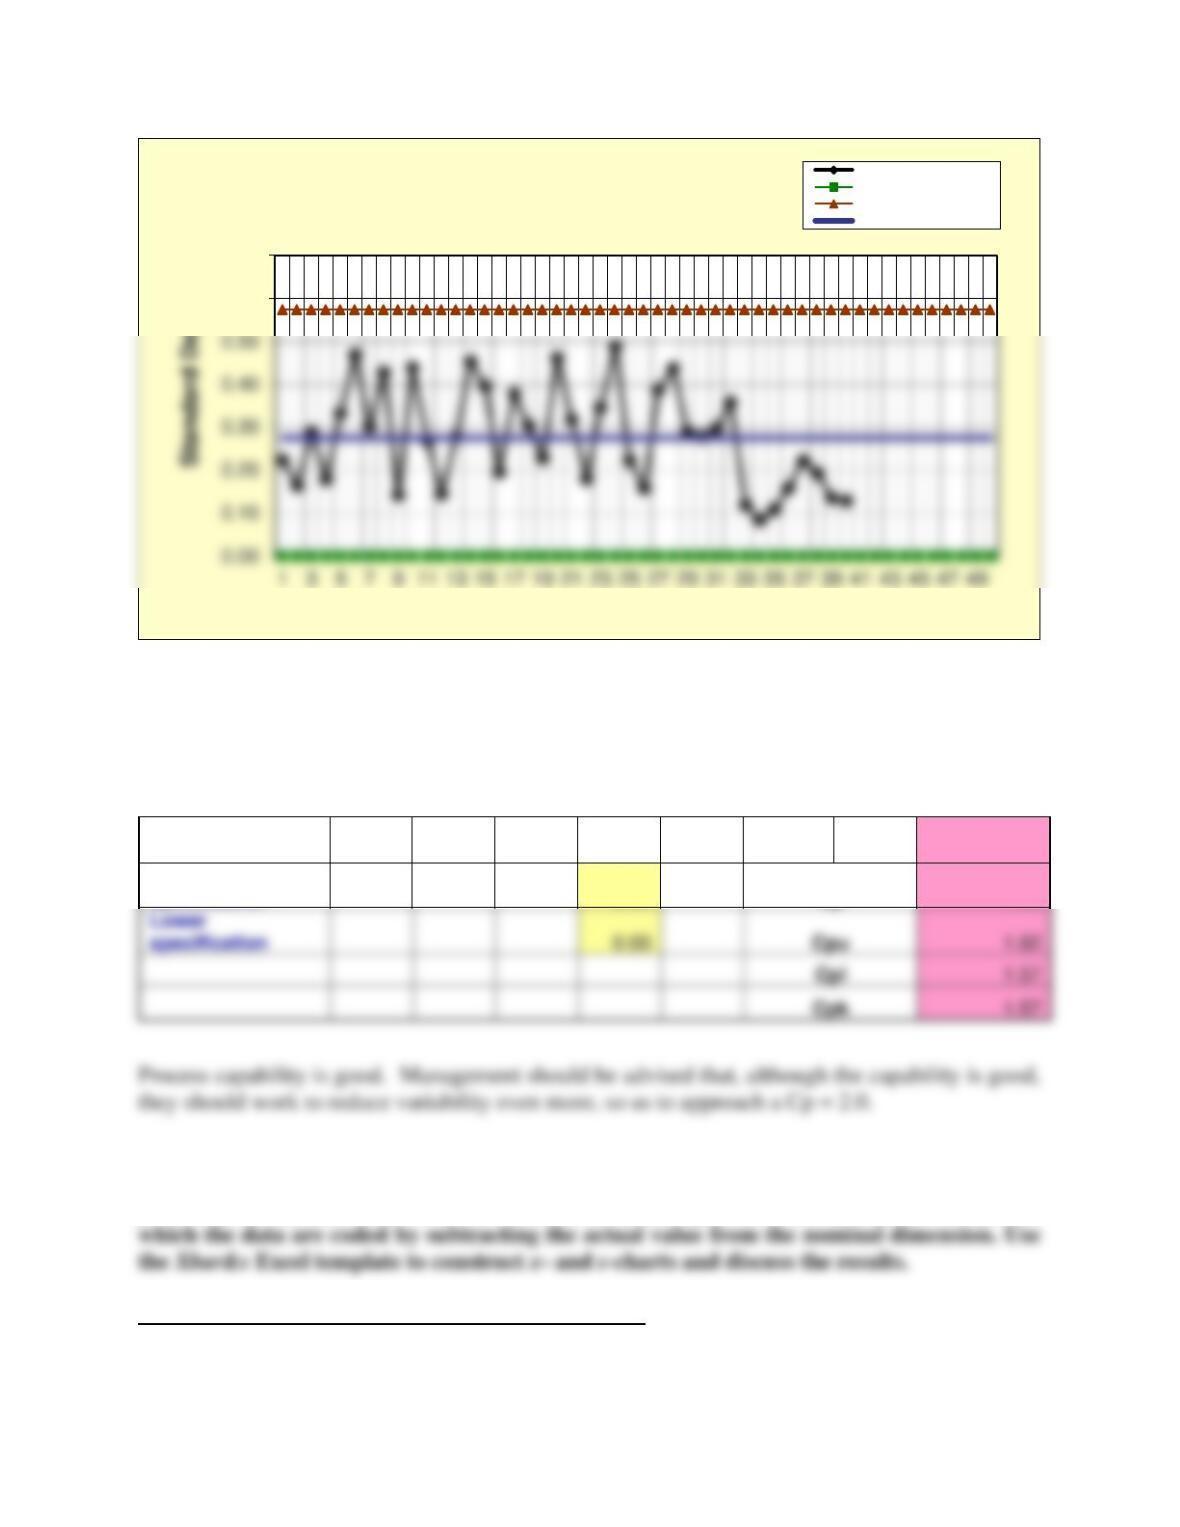
The x-bar chart appears to be in statistical control. However, in the s-chart, we see 8 points
below the center line, indicating that the standard deviation has been reduced. This is a good
thing, meaning that the response time is more consistent. This might have been the result of
training, a change in staff, or some other assignable cause that management should investigate.
Process Capability
Calculations
Six
sigma
1.883354049
Upper
specification
3.00
Cp
1.59
36. An injection molding machine at the Moby Molding Co. used to make plastic bottles
has four molding heads. The outside diameter of the bottle is an important measure of
process performance. The C08 Problem Data workbook provides results from 30 samples in
See Excel file Problem 8.36 in the instructor materials.
0.60
0.70
Sample number
Prob. 8-35 s-Chart
Standard Deviations
Lower control limit
Upper control limit
Center line
Lower
specification
0.00
1.62
1.57
1.57