1
2
3
4
5
9
10
11
12
13
14
20
21
22
26
27
28
29
32
33
34
39
40
A B C D E F G H I J K L M N O P Q R S T U
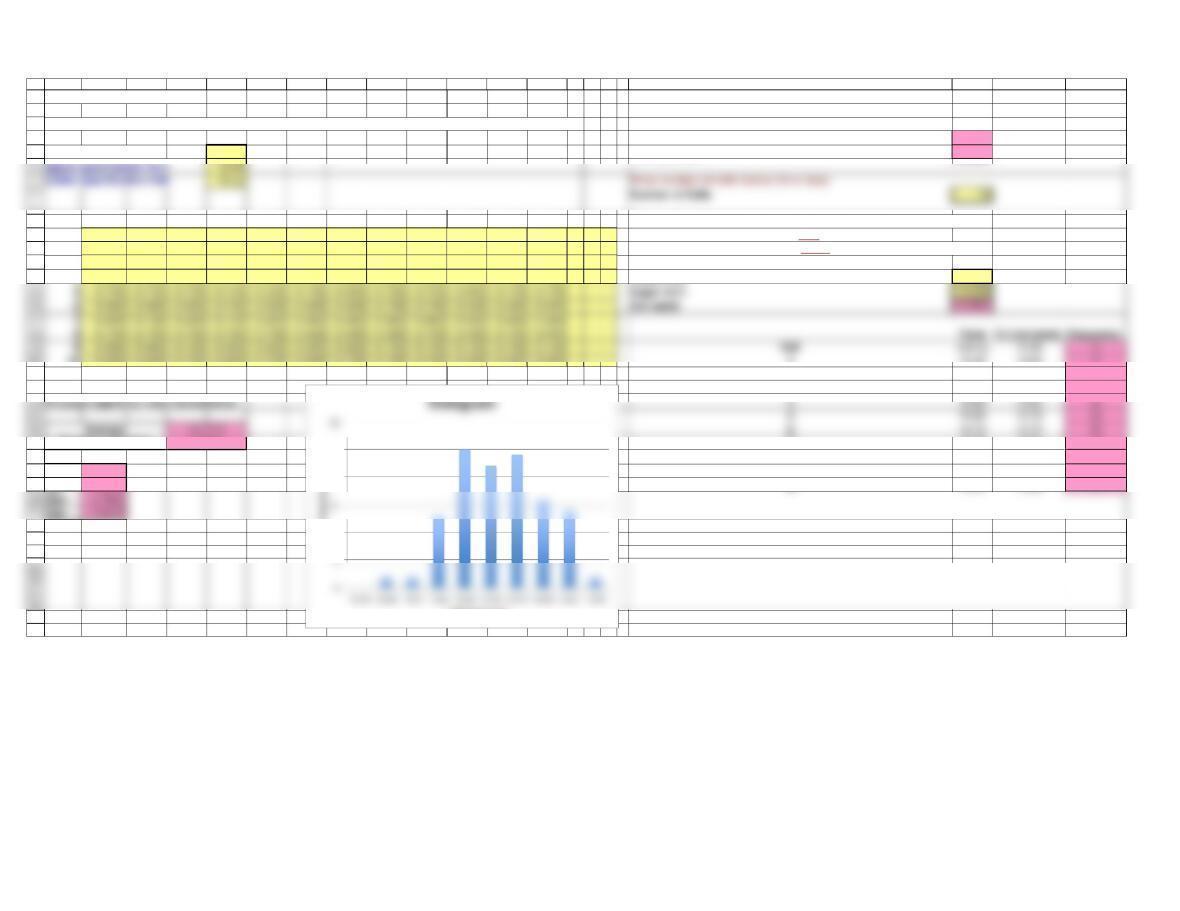
Process Capability Analysis Frequency Distribution and Histogram
This spreadsheet is designed to handle up to 150 observations. Enter data ONLY in yellow-shaded cells.
Data Minimum 10.500
Nominal specification 10.70 Data Maximum 10.900
DATA 12345678910 11 12 13 14 15 Enter smallest and largest limits for the frequency distribution below.
110.650 10.800 10.500 10.800 10.700 10.800 10.750 10.650 10.850 10.650 10.800 10.650
The lower limit should be slightly less than the data minimum.
210.750 10.850 10.800 10.800 10.700 10.700 10.850 10.700 10.800 10.550 10.700 10.850
The upper limit should be slightly larger than the data maximum.
310.750 10.700 10.650 10.800 10.650 10.650 10.750 10.650 10.500 10.800 10.750 10.800
410.600 10.650 10.650 10.700 10.600 10.750 10.800 10.850 10.650 10.650 10.700 10.600 Lower limit 10.450
10 10.600 10.600 10.750 10.800 10.750 10.850 10.750 10.750 10.700 10.650 10.600 10.650 110.45 10.50 2
210.50 10.55 2
310.55 10.60 13
710.75 10.80 16
810.80 10.85 14
Cp 0.6717 910.85 10.90 2
Cpl 0.6413 10 10.90 10.95 0
Standard deviation
0.0868
10
20
25
Frequency
Cell Upper Limit