This spreadsheet is designed for up to 50 samples. Enter data ONLY in yellow-shaded cells.
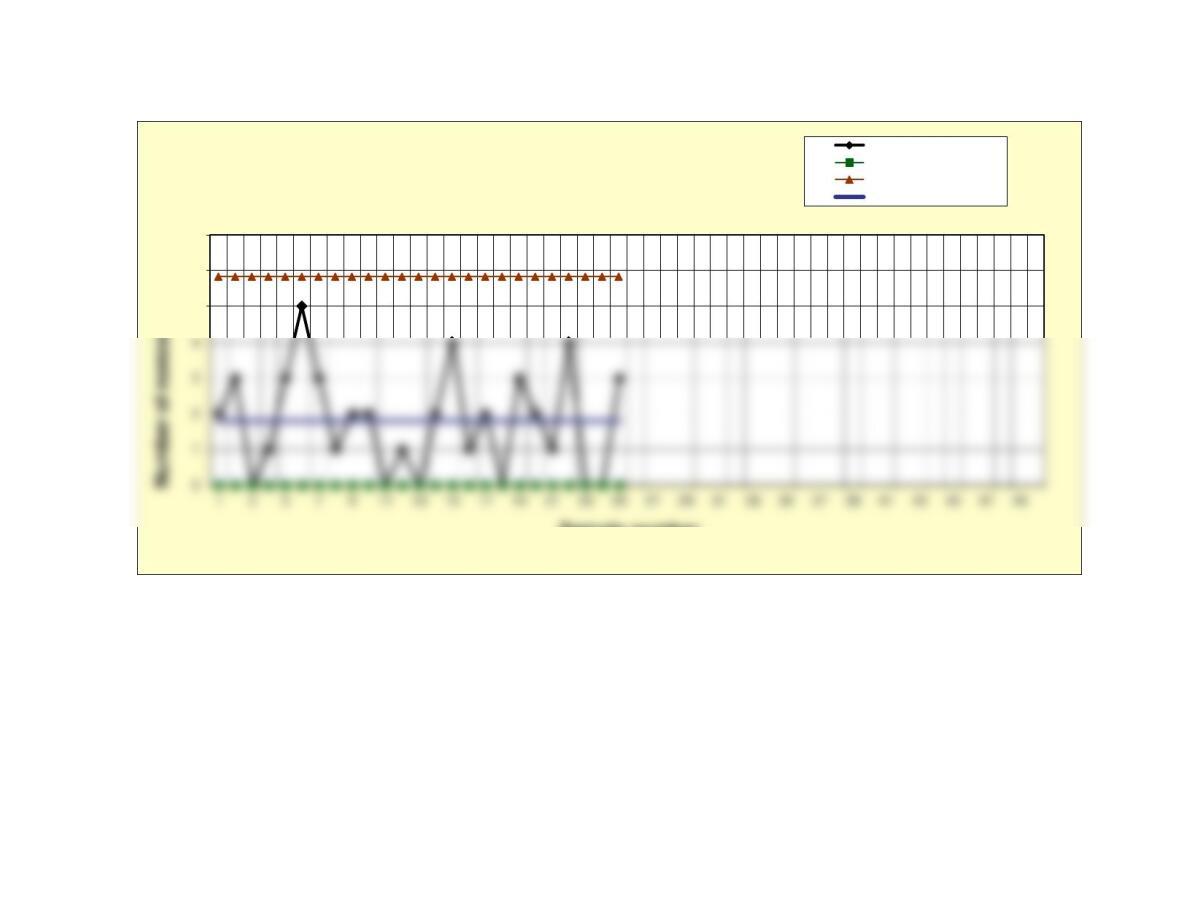
Click on the sheet tab to display the control chart (some rescaling may be needed).
Number of
Sample
Nonconformances
LCLc CL UCLc
1 2 0 1.8 5.82492
2 3 0 1.8 5.82492
3 0 0 1.8 5.82492
4 1 0 1.8 5.82492
5 3 0 1.8 5.82492
6 5 0 1.8 5.82492
15 4 0 1.8 5.82492
16 1 0 1.8 5.82492
17 2 0 1.8 5.82492
18 0 0 1.8 5.82492
19 3 0 1.8 5.82492
20 2 0 1.8 5.82492
21 1 0 1.8 5.82492
26 #N/A #N/A #N/A
27 #N/A #N/A #N/A
28 #N/A #N/A #N/A
29 #N/A #N/A #N/A
30 #N/A #N/A #N/A
31 #N/A #N/A #N/A
32 #N/A #N/A #N/A
33 #N/A #N/A #N/A
34 #N/A #N/A #N/A
35 #N/A #N/A #N/A
36 #N/A #N/A #N/A
37 #N/A #N/A #N/A
38 #N/A #N/A #N/A
39 #N/A #N/A #N/A
40 #N/A #N/A #N/A
41 #N/A #N/A #N/A
42 #N/A #N/A #N/A
43 #N/A #N/A #N/A
44 #N/A #N/A #N/A
45 #N/A #N/A #N/A
46 #N/A #N/A #N/A
47 #N/A #N/A #N/A
48 #N/A #N/A #N/A
49 #N/A #N/A #N/A
50 #N/A #N/A #N/A
5
6
7
Sample number
Attribute (c) Chart Number of defects
Lower control limit
Upper control limit
Center line