Archives: Solution Manual
Graphics & Visualization Chapter 7 Homework Unlocked Cells Allow Users Enter Data Into
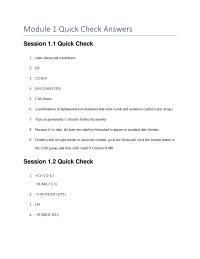
2. data input, data storage, and data output defined name to a different location, any formula using that named range reflects the new location. 5. No. It contains a space. Replacing that space with an underscore (_) or removing the […]
Graphics & Visualization Chapter 7 Homework The Macro Can Run Any Time Repeat
© 2017 Cengage Learning. All Rights Reserved. May not be copied, scanned, or duplicated, in whole or in part, except for use as permitted in a license distributed with a certain product or service or otherwise on a password-protected website […]
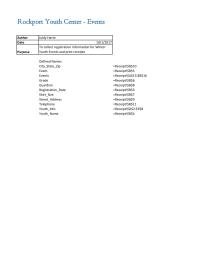
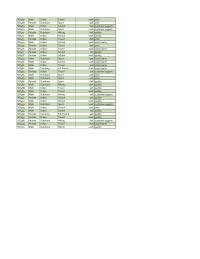
Graphics & Visualization Chapter 7 Homework To collect registration information for Winter Youth Events
Rockport Youth Center – Events Author Juldy Harte Date 10/1/2017 Purpose To collect registration information for Winter Youth Events and print receipts Defined Names City_State_Zip =Receipt!$B$10 Event =Receipt!$B$5 Events =Receipt!$A$13:$B$16 Grade =Receipt!$B$6 Guardian =Receipt!$B$8 Registration_Date =Receipt!$B$3 Shirt_Size =Receipt!$B$7 Street_Address =Receipt!$B$9 […]
Graphics & Visualization Chapter 6 Homework In the Open dialog box, double-click the template file
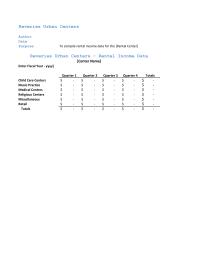
Reveries Urban Centers Author Date Purpose To compile rental income data for the [Rental Center] Enter Fiscal Year – yyyy] Quarter 1 Quarter 2 Quarter 3 Quarter 4 Totals Child Care Centers –$ –$ –$ –$ –$ Music Practice –$ […]
Graphics & Visualization Chapter 6 Homework Michael Verhallen Religious Centers Miscellaneous Retail
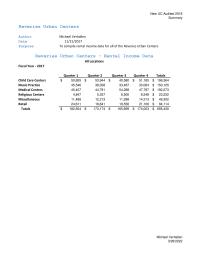
New UC Audited 2018 Summary Reveries Urban Centers Author Michael Verhallen Date 11/21/2017 Purpose To compile rental income data for all of the Reveries Urban Centers Fiscal Year – 2017 Quarter 1 Quarter 2 Quarter 3 Quarter 4 Totals Child […]
Graphics & Visualization Chapter 6 Homework Save As dialog box to assign a new filename to the workbook
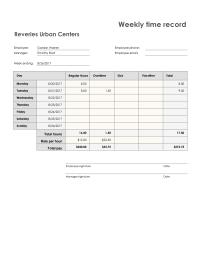
Employee: Employee phone: Manager: Employee email: Week ending: Regular Hours Overtime Sick Total Monday 8/20/2017 8.00 8.00 Tuesday 8/21/2017 8.00 1.50 9.50 Employee signature Date Manager signature Date Weekly time record 8/26/2017 Day Vacation Gordon Warren Reveries Urban Centers Timothy […]
Graphics & Visualization Chapter 6 Homework To compile rental income data for all of the Reveries Urban Centers
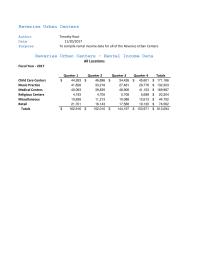
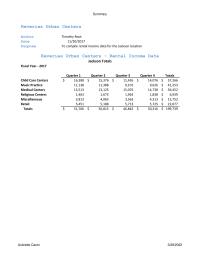
Reveries Urban Centers Author Timothy Root Date 11/20/2017 Purpose To compile rental income data for all of the Reveries Urban Centers Fiscal Year – 2017 Quarter 1 Quarter 2 Quarter 3 Quarter 4 Totals Child Care Centers 44,263$ 46,896$ 34,426$ […]
Graphics & Visualization Chapter 6 Homework Reveries Urban Centers – Rental Income Data Jackson Total
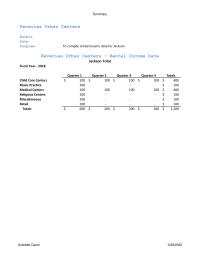
Summary Reveries Urban Centers Author Date Purpose To compile rental income data for Jackson Fiscal Year – 2018 Quarter 1 Quarter 2 Quarter 3 Quarter 4 Totals Child Care Centers 100$ 100$ 100$ 100$ 400$ Music Practice 100 – – […]
Graphics & Visualization Chapter 6 Homework Centers Miscellaneous Retail Totals Au brette Caron April
Summary Reveries Urban Centers Author Timothy Root Date 11/20/2017 Purpose To compile rental income data for the Jackson location Fiscal Year – 2017 Quarter 1 Quarter 2 Quarter 3 Quarter 4 Totals Child Care Centers 16,388$ 15,376$ 11,426$ 14,076$ 57,266$ […]
Graphics & Visualization Chapter 6 Homework To summarize current and projected sales Economic Landscape Supplies
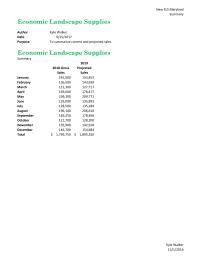
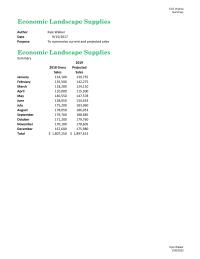
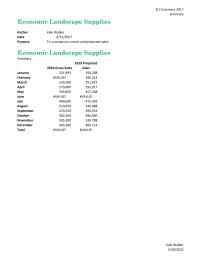
New ELS Maryland Summary Economic Landscape Supplies Author Kyle Walker Date 9/15/2017 Purpose To summarize current and projected sales Economic Landscape Supplies Summary 2018 Gross 2019 Projected June 129,000 135,893 July 128,500 135,284 August 196,100 206,610 September 169,250 178,466 October […]
Graphics & Visualization Chapter 6 Homework To update the workbook, click the Update button
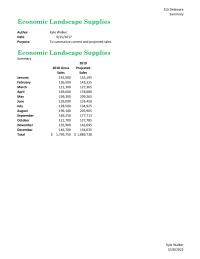
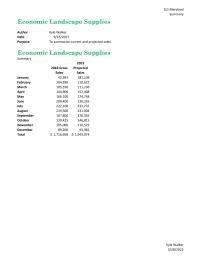
ELS Delaware Summary Economic Landscape Supplies Author Kyle Walker Date 9/15/2017 Purpose To summarize current and projected sales Economic Landscape Supplies Summary 2018 Gross Sales 2019 Projected Sales June 129,000 135,450 July 128,500 134,925 August 196,100 205,905 September 169,250 177,713 […]
Graphics & Visualization Chapter 6 Homework Excel will update the link automatically when you update
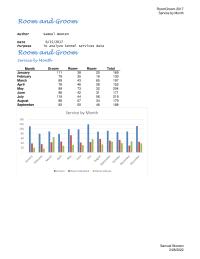
RoomGroom 2017 Service by Month Room and Groom Author Samuel Wooten Date 9/15/2017 Purpose To analyze kennel services data Room and Groom Service by Month Month Groom Room- Room- Total January 111 38 20 169 February 79 35 16 130 […]
Graphics & Visualization Chapter 6 Homework To analyze sales in the San Diego store Purpose Clara
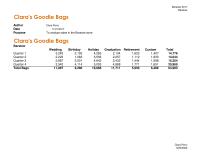
Barstow 2017 Barstow Clara’s Goodie Bags Author Clara Perry Date 11/21/2017 Purpose To analyze sales in the Barstow store Clara’s Goodie Bags Barstow Wedding Birthday Holiday Graduation Retirement Custom Total Quarter 1 3,245 2,102 4,265 2,134 1,623 1,407 14,776 Clara […]
Graphics & Visualization Chapter 6 Homework To summarize quarterly sales data for each tea room location
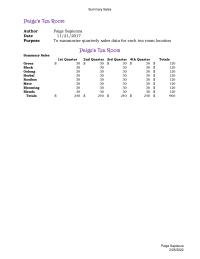
Summary Sales Paige’s Tea Room Author Paige Sapienza Date 11/21/2017 Purpose To summarize quarterly sales data for each tea room location Summary Sales 1st Quarter 2nd Quarter 3rd Quarter 4th Quarter Totals Green 30$ 30$ 30$ 30$ 120$ Black 30 […]
Graphics & Visualization Chapter 6 Homework Family Monthly Planner, Inventory List, Team Roster
ELS Virginia Summary Economic Landscape Supplies Author Kyle Walker Date 9/15/2017 Purpose To summarize current and projected sales Economic Landscape Supplies Summary 2018 Gross Sales 2019 Projected Sales January 133,100 139,755 February 135,500 142,275 March 118,200 124,110 April 110,000 115,500 […]
Graphics & Visualization Chapter 6 Homework If you store a template in a location other than the Custom Office
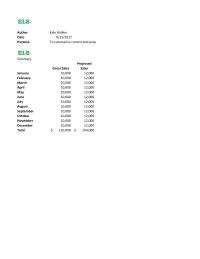
ELS Author Kyle Walker Date 9/15/2017 Purpose To summarize current and projected sales ELS Summary Gross Sales Projected Sales January 10,000 12,000 February 10,000 12,000 March 10,000 12,000 April 10,000 12,000 May 10,000 12,000 June 10,000 12,000 July 10,000 12,000 […]
Graphics & Visualization Chapter 6 Homework A user can modify the contents of a workbook based on a template
ELS Summary 2017 Summary Economic Landscape Supplies Author Kyle Walker Date 9/15/2017 Purpose To summarize current and projected sales Economic Landscape Supplies Summary 2018 Gross Sales 2019 Projected Sales January 321,993 293,208 February #VALUE! 286,214 March 239,500 251,827 April 279,600 […]
Graphics & Visualization Chapter 6 Homework Click the cell in which you want to insert the hyperlink.
ELS Maryland Summary Economic Landscape Supplies Author Kyle Walker Date 9/15/2017 Purpose To summarize current and projected sales Economic Landscape Supplies Summary 2018 Gross Sales 2019 Projected Sales January 42,993 181,108 February 104,930 110,622 March 105,550 111,236 April 144,900 152,408 […]
Graphics & Visualization Chapter 6 Homework If the source file is closed when you open the destination file
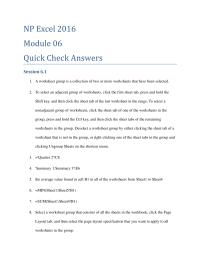
nonadjacent group of worksheets, click the sheet tab of one of the worksheets in the group, press and hold the Ctrl key, and then click the sheet tabs of the remaining worksheets in the group. Deselect a worksheet group by […]
Graphics & Visualization Chapter 6 Homework This feature gives you the ability to organize your data better
© 2017 Cengage Learning. All Rights Reserved. May not be copied, scanned, or duplicated, in whole or in part, except for use as permitted in a license distributed with a certain product or service or otherwise on a password-protected website […]
Graphics & Visualization Chapter 5 Homework Day Saturday Group Home, Individual, Residential Care, and Restaurant
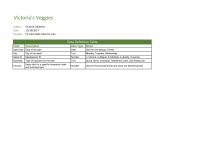
Victoria’s Veggies Author Victoria Calderon Date 11/16/2017 Purpose To track daily sales for July Field Description Data Type Notes Sale Date Date of the sale Date Use the mm/dd/yyyy format and business type Data Definition Table Day Day of the […]
Graphics & Visualization Chapter 5 Homework Victorias Veggies Author Date Purpose Victoria Calderon
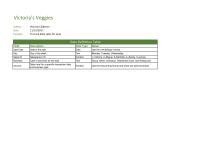
Victoria’s Veggies Author Victoria Calderon Date 11/15/2017 Purpose To track daily sales for June Field Description Data Type Notes Sale Date Date of the sale Date Use the mm/dd/yyyy format Data Definition Table Day Day of the week Text Monday, […]
Graphics & Visualization Chapter 5 Homework Pinterest Introduction Pinterest Total Twitter Check me out Twitter
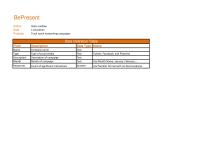
BePresent Author Alana Laidlaw Date 11/16/2017 Purpose Track social networking campaigns Field Description Data Type Notes Name Company name Text Data Definition Table Type Type of social media Text Twitter, Facebook, and Pinterest Description Description of campaign Text Month Month […]
Graphics & Visualization Chapter 5 Homework Broadcast Drive City Lake Charles Lake Charles
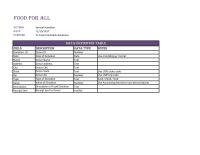
Food for All Author Samuel Hamilton Date 11/15/2017 Purpose To track food bank donations Field Description Data Type Notes Donation ID Donor ID Number Date Date of Donation Date Use mm/dd/yyyy format Name Donor Name Text Address Donor Address Text […]
Graphics & Visualization Chapter 5 Homework Teague Vinson Vinson Moir Conn Nguyen Parker
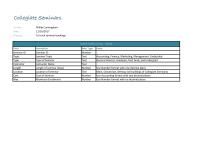
Collegiate Seminars Author Phillip Cunningham Date 11/16/2017 Purpose To track seminar bookings Field Description Data Type Notes Seminar ID Seminar ID Number Topic Seminar Topic Text Accounting, Finance, Marketing, Management, Undecided Type Type of Seminar Text General Interest, Graduate, Post […]
Graphics & Visualization Chapter 5 Homework Use Currency format with no places Use Number format with no decimal places
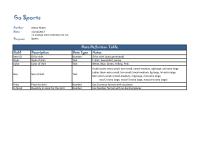
Go Sports Author Anton Aliyev Date 11/16/2017 Purpose To analyze shirt inventory for Go Sports Field Description Data Type Notes Item ID ID for shirt Number ID for shirt (auto generated) Data Definition Table Style Style of shirt Text T-shirt, […]
Graphics & Visualization Chapter 5 Homework Average Function The Total Row Slicer Object
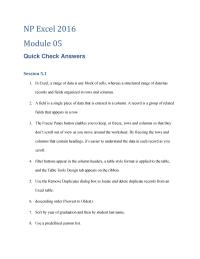
don’t scroll out of view as you move around the worksheet. By freezing the rows and columns that contain headings, it’s easier to understand the data in each record as you scroll. 4. filter buttons appear in the column headers, […]
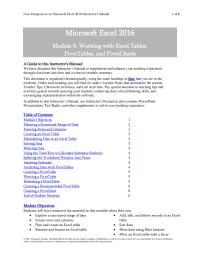
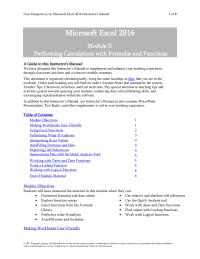
Graphics & Visualization Chapter 5 Homework We have designed this Instructor’s Manual to supplement
© 2017 Cengage Learning. All Rights Reserved. May not be copied, scanned, or duplicated, in whole or in part, except for use as permitted in a license distributed with a certain product or service or otherwise on a password-protected website […]
Graphics & Visualization Chapter 4 Homework Pie charts are very useful for comparing values to each other
SID467 Male Urban Travel 100K price SID468 Female Outdoors Sport 90K price SID478 Female Urban School 100K quality SID479 Male Outdoors Sport 90K brand name SID480 Male Urban School 120K brand name SID481 Male Urban Travel 90K brand name SID482 […]
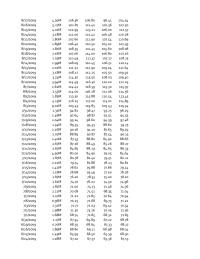
Graphics & Visualization Chapter 4 Homework What are the advantages and disadvantages of the embedded chart
8/13/2009 2.02M 111.22 112.90 109.04 111.64 8/12/2009 3.18M 108.12 112.25 105.50 109.92 8/11/2009 3.74M 114.50 115.50 108.03 109.40 8/10/2009 3.94M 114.49 116.30 110.20 112.05 8/7/2009 2.62M 114.42 118.39 113.30 115.97 8/6/2009 2.53M 114.00 116.28 111.06 114.56 8/5/2009 2.83M 113.50 115.88 […]
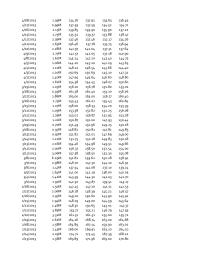
Graphics & Visualization Chapter 4 Homework Give examples of how functions can be used to manage personal finances
4/11/2013 1.63M 136.46 137.78 133.75 136.94 4/10/2013 2.28M 141.97 142.04 137.31 137.64 4/9/2013 2.77M 141.57 142.05 137.18 140.90 4/8/2013 1.61M 145.24 147.20 143.40 144.73 4/5/2013 1.06M 144.20 145.20 142.29 143.65 4/4/2013 1.10M 148.21 148.54 143.66 144.40 4/3/2013 1.20M 150.69 150.69 […]
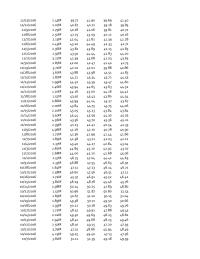
Graphics & Visualization Chapter 4 Homework Lecture Notes that summarize the section, teacher Tips
12/1/2016 3.21M 42.39 43.68 42.03 43.63 11/30/2016 2.87M 42.00 42.47 41.40 41.75 11/29/2016 3.71M 42.01 42.01 39.88 40.86 11/28/2016 3.67M 43.88 43.98 41.51 41.83 11/25/2016 1.87M 44.72 45.34 43.72 44.55 11/23/2016 1.99M 44.52 45.39 43.47 44.60 11/22/2016 1.46M 43.94 44.65 […]
Graphics & Visualization Chapter 4 Homework Current Liabilities Cost of Revenue Research Development
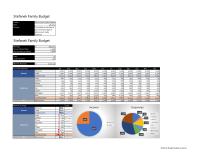
Stefanek Family Budget Author Edmund and Lydia Stefanek Date 3/1/2017 Purpose To provide an overview of the monthly budget of Edmund and Lydia Stefanek Stefanek Family Budget Mortage 285,000$ Monthly Payment (1,551.94)$ Income & Expenses Jan Feb Mar Apr May […]
Graphics & Visualization Chapter 4 Homework Because the chart needs to display the total population of the county
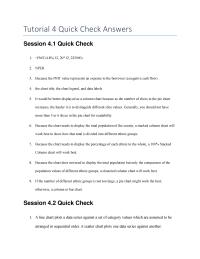
4. the chart title, the chart legend, and data labels increases, the harder it is to distinguish different slice values. Generally, you should not have more than 5 or 6 slices in the pie chart for readability. 7. Because the […]
Graphics & Visualization Chapter 4 Homework Show how to insert a pie chart with the Quick Analysis tool
© 2017 Cengage Learning. All Rights Reserved. May not be copied, scanned, or duplicated, in whole or in part, except for use as permitted in a license distributed with a certain product or service or otherwise on a password-protected website […]
Graphics & Visualization Chapter 3 Homework The Growing Degree Day or GDD measures the growth of a crop
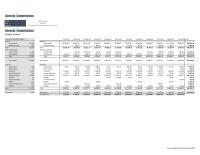
Gorecki Construction Author Date Purpose Gorecki Construction Budget Analysis Estimated Monthly Budget 31-Jan-18 28-Feb-18 31-Mar-18 30-Apr-18 31-May-18 30-Jun-18 31-Jul-18 31-Aug-18 30-Sep-18 31-Oct-18 30-Nov-18 31-Dec-18 Total Income Income Construction 33,580 Construction 20,781.48 18,481.47 28,311.14 32,145.87 34,005.21 41,004.87 37,578.91 36,414.34 34,308.10 57,207.15 […]
Graphics & Visualization Chapter 3 Homework Goal Seek The Value For The Calculated
7. Excel does not treat blanks as zeroes and will skip the blank values in calculating an average from a range of cell. Goal Seek the value for the calculated value is specified and Excel determines the input value needed […]
Graphics & Visualization Chapter 3 Homework Functions are organized in the Function Library group
© 2017 Cengage Learning. All Rights Reserved. May not be copied, scanned, or duplicated, in whole or in part, except for use as permitted in a license distributed with a certain product or service or otherwise on a password-protected website […]
Graphics & Visualization Chapter 2 Homework Bean Hot Drink Ca f Carol Evans Wednesday
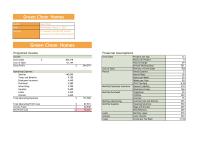
Author Sean Patel Date Wednesday, March 1, 2017 Purpose To develop a projected income statement for Green Clean Homes Projected Income Financial Assumptions Income Projects per Day 12 Gross Sales 305,718$ Hours per Project 4 Cost of Sales Percent of […]
Graphics & Visualization Chapter 2 Theme colors are the colors that belong to a workbook’s basic design
while the Accounting style fixes the currency symbol on the left edge of the cell, encloses negative values in parenthesis, and displays zero values using dashes. either increase the width of the cell column or reduce the number of digits […]
Graphics & Visualization Chapter 2 Homework Protection Provides Options For Locking Hiding Cells
© 2017 Cengage Learning. All Rights Reserved. May not be copied, scanned, or duplicated, in whole or in part, except for use as permitted in a license distributed with a certain product or service or otherwise on a password-protected website […]
Graphics & Visualization Chapter 1 Homework Total Charges Cust Jensen Gilmore Richard Miles
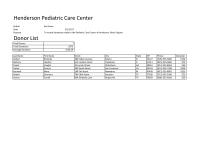
Henderson Pediatric Care Center Author Kari Essen Date 3/1/2017 Purpose To record donations made to the Pediatric Care Center in Henderson, West Virginia Donor List Total Donors 7 Total Donations $975 Average Donation $139.29 Last Name First Name Street City […]
Graphics & Visualization Chapter 1 Homework Autofit Column Width Session 12 Quick Check
8. Because it’s a date; all dates are numbers formatted to appear in standard date formats. 9. Double-click its right border or select the column, go to the Home tab, click the Format button in the Cells group, and then […]
Graphics & Visualization Chapter 1 Homework Teacher Tip Stress Students That Formula Always
© 2017 Cengage Learning. All Rights Reserved. May not be copied, scanned, or duplicated, in whole or in part, except for use as permitted in a license distributed with a certain product or service or otherwise on a password-protected website […]
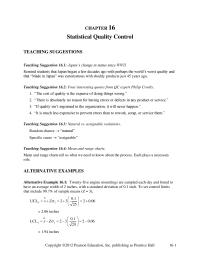
Management Chapter 16 Homework There have been complaints that the sports page of the Dubuque
2. “There is absolutely no reason for having errors or defects in any product or service.” 3. “If quality isn’t ingrained in the organization, it will never happen.” 4. “It is much less expensive to prevent errors than to rework, […]
Management Chapter 15 Homework We make the same types of changes for Chris that we did for Sandy
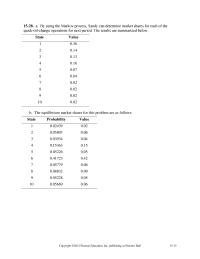
15-28. a. By using the Markov process, Sandy can determine market shares for each of the quick-oil-change operations for next period. The results are summarized below. State Value 1 0.36 2 0.14 3 0.13 4 0.16 5 0.07 6 0.04 […]
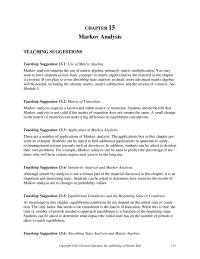
Management Chapter 15 Homework Absorbing state analysis requires more complex matrix algebra
CHAPTER 15 Markov Analysis TEACHING SUGGESTIONS Teaching Suggestion 15.1: Use of Matrix Algebra. Markov analysis requires the use of matrix algebra, primarily matrix multiplication. You may want to have students review basic concepts in matrix algebra before the material in […]
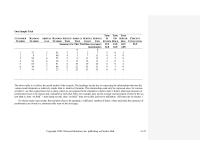
Management Chapter 14 Homework Relevant measures of performance have to be chosen and evaluated for each trial
One Sample Trial TIME TIME TIME CUSTOMER RANDOM ARRIVAL RANDOM SERVICE ARRIVAL SERVICE SERVICE IN ON SERVER PERCENT NUMBER NUMBER GAP NUMBER TIME TIME START END SYSTEM HOLD IDLE UTILIZATION Summary for This Trial Run (averages): 15.5 12.0 0.15 95.9 […]

Management Chapter 14 Homework Problems with conditions of certainty can be solved more easily by other QA techniques
CHAPTER 14 Simulation Modeling TEACHING SUGGESTIONS Teaching Suggestion 14.1: There Are Many Kinds of Simulations. This chapter teaches the concepts of Monte Carlo simulation, but it also notes that there are many physical kinds of simulation models as well. The […]
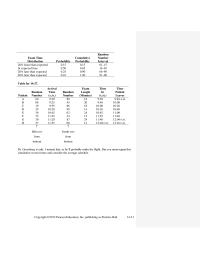
Management Chapter 14 Homework But you must repeat this simulation several times and consider the average schedule
Random Exam Time Cumulative Number Distribution Probability Probability Interval 20% faster than expected 0.15 0.15 01–15 In expected time 0.50 0.65 16–65 20% later than expected 0.25 0.90 66–90 40% later than expected 0.10 1.00 91–00 Table for 14-27. Arrival […]