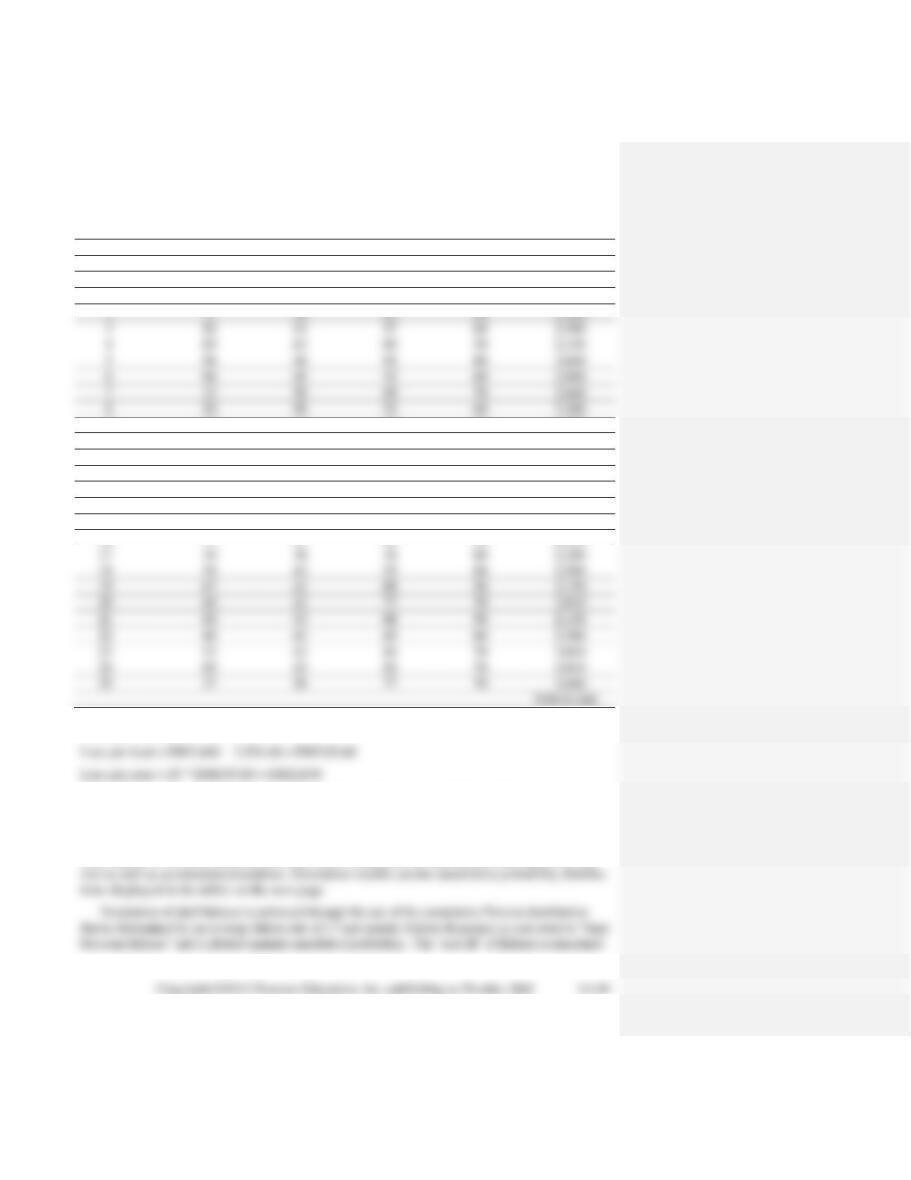
One Sample Trial
TIME
TIME
TIME
CUSTOMER
RANDOM
ARRIVAL
RANDOM
SERVICE
ARRIVAL
SERVICE
SERVICE
IN
ON
SERVER
PERCENT
NUMBER
NUMBER
GAP
NUMBER
TIME
TIME
START
END
SYSTEM
HOLD
IDLE
UTILIZATION
Summary for This Trial Run (averages):
15.5
12.0
0.15
95.9
(maximums):
34.0
32.0
2.00
0
0
1
27
2
82
5
2
2
7
5
0
2
2
8
1
60
4
3
7
11
8
4
0
3
93
6
25
2
9
11
13
4
2
0
4
93
6
36
2
15
15
17
2
0
2
5
4
6
6
44
3
88
6
22
25
31
9
3
0
7
41
3
23
2
25
31
33
8
6
0
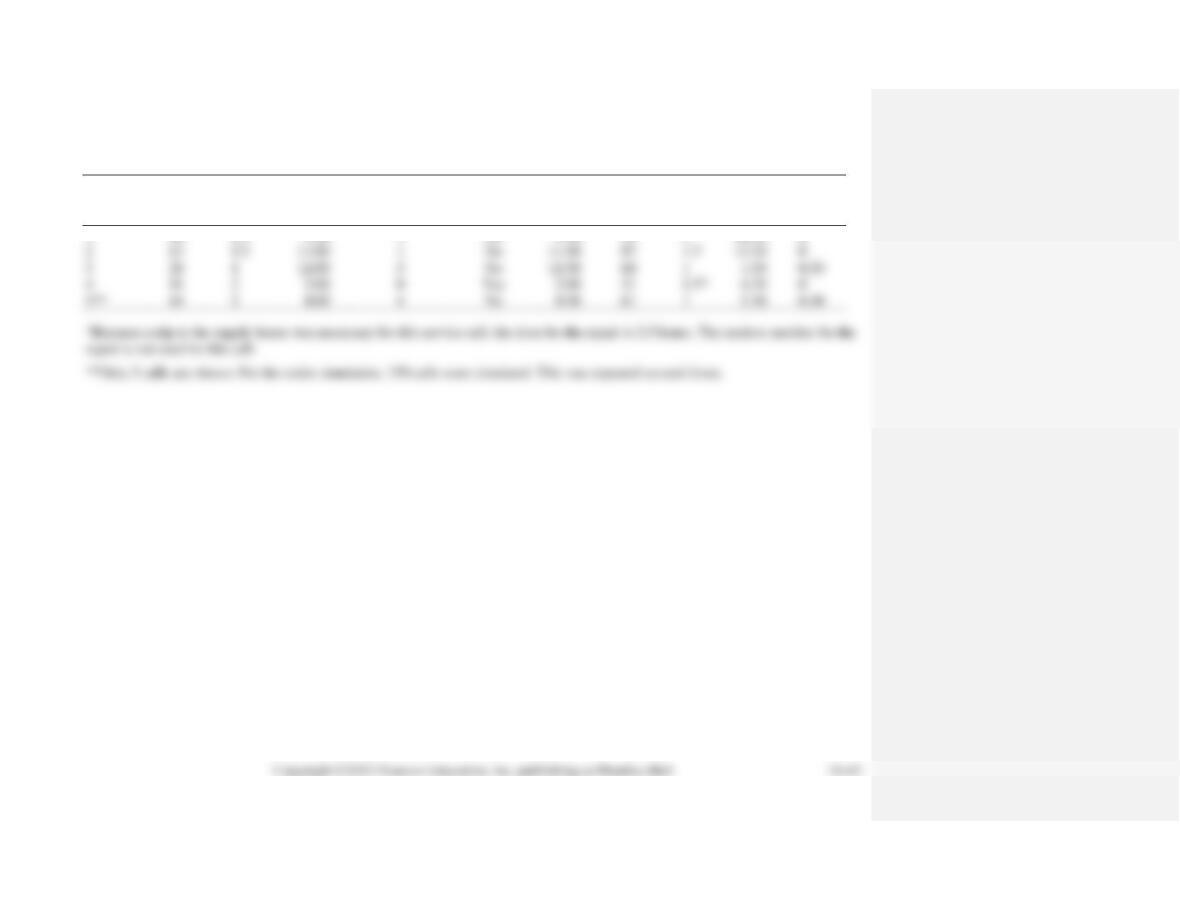
The above table is, in effect, the actual model of the scenario. The headings are the key to expressing the relationships between the
various model elements as relatively simple (that is, intuitive) formulas. The relationships need only be expressed once, for custom-
er/caller 1, are then copied down for as many callers as are required in the simulation window (here 2 hours). Relevant measures of
Summary of Trials
TIME
TIME
TIME
TIME
TIME
TIME
IN
IN
SERVER
PERCENT
IN
IN
SERVER
PERCENT
TRIAL
SYSTEM
QUEUE
IDLE
UTILIZATION
TRIAL
SYSTEM
QUEUE
IDLE
UTILIZATION
Avg.:
8.9
5.7
0.4
88.4
Max.:
18.0
14.5
4.3
98.1
0
7.6
4.0
0.43
89.5
0
14.0
10.0
4.0
1
8.6
5.1
0.23
93.9
1
17.0
15.0
5.0
2
3.8
1.2
1.00
72.4
2
10.0
7.0
5.0
3
0.25
93.4
3
30.0
27.0
3.0
4
4.8
1.8
0.65
82.3
4
11.0
6.0
6.0
5
6.0
2.8
0.80
80.0
5
14.0
9.0
4.0
6
7.8
4.1
0.25
93.6
6
13.0
11.0
5.0
7
4.7
1.9
0.55
83.5
7
9.0
7.0
5.0
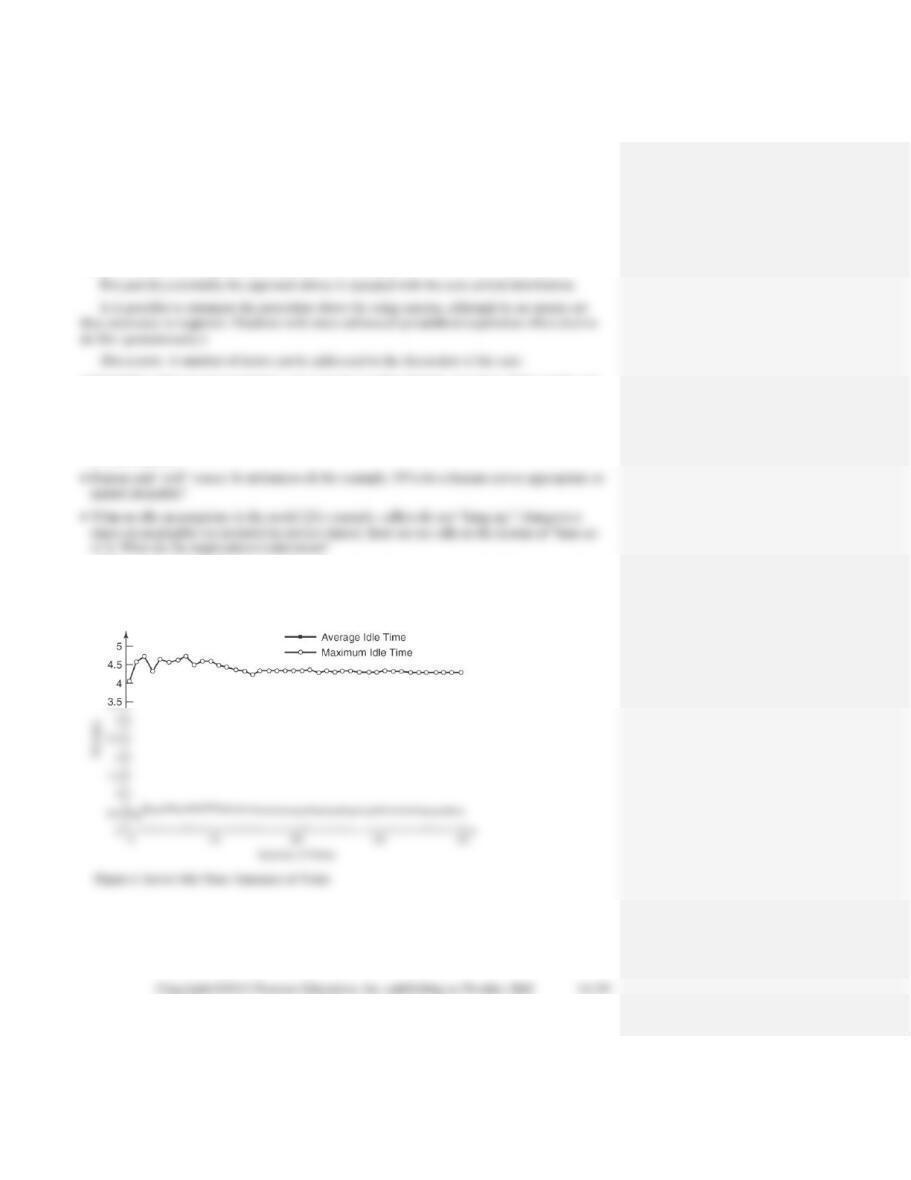
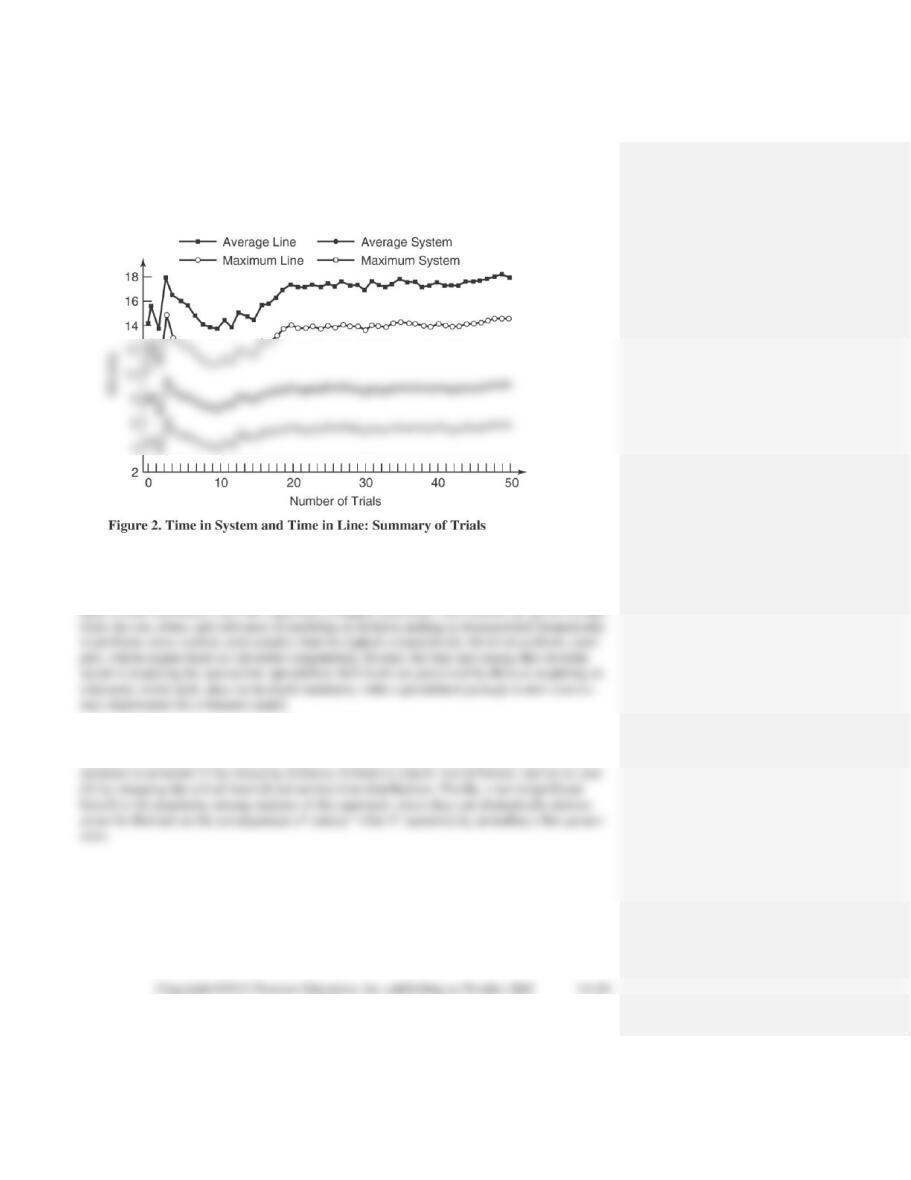
A straightforward way of determining when the various measures of performance have stabi-
lized is graphically (see Figures 1 and 2), and these long-term averages can be used to make rec-
ommendations regarding hiring a second reservation agent.
• Reliability of the recommendations, vis-à-vis the number of trials, structure of the model, and
so on.
• Importance of having relevant and meaningful measures of performance (for example, average
wait times may be low but if their standard deviation is large, the maximum times in line may
be unacceptable.
The model and simulation can easily be extended to become more realistic by incorporating
the various assumptions and simulating callers “hanging up,” multiple servers, and so on, de-
pending on the level of the class and the students’ familiarity with spreadsheets.
Conclu-
sion: The application described above, although not exceedingly complex, is nevertheless con–
sidered to be more realistic than could normally be attempted without resorting to a simulation
model. Even the least “quantitatively oriented” students persevere with implementation and ex-
perimentation of these models and based on formal feedback (evaluations) and informal feed-
The application described above has been used successfully in the classroom to demonstrate
the principles and usefulness of simulation. Clearly, many other (nonqueuing) situations lend
themselves to be modeled in the same manner. The case can readily be updated/renewed from

SOLUTION TO STATEWIDE DEVELOPMENT CORPORATION CASE
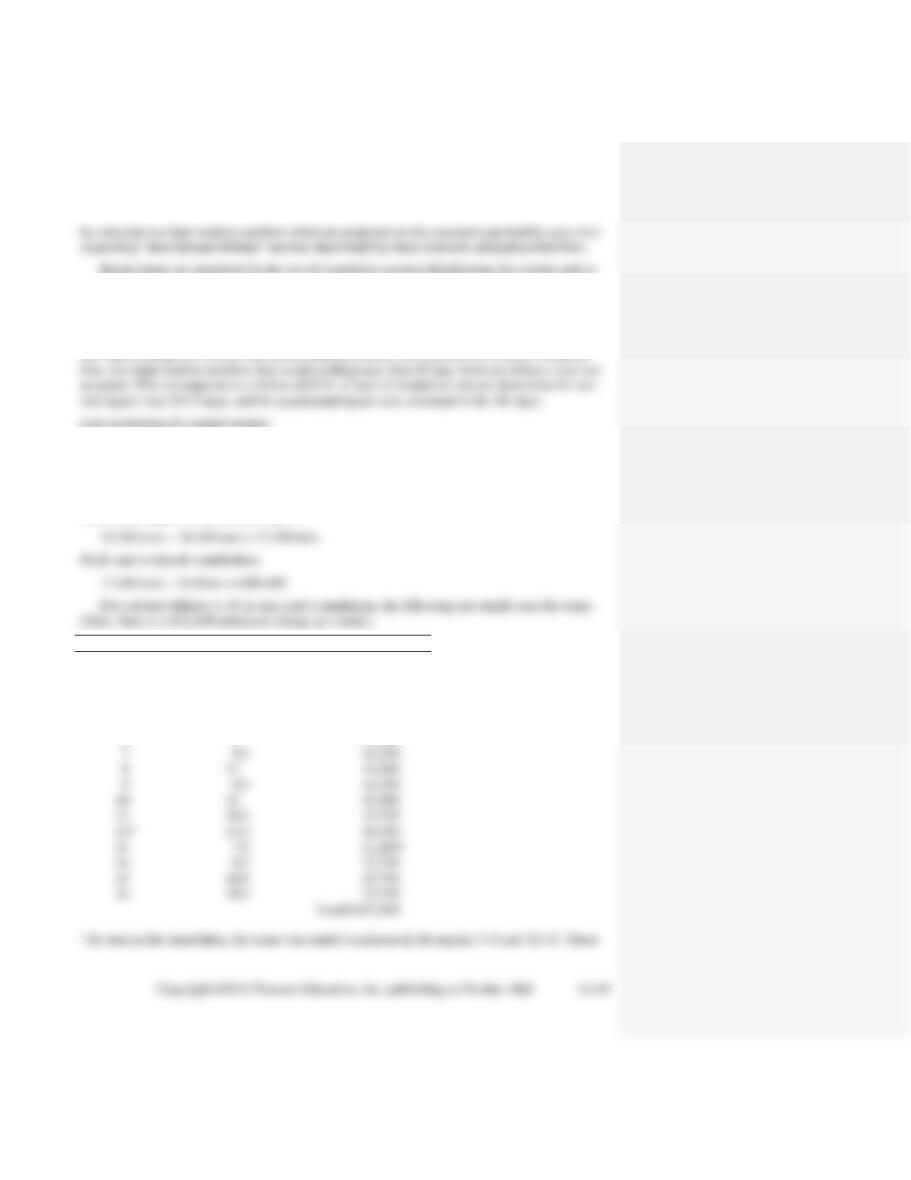
We will assume that the time of concern is from 8:00 a.m. until 8:00 p.m. each weekend day.
The results will vary based on the random numbers used. However, the following tables can be
used to assign random numbers to the events. The times are expressed in hours.
Time between
Cumulative
Random number
calls (Hrs.)
Probability
probability
interval
0.5
0.15
0.15
1–15
1.0
0.30
0.45
16–45
1.5
0.30
0.75
46–75
Cumulative
Random number
Time for repair
Probability
probability
interval
0.5
0.45
0.45
1–45
1.5
0.20
0.95
76–95
2.0
0.05
1.00
96–00
Trip for
Cumulative
Random number
supplies
Probability
probability
interval
No
0.9
0.9
1–9
0.1
1.0
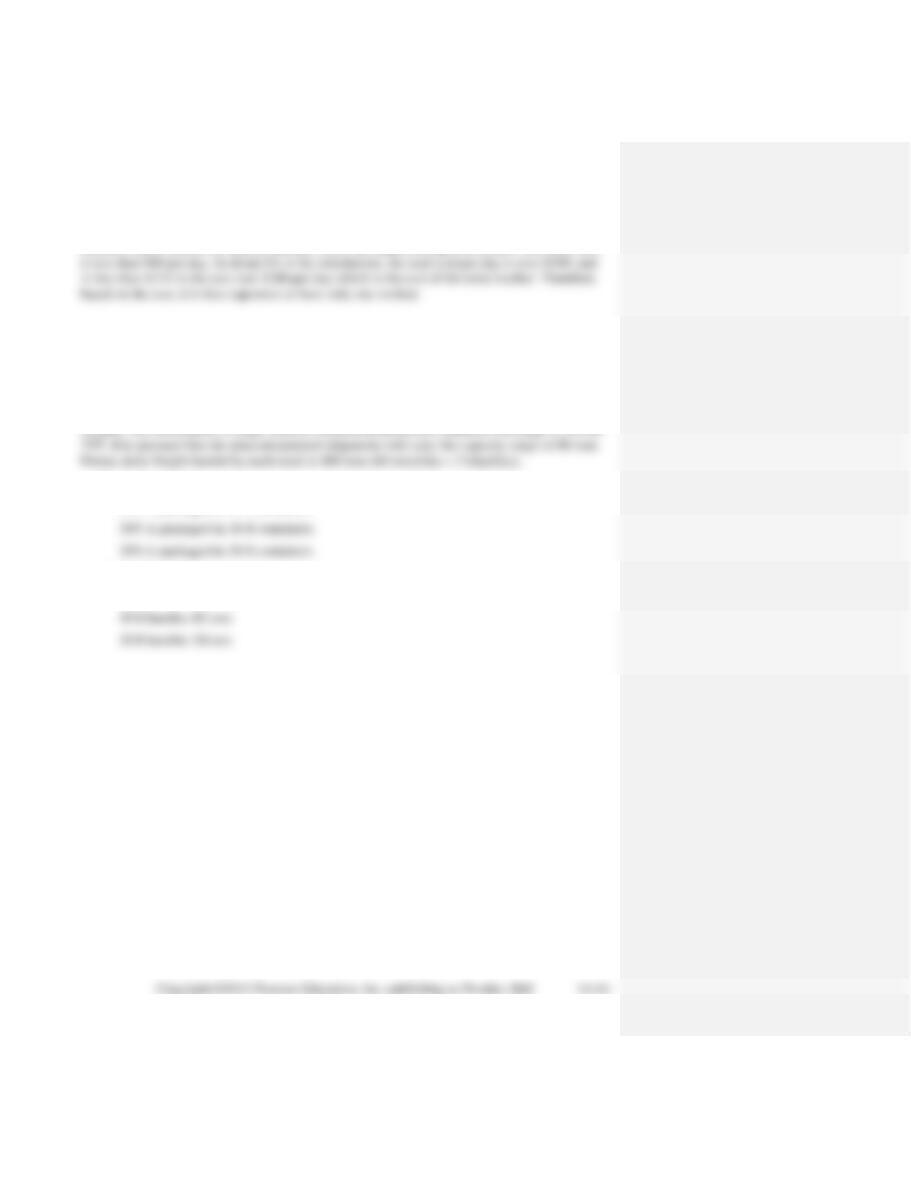
The time for a repair that requires a trip to the supply house will be 2 hours and 30 minutes –
30 minutes to find the problem, 1 hour to make the trip, and 1 hour to install the part.
Using an Excel spreadsheet, the simulation can be performed as shown.
Time
RN for supply
Time
RN for
Time for
Call
RN for
Until next
Time call
house
Trip needed
work
repair
job with
Work
Waiting
Number
call
call
arrives
trip
(time = 2.5)
begins
time
no trip
Ends
time
1
68
1.5
9.30
3
No
9:30
55
1
10:30
0
2
63
1.5
11:00
1
No
87
1.5
12:30
0
3
28
1
12:00
5
No
68
1
0:30
4
91
2
2:00
0
2:00
21
2.5*
0
A similar table was developed in an Excel spreadsheet. While different simulations produced
different results due to the random numbers used, the typical cost paid to tenants who must wait
SOLUTIONS TO INTERNET CASES
SOLUTION TO ABJAR TRANSPORT COMPANY CASE
Table 1 uses a cumulative normal distribution of monthly cargo tonnages in generating freight
weights. The distribution of cargo between containerized and non-containerized cargo is 25% to
For containerized cargo:
60% is packaged in 40-ft containers
Cargo weights:
40 ft handles 60 tons
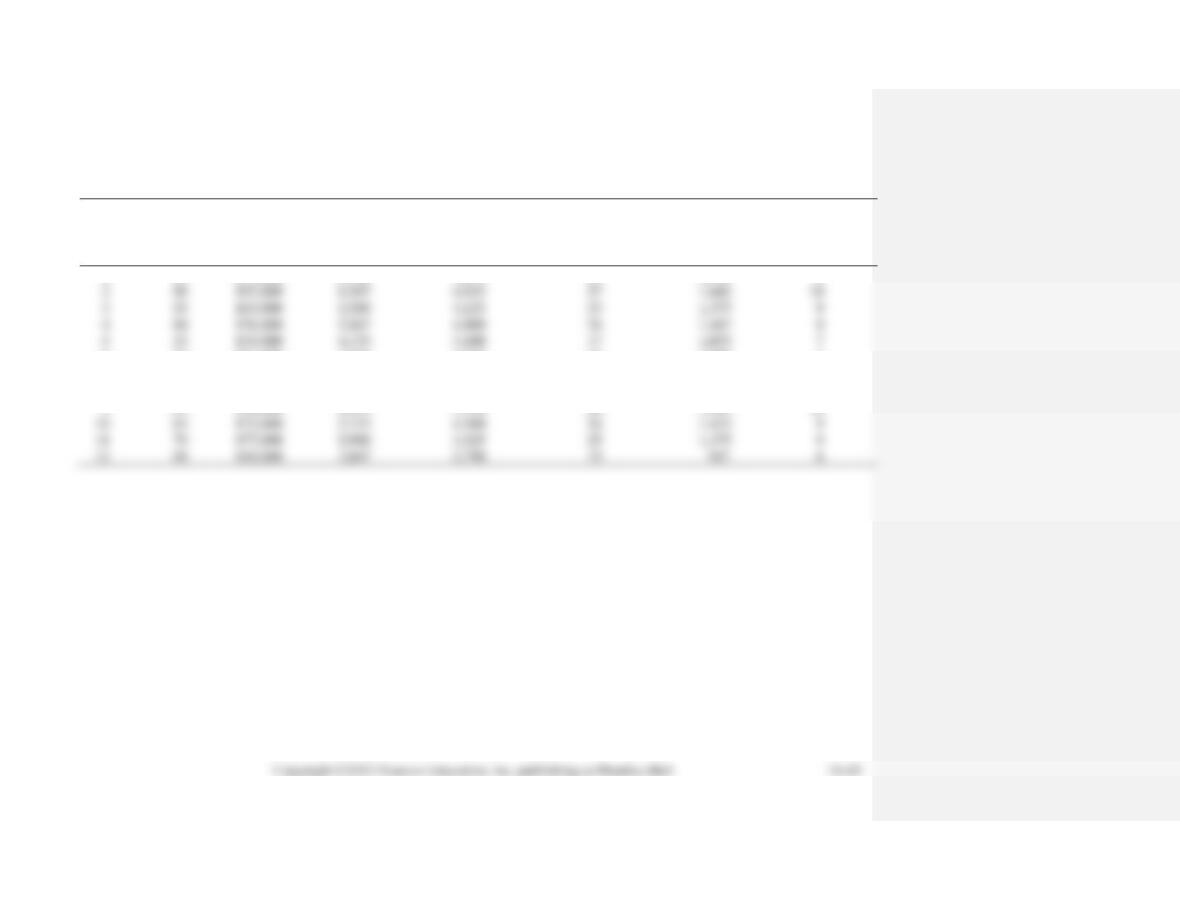
Table 1
Trucks
Trucks
Freight
Required
Required
per Day
75%
3 Trips/Day
25%
3 Trips/Day
Mo.
RN
Freight
(30 Days)
Noncontainerized
60 Tons/Trip
Containerized
53 Tons/Trip
1
63
171,000
5,700
4,275
24
1,425
9
2
88
197,000
6,567
4,925
27
1,642
10
3
55
165,000
5,500
4,125
23
1,375
9
4
69
176,000
5,867
4,400
24
1,467
9
6
17
131,000
4,367
3,275
18
1,092
7
7
36
150,000
5,000
3,750
21
1,250
8
8
81
186,000
6,200
4,650
26
1,550
10
9
84
190,000
6,333
4,750
26
1,583
10
70
177,000
5,900
4,425
25
1,475
9
06
110,000
3,667
2,750
15
6
It is noted that a truck can carry two 20-foot containers, so that the total cargo is 40 tons.
Thus average cargo hauled by containerized freight is 53 tons, or 0.6 60 + 0.2 45 + 0.2 40.
Daily cargo hauled is 3 53 = 159 tons/day.
Biales Waste Disposal, GMBH.:
Costs in German Marks (DM):
Shipment:
DM 900 per load
Loading/unloading
DM 120 per load
Overhead (DM 41,000/25)
DM 1,640 per load
DM 2,660 per load
Probability distributions for Bialis Waste Disposal case study:
Random
Revenue
Random
Number of
Number
per
Number
Barrels Load-
ed
Probability
Interval
Barrel
Probability
Interval
26–30 (28)
0.12
01–12
DM50
0.20
01–20
31–35 (33)
0.16
13–28
DM60
0.44
21–64
Number
Revenue
Truckload
Random
of
Random
per
Total
Simulation
Number
Barrels
Number
Barrel
Revenue
1
52
38
06
DM50
DM1,990
37
38
63
60
2,280
82
43
57
60
2,580
4
69
43
02
50
2,150
98
48
94
80
3,840
96
48
52
60
2,880
33
38
69
70
2,660
8
50
38
33
60
2,280
9
88
43
32
60
2,580
10
90
48
30
60
2,880
11
50
38
48
60
2,280
12
27
33
88
70
2,310
13
45
38
14
50
1,900
14
81
43
02
50
2,150
15
66
43
83
70
3,010
16
74
43
05
50
2,150
17
30
38
34
60
2,280
18
59
43
55
60
2,580
19
67
43
09
50
2,150
20
60
43
77
70
3,010
21
60
43
08
50
2,150
23
53
43
84
70
3,010
24
69
43
84
70
3,010
25
37
38
77
70
2,660
Average income per load = DM2,544.40
The conclusion, based on just one short simulation, is that money will be lost by continuing ser-
vice to Italy.
Buffalo Alkali and Plastics
The solution to the case is based on Monte Carlo simulation of shell failures and repairs by nor-
celerated repair procedures. It is suggested that the student begins the simulation process by us-
ing only the routine repair procedure. Calciner availability should become apparent as the simu-
lation process is executed.
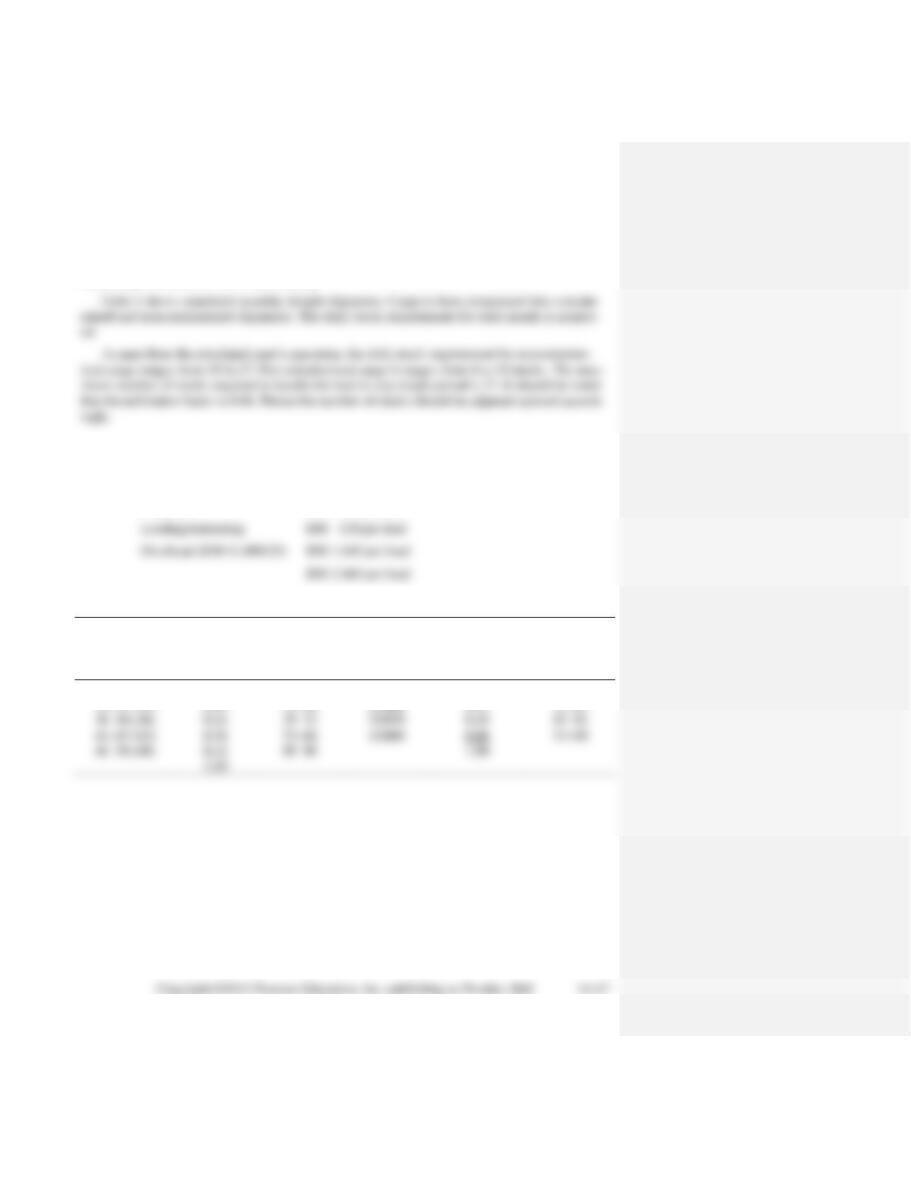
Table 1, on the next page, is a one year (366 days of failures) simulation of calciner failures
355.5 calciner days 100 tons/calciner day = 35,550 tons
Lost production for accelerated repairs:
181 calciner days 100 tons/calciner day = 18,100 tons
Additional output for accelerated repairs:
Dryer Failure
Repair Days
Cost
1
13
$19,500
2
9.5
14,250
3*
7
10,500*
4*
11
16,500
5*
12.5
18,750
6*
8
12,000
11
16,500
9
9.5
14,250
13
10.5
15,750
13.5
20,250
7.5
11,250*
12,750
10.5
15,750
10.5

represent only one rental and the minimum charge of $12,000 applies once each for these two
cases.
Hence, rental costs for 16 failures = $247,500; profit and overhead contribution amounts to
$209,400 for additional output. Since costs exceed contribution, the accelerated procedure should
not be adopted.
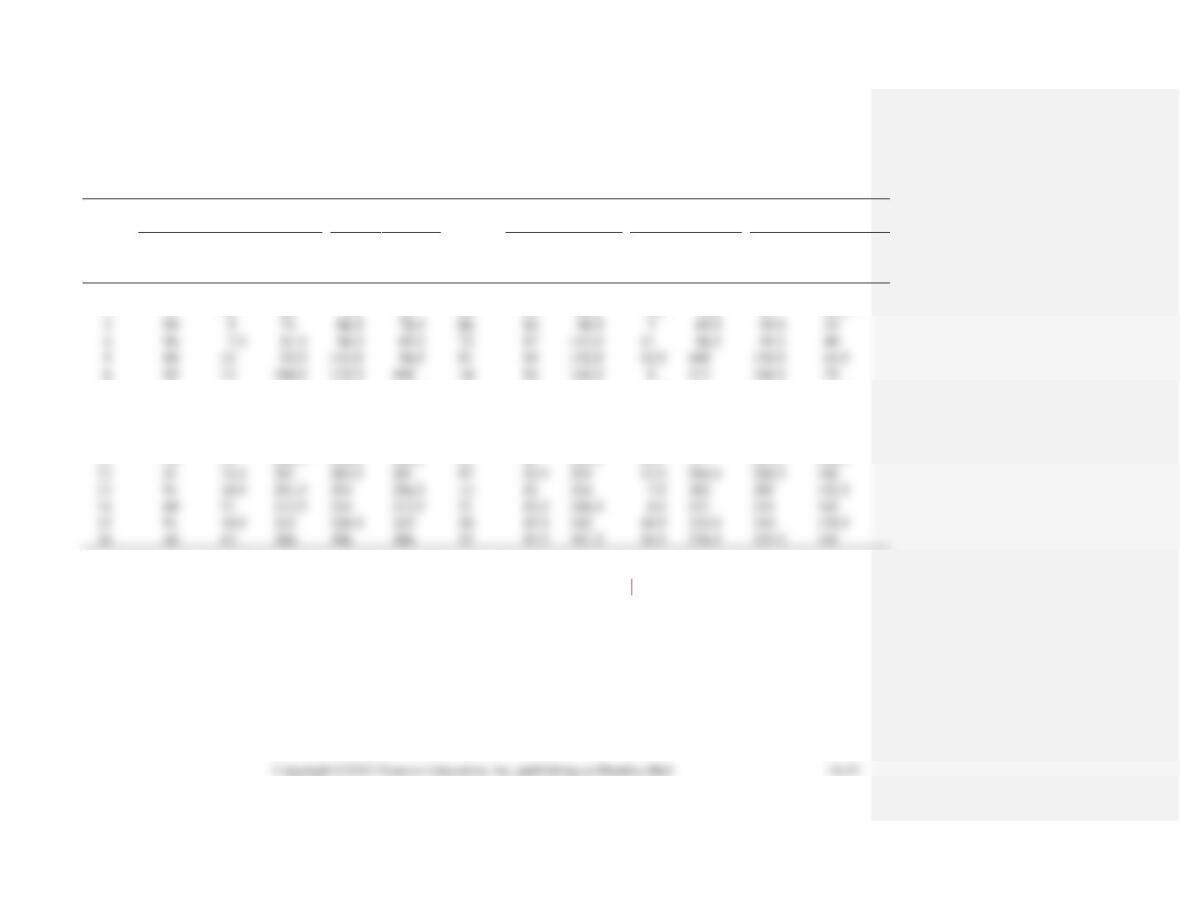
Table 1. Buffalo Alkali Simulation
Time
Time
Normal Repairs
Accelerated Re-
pairs
Cumulative
Dryer
Random
Between
Failure
Begin
Repairs
Random
Repair
Time
Repair
Time
Calciner
Downtime
Days
Failure
No.
Failure
Day
Normal
Accel.
Number
Time
Finished
Time
Finished
Normal
Accelerated
1
42
53
53
53
53
93
19.5
72.5
13
66
19.5
13
2
77
16
69
72.5
69
39
14
86.5
9.5
78.5
37*
22.5**
3
99
5
74
86.5
78.5
06
10
96.5
7
85.5
59.5
34
4
96
7.5
81.5
96.5
85.5
72
17
113.5
11
96.5
91.5
49
5
89
12
93.5
113.5
96.5
91
19
132.5
12.5
109
130.5
64.5
6
85
13
106.5
132.5
109
14
12
144.5
8
117
168.5
75
7
63
24
130.5
144.5
130.5
36
14
158.5
9.5
140
196.5
84.5
8
51
32
162.5
162.5
162.5
69
16.5
179
11
173.5
213
95.5
9
52
31
193.5
193.5
193.5
40
14
207.5
9.5
203
227
105
10
48
43
236.5
236.5
236.5
93
19.5
256
13
249.5
246.5
118
11
54
30
266.5
266.5
266.5
61
16
282.5
10.5
277
262.5
128.5
12
81
14.5
281
282.5
281
97
20.5
303
13.5
294.5
284.5
142
13
91
10.5
291.5
303
294.5
12
11
314
7.5
302
307
152.5
14
69
21
312.5
314
312.5
21
12.5
326.5
321
321
161
15
91
10.5
323
326.5
323
54
15.5
342
10.5
333.5
340
170.5
16
46
43
366
366
366
53
15.5
381.5
10.5
376.5
355.5
181
*37 days is calculated as follows: 3.5 days (elapse before repairs can begin) plus 14 days (repair) plus 19.5 (previous downtime).
**22.5 days is calculated as follows: 9.5 days (repair time) plus 13 days (previous downtime).
Figure 1. Server Idle Time: Summary of Trials
Figure 2. Time in System and Time in Line: Summary of Trials
Commented [KS2]: MK, I don’t know why these labels are
here. Should they be under figures 1 and 2?