CHAPTER 16
Statistical Quality Control
TEACHING SUGGESTIONS
Teaching Suggestion 16.1: Japan’s change in status since WWII.
Remind students that Japan began a few decades ago with perhaps the world’s worst quality and
that “Made in Japan” was synonymous with shoddy products just 45 years ago.
Teaching Suggestion 16.2: Four interesting quotes from QC expert Philip Crosby.
1. “The cost of quality is the expense of doing things wrong.”
Teaching Suggestion 16.3: Natural vs. assignable variations.
Random chance → “natural”
Specific cause → “assignable”
Teaching Suggestion 16.4: Mean and range charts.
ALTERNATIVE EXAMPLES
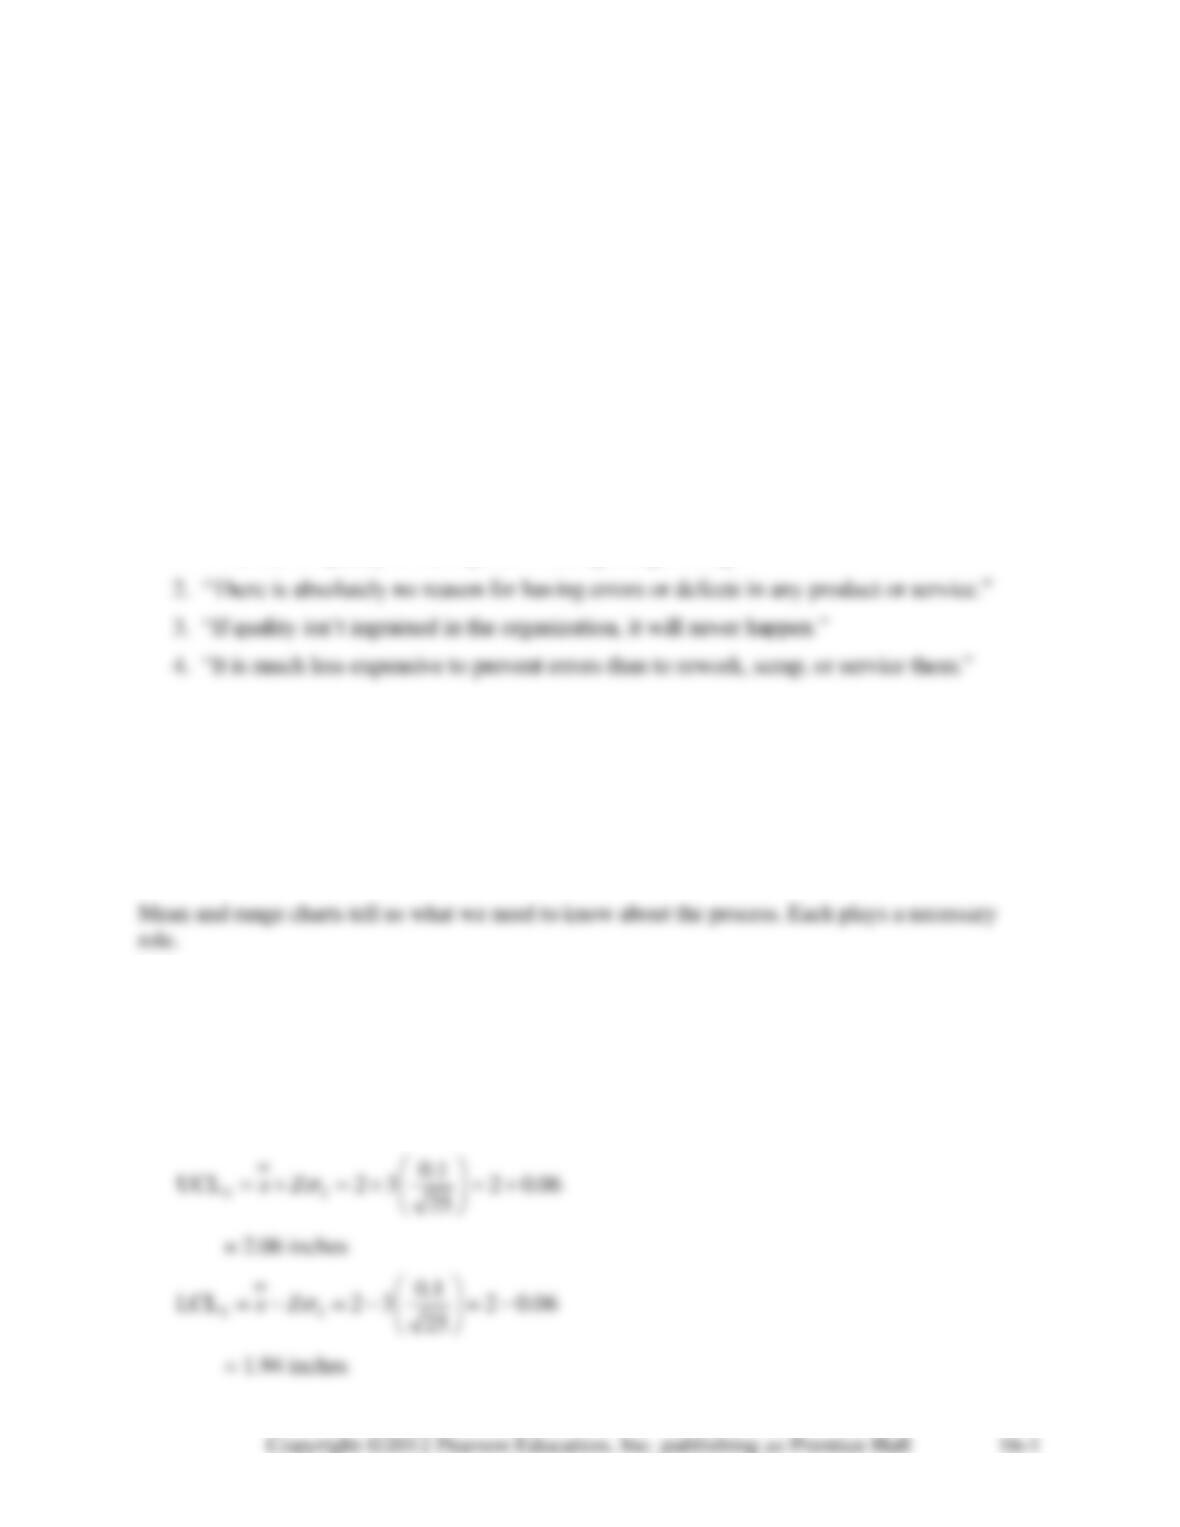
Alternative Example 16.1: Twenty-five engine mountings are sampled each day and found to
have an average width of 2 inches, with a standard deviation of 0.1 inch. To set control limits
that include 99.7% of sample means (Z = 3),
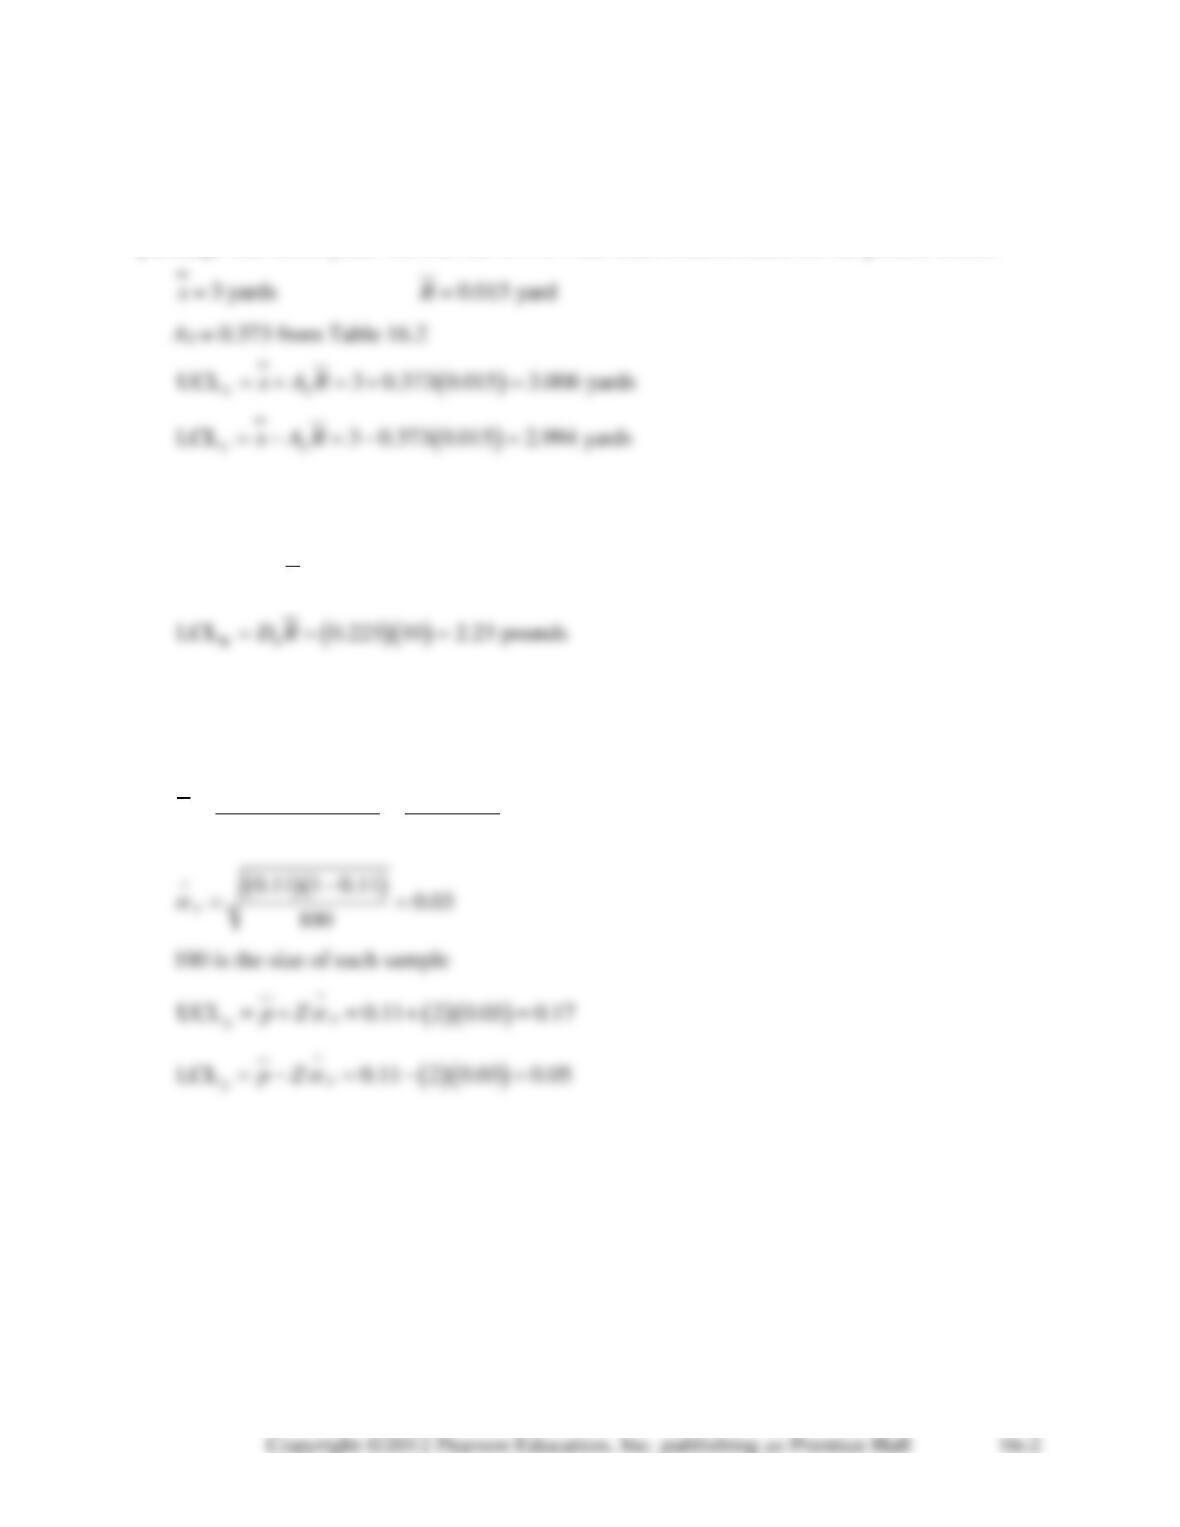
Alternative Example 16.2: Several samples of size n = 8 have been taken from today’s produc-
tion of fencing poles. The average of the sample means is 3 yards in length and the average sam-
ple range was 0.015 yard. We find the 99.7% x-bar chart control limits for the process below.
Alternative Example 17.3: The average range of a process is 10 pounds. The sample size is 10.
Using Table 16.2, D4 = 1.777, D3 = 0.223. The 99.7% R-chart control limits are
( )( )
R4
UCL 1.777 10 17.77 poundsDR= = =
Alternative Example 16.4: Based on samples of 20 IRS auditors, each observed handling 100
files, we find that the total number of mistakes made in handling files is 220. We set 95.45% p–
chart limits on this process below:
( )( )
total no. mistakes 220 0.11
total no. files 100 20
p= = =
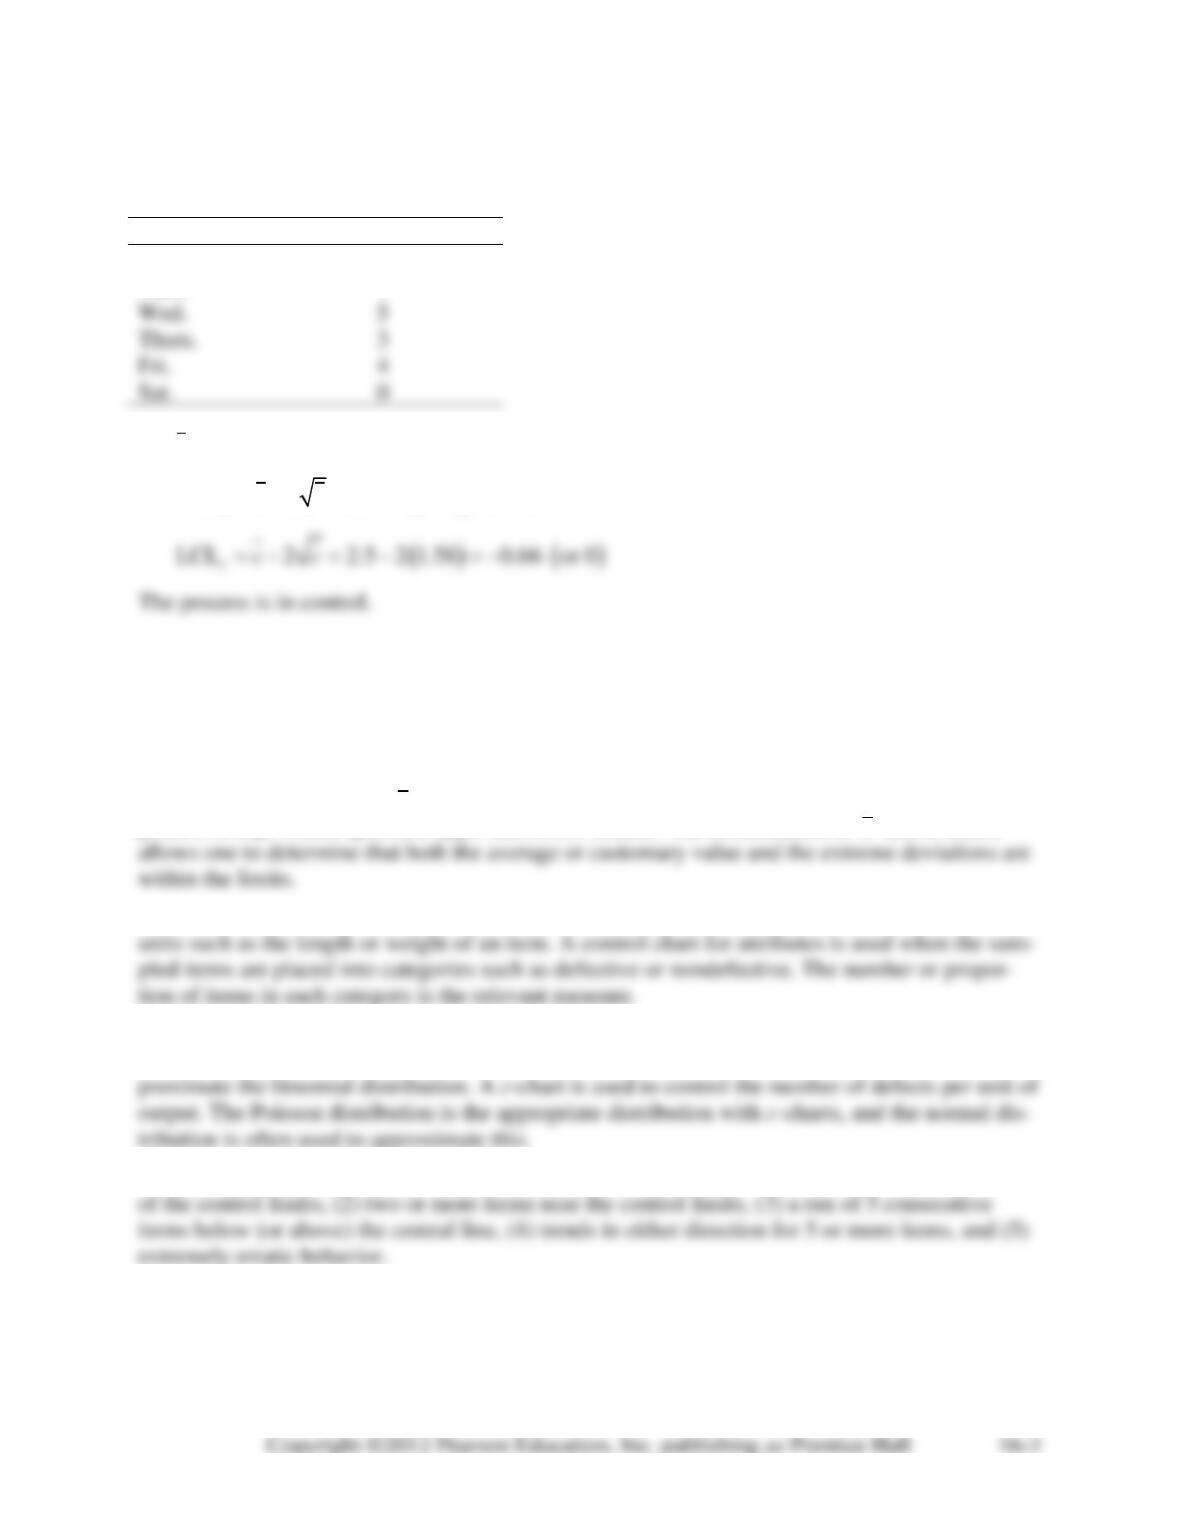
Alternative Example 16.5: There have been complaints that the sports page of the Dubuque
Register has lots of typos. The last six days have been examined carefully, and the number of
typos/page recorded below. Is the process in control, using Z = 2?
Day
Number of Typos
Mon.
2
Tues.
1
Wed.
5
Thurs.
3
Fri.
4
Sat.
0
15/ 6 2.5c==
The c-chart control limits are
( )
UCL 2 2.5 2 1.58 5.66
ccc= + = + =
SOLUTIONS TO DISCUSSION QUESTIONS AND PROBLEMS
16-1. The central limit theorem allows us to use the normal curve regardless of the distribution
of the population we are trying to control.
16-2. The ultimate goal of
x
– and R-charts is to ascertain, by a sampling procedure, that the
process is kept within specified upper and lower bounds. The combination of
x
and R-charts
16-3. A control chart for variables is used when the item of concern is measured in continuous
16-4. A p-chart measures the proportion of defective items in a sample. The binomial distribu-
tion is the appropriate distribution with p-charts, and the normal distribution is often used to ap-
16-5. Some patterns that would indicate a process is out of control are (1) one or more items out
16-6. A process might become out of control due to such factors as tool wear; a change in raw
materials; a change in working environment (temperature or humidity, for example); tired or
poorly trained labor; or an employee using a different (and potentially better) method.
16-7. Any time that one samples less than the entire lot of the product, there is the possibility of
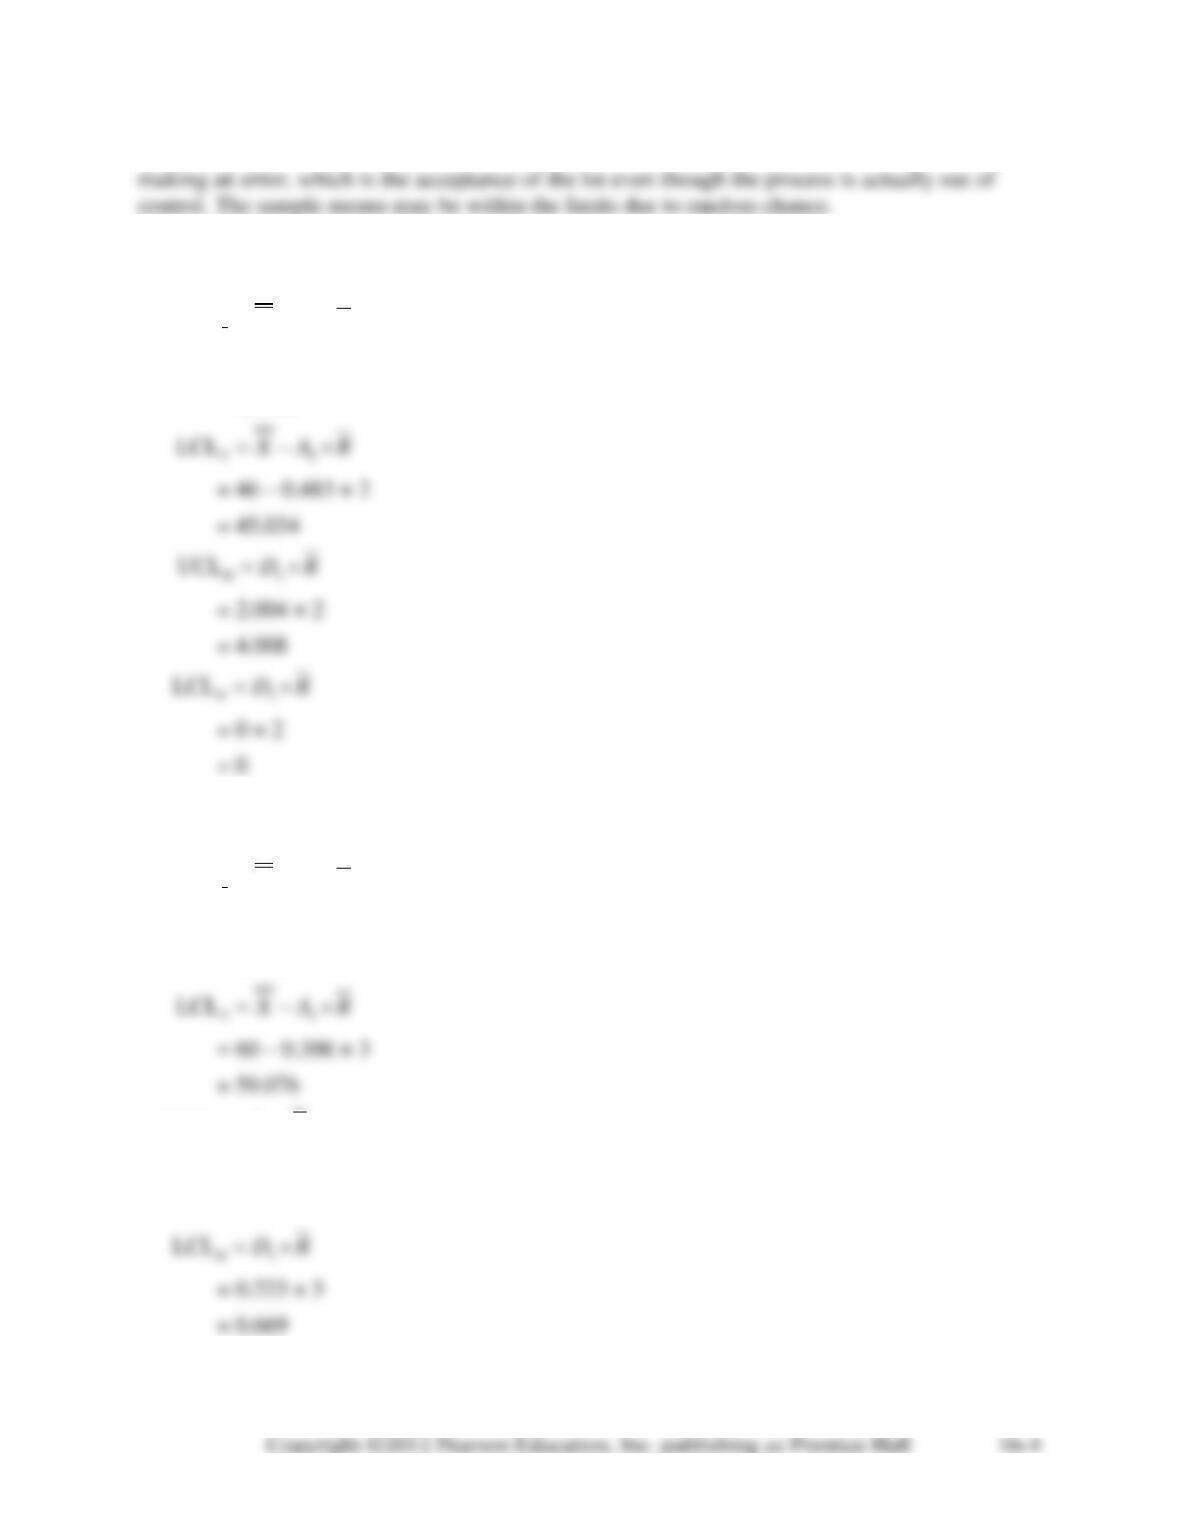
16-8. n = 6
From Table 16.2, A2 = 0.483, D4 = 2.004, D3 = 0
2
UCLxX A R= +
= 46 + 0.483 × 2
= 46.966
4
UCLRDR=
16-9. n = 10
From Table 16.2, A2 = 0.308, D4 = 1.777, D3 = 0.223
2
UCLxX A R= +
= 60 + 0.308 × 3
= 60.924
4
UCLRDR=
= 1.777 × 3
= 5.331
16-10. n = 8
From Table 16.2, A2 = 0.373, D4 = 1.864, D3 = 0.136
2
UCLxX A R= +
2
LCLxX A R= −
= 17 – 0.373 × 0.5
= 16.814
16-11. n = 4
From Table 16.2, A2 = 0.729, D4 = 2.282, D3 = 0.0
2
UCLxX A R= +
= 10.04 + 0.729 × 0.52
= 10.42
2
LCLxX A R= −
= 10.04 – 0.729 × 0.52
= 9.66
The smallest sample mean is 9.9, the largest 10.2. Both are well within the control limits. Simi-
larly, the largest sample range is 0.6, also well within the control limits. Hence, we can conclude
that the process is currently within control.
One step the QC department might take would be to increase the sample size to provide a
clearer indication as to both control limits and whether or not the process is in control.
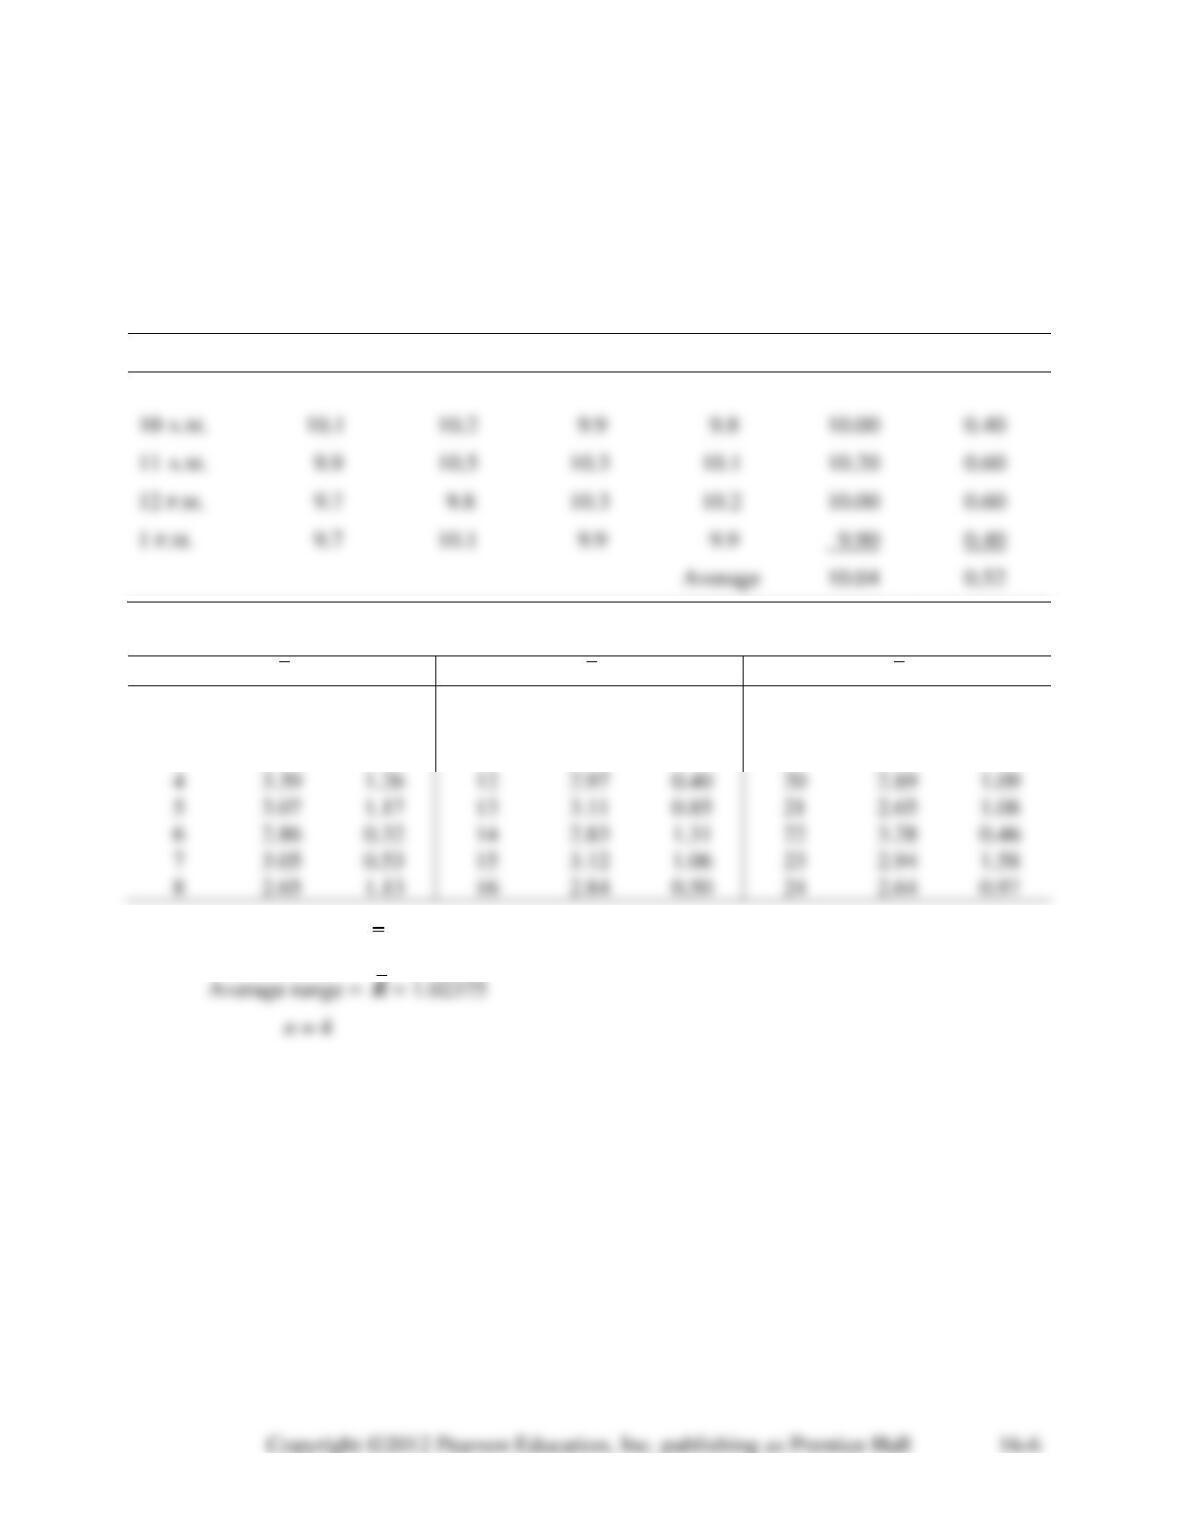
Table for Problem 16-11
Time
Box 1
Box 2
Box 3
Box 4
Average
Range
9 A.M.
9.8
10.4
9.9
10.3
10.10
0.60
10 A.M.
10.1
10.2
9.9
9.8
10.00
0.40
12 P.M.
9.7
9.8
10.3
10.2
10.00
0.60
1 P.M.
9.7
10.1
9.9
9.9
9.90
0.40
10.04
0.52
16-12.
Hour
X
R
Hour
X
R
Hour
X
R
1
3.25
0.71
9
3.02
0.71
17
2.86
1.43
2
3.10
1.18
10
2.85
1.33
18
2.74
1.29
3
3.22
1.43
11
2.83
1.17
19
3.41
1.61
4
3.39
1.26
12
2.97
0.40
20
2.89
1.09
5
3.07
1.17
13
3.11
0.85
21
2.65
1.08
6
2.86
0.32
14
2.83
1.31
22
3.28
0.46
7
3.05
0.53
15
3.12
1.06
23
2.94
1.58
8
2.65
1.13
16
2.84
0.50
24
2.64
0.97
Average length =
x
= 2.982
From Table 16.2, A2 = 0.729, D4 = 2.282, D3 = 0.0
4
UCLRDR=
= 2.282 × 1.024
= 2.336
The smallest sample mean is 2.64, the largest 3.41. Both are well within the control limits. Simi-
larly, the largest sample range is 1.61, also well within the control limits. Hence, we can con-
clude that the process is currently within control.
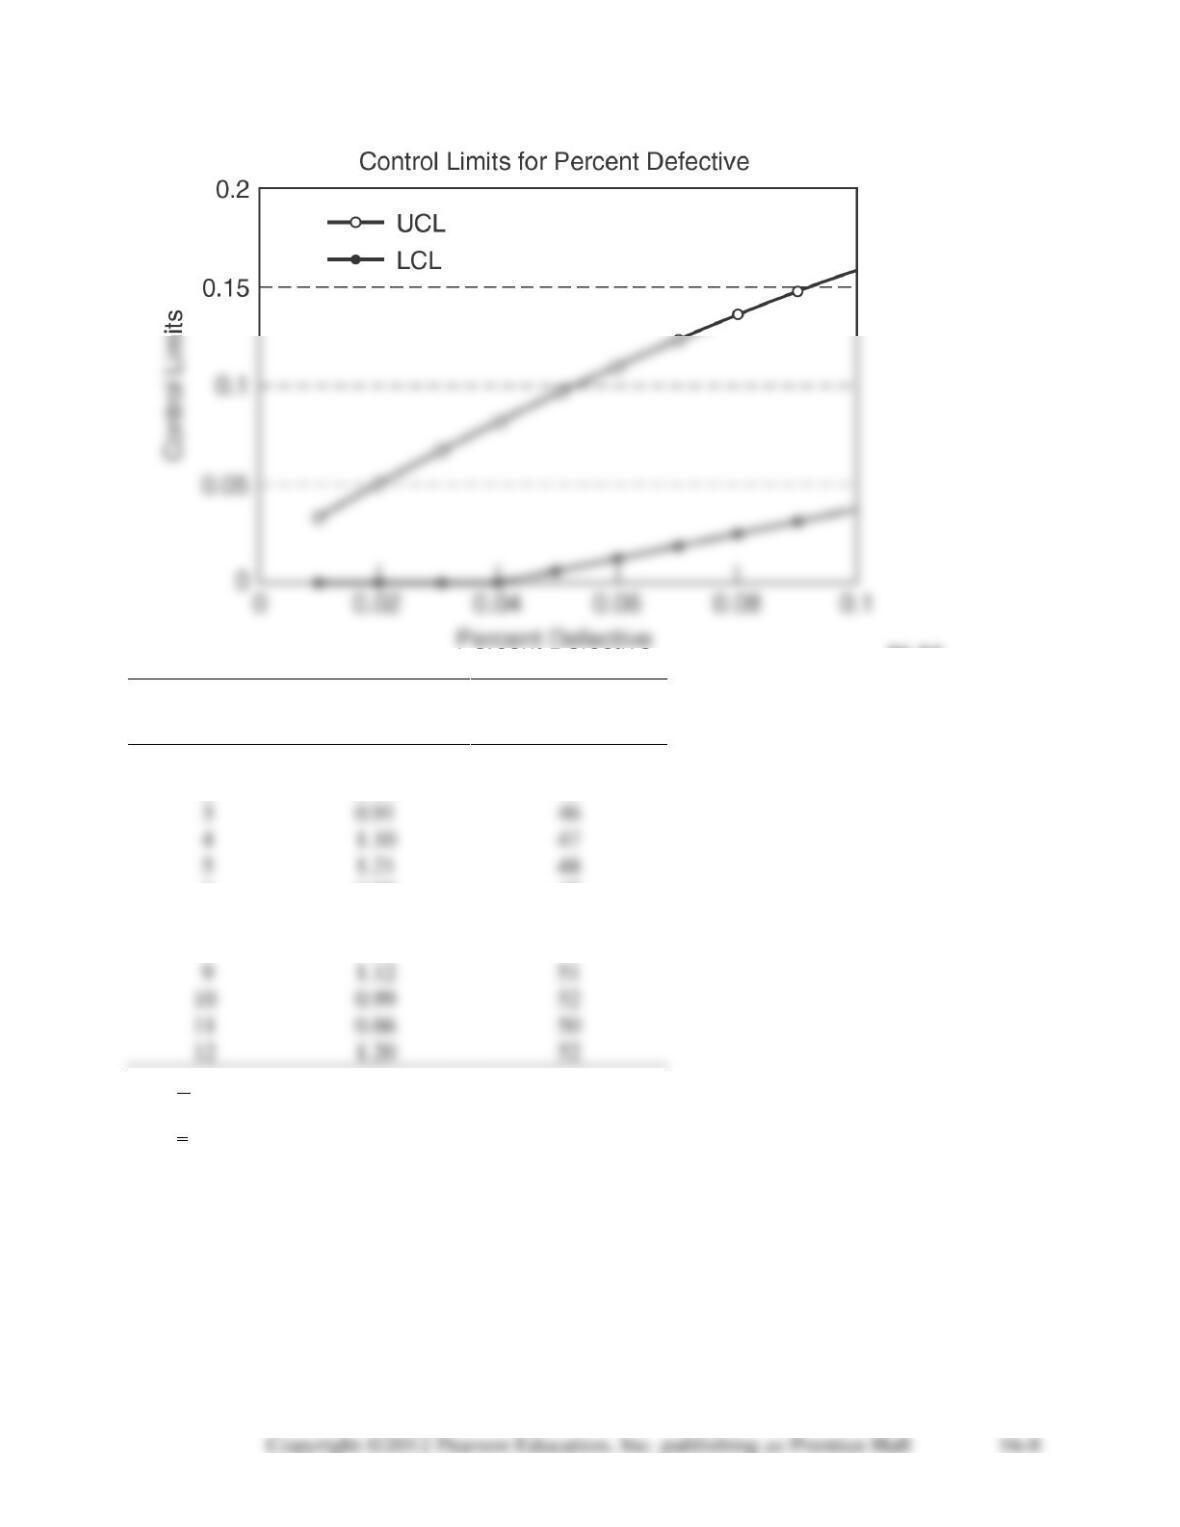
16-13.
( )
1
UCL 3
p
pp
pn
−
=+
Percent
Defective
p¯
1-p¯
(1 ) /p p n−
LCLp
UCLp
0.01
0.99
0.0070
0.0
0.0311
0.02
0.98
0.0099
0.0
0.0497
0.03
0.97
0.0121
0.0
0.0662
0.04
0.96
0.0139
0.0
0.0816
0.05
0.95
0.0154
0.0038
0.0962
0.06
0.94
0.0168
0.0096
0.1104
0.07
0.93
0.0180
0.0159
0.1241
0.08
0.92
0.0192
0.0225
0.1375
0.09
0.91
0.0202
0.0293
0.1507
0.10
0.90
0.0212
0.0364
0.1636
16-14.
Sample
Sample
Sample
Number
Range
Mean
1
1.10
46
2
1.31
45
3
0.91
46
4
1.10
47
5
1.21
48
6
0.82
47
7
0.86
50
8
1.11
49
9
1.12
51
0.99
52
0.86
50
1.20
52
1.049R=
48.583x=
n = 12
From Table 16.2:
A2 = 0.226, D4 = 1.716, D3 = 0.284
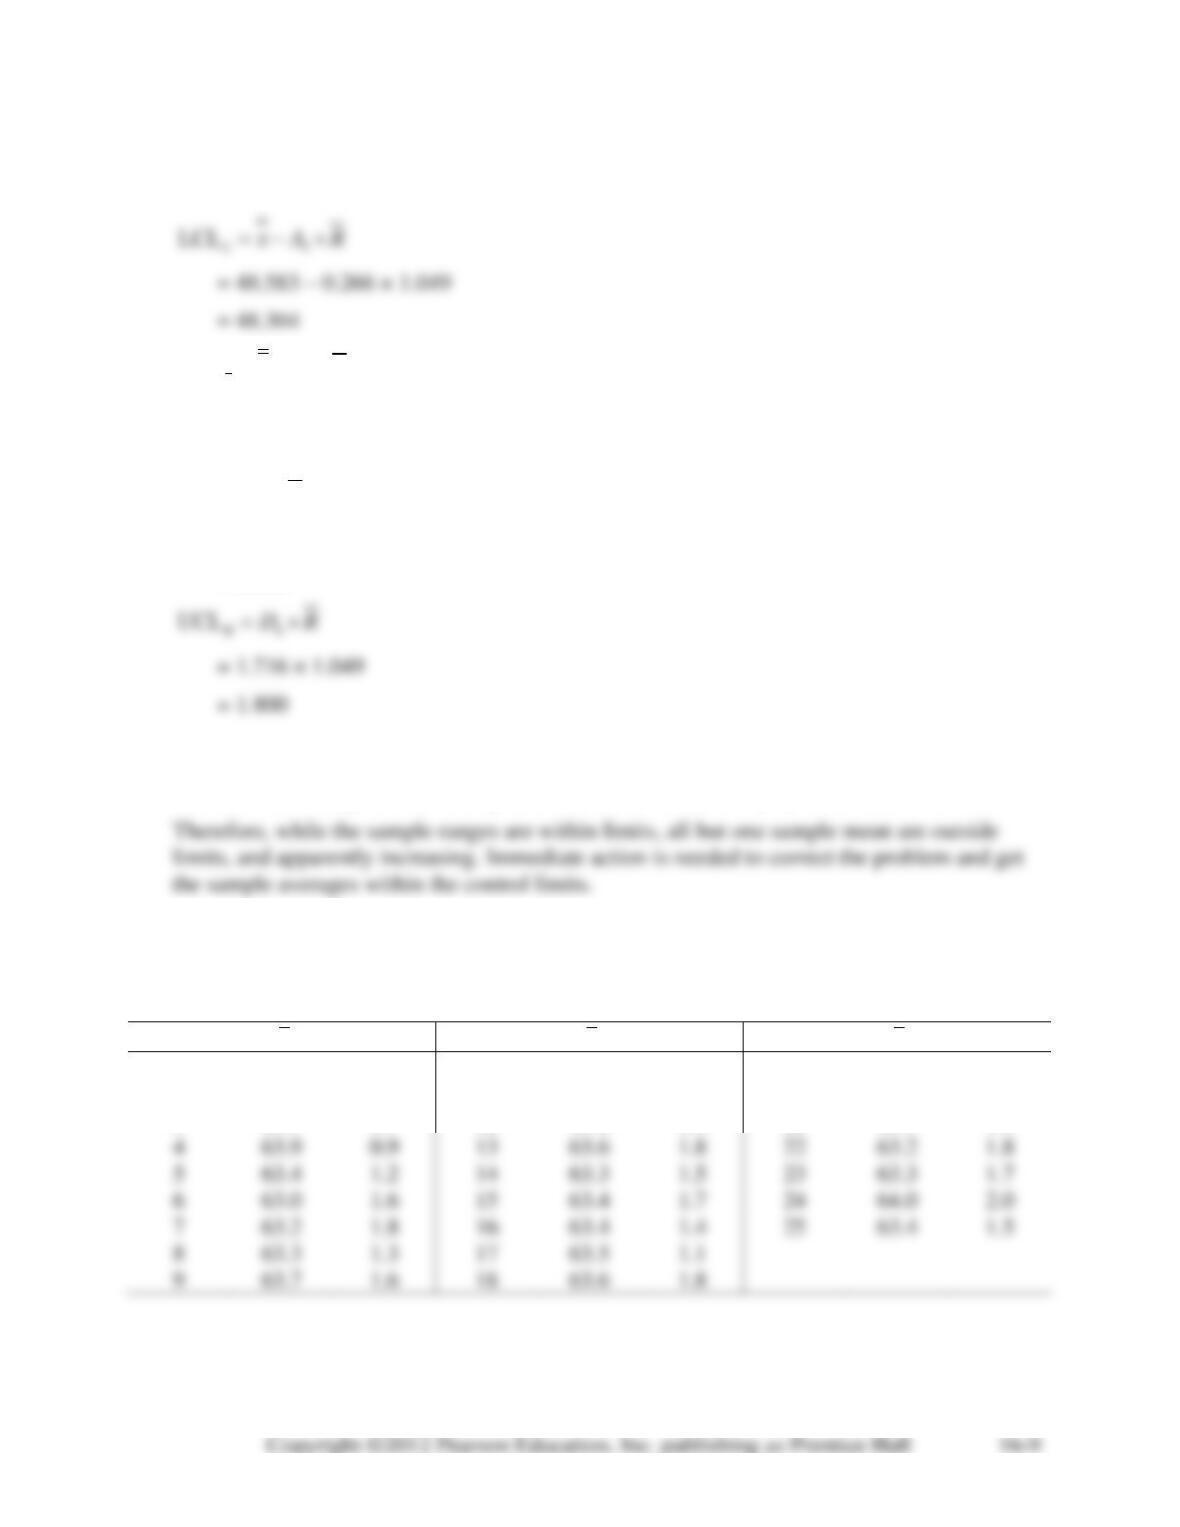
2
UCLxx A R= +
= 48.583 + 0.266 × 1.049
= 48.86
3
LCLRDR=
= 0.284 × 1.049
= 0.298
The smallest sample range is 0.82, the largest 1.31. Both are well within the control limits.
The smallest average is 45, the largest 52. Both are outside the proper control limits.
16-15. See the table.
Table for Problem 16-15
Sample
X
R
Sample
X
R
Sample
X
R
1
63.5
2.0
10
63.5
1.3
19
63.8
1.3
2
63.6
1.0
11
63.3
1.8
20
63.5
1.6
3
63.7
1.7
12
63.2
1.0
21
63.9
1.0
4
63.9
0.9
13
63.6
1.8
22
63.2
1.8
5
63.4
1.2
14
63.3
1.5
23
63.3
1.7
6
63.0
1.6
15
63.4
1.7
24
64.0
2.0
7
63.2
1.8
16
63.4
1.4
25
63.4
1.5
8
63.3
1.3
17
63.5
1.1
9
63.7
1.6
18
63.6
1.8
63.488x=
<ART FILE=”17_15eq01.eps” W=”41.895pt” H=”12pt” XS=”100%” YS=”100%”/>
1.496R=
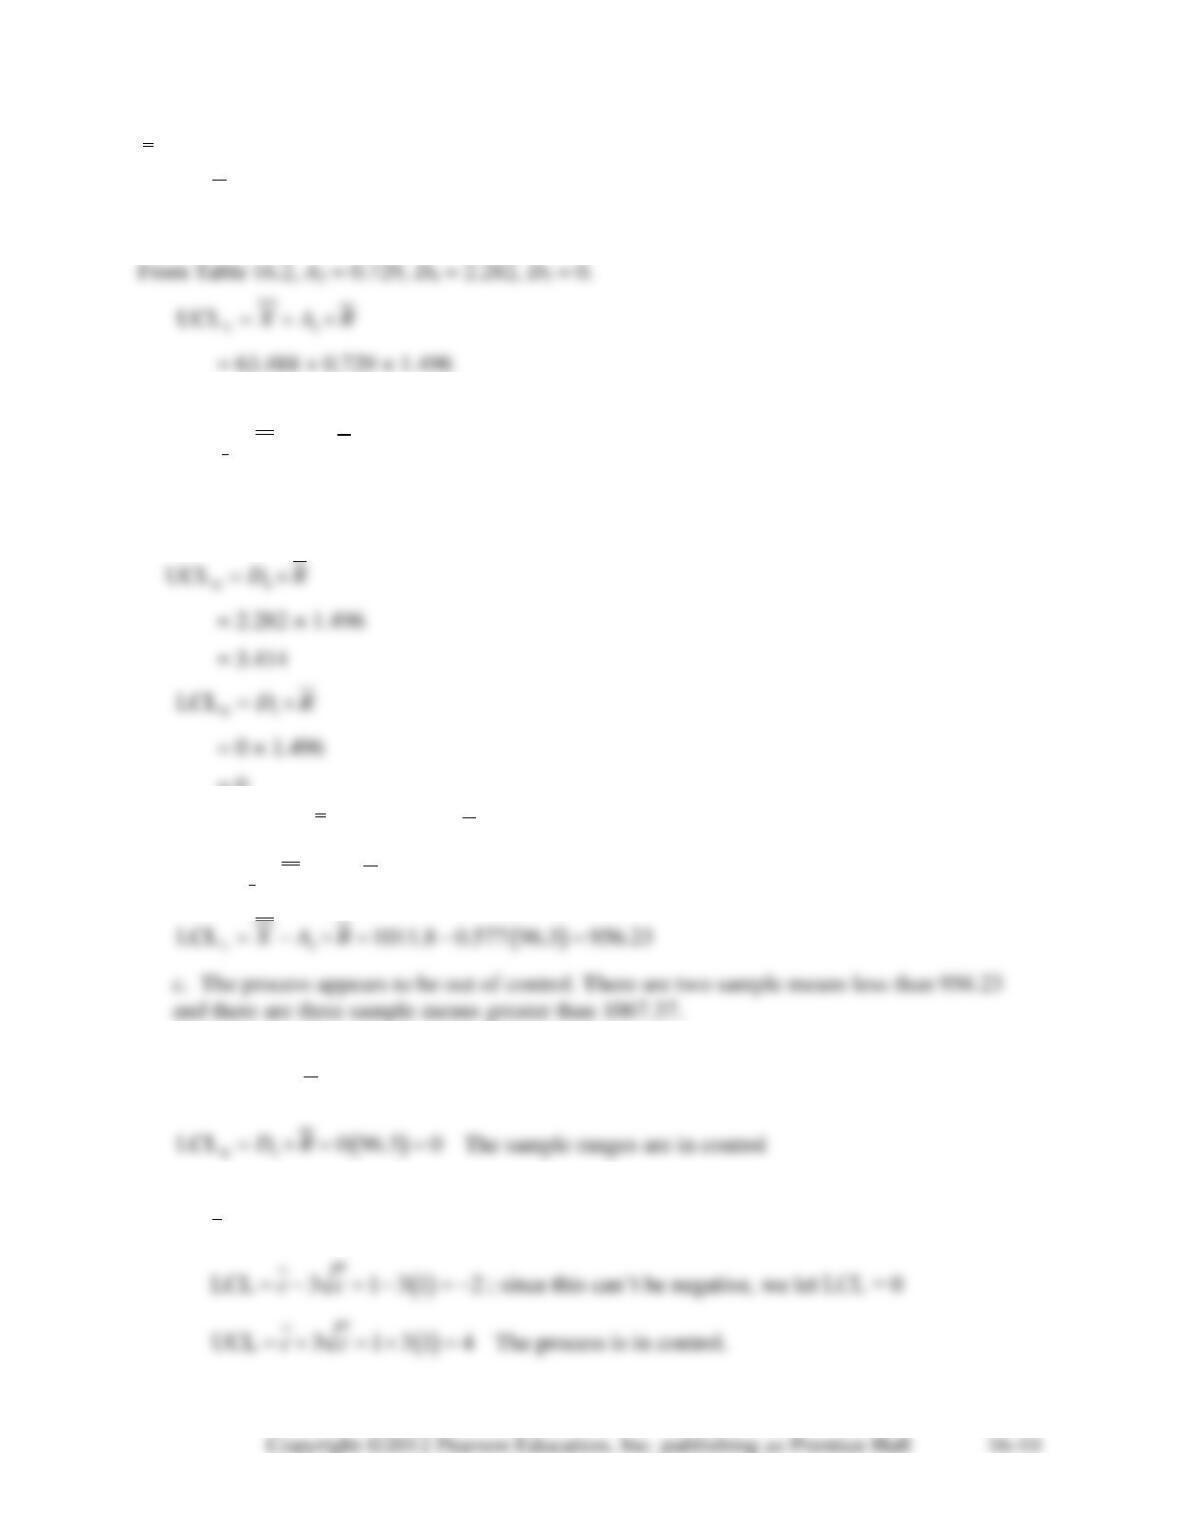
n = 4
= 64.6
2
LCLxX A R= −
= 63.488 – 0.729 × 1.496
= 62.4
= 0
16-16. a. We find
1011.8x=
and
96.3R=
. Then using Table 16.2 we find
b.
( )
2
UCL 1011.8 0.577 96.3 1067.37
xX A R= + = + =
16-17. We get D3 and D4 from Table 16.2. The limits are
( )
4
UCL 2.114 96.3 203.58
RDR= = =
16-18. Develop upper and lower control limits for a c-chart, we compute
20 / 20 1c==
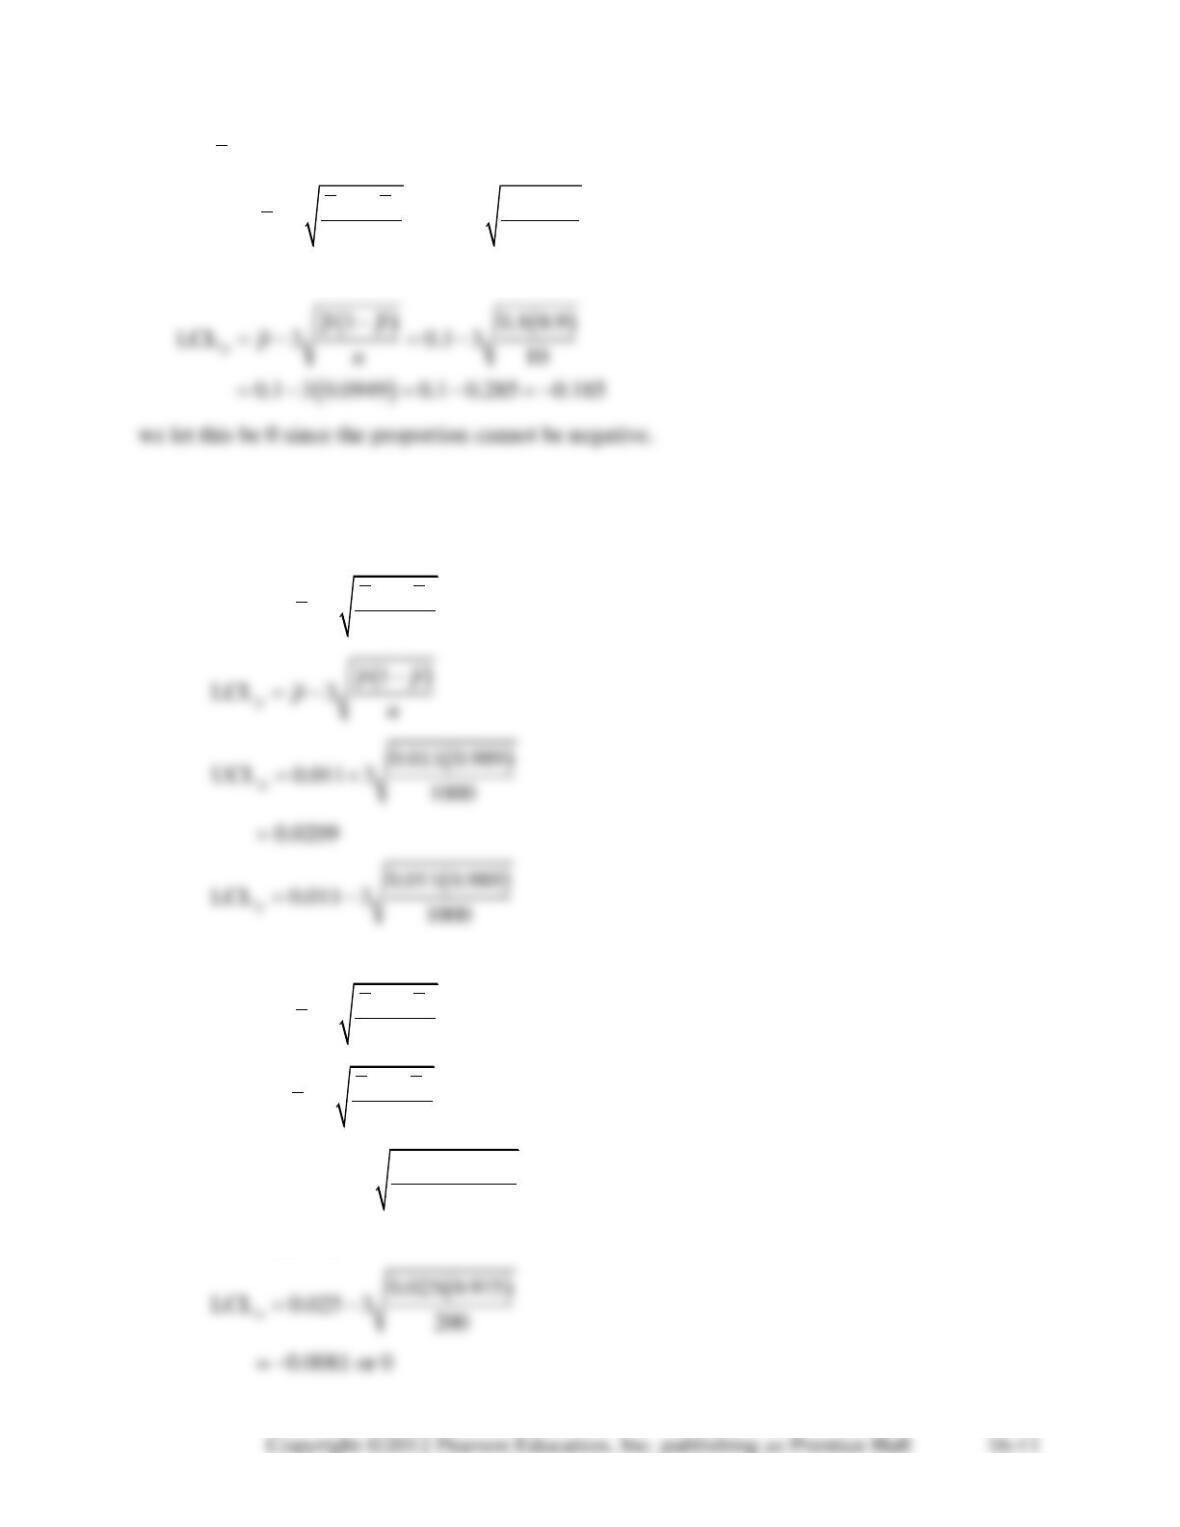
16-19.
0.1p=
( ) ( )
( )
1 0.1 0.9
UCL 3 0.1 3 10
0.1 3 0.0949 0.1 0.285 0.385
p
pp
pn
−
= + = +
= + = + =
SOLUTIONS TO INTERNET HOMEWORK PROBLEMS
16-20.
( )
1
UCL 3
p
pp
pn
−
=+
( )
1
LCL 3
p
pp
pn
−
=−
= 0.0011
16-21.
( )
1
UCL 3
p
pp
pn
−
=+
( )
1
LCL 3
p
pp
pn
−
=−
( )
0.025 0.975
UCL 0.025 3 200
p=+
= 0.0581
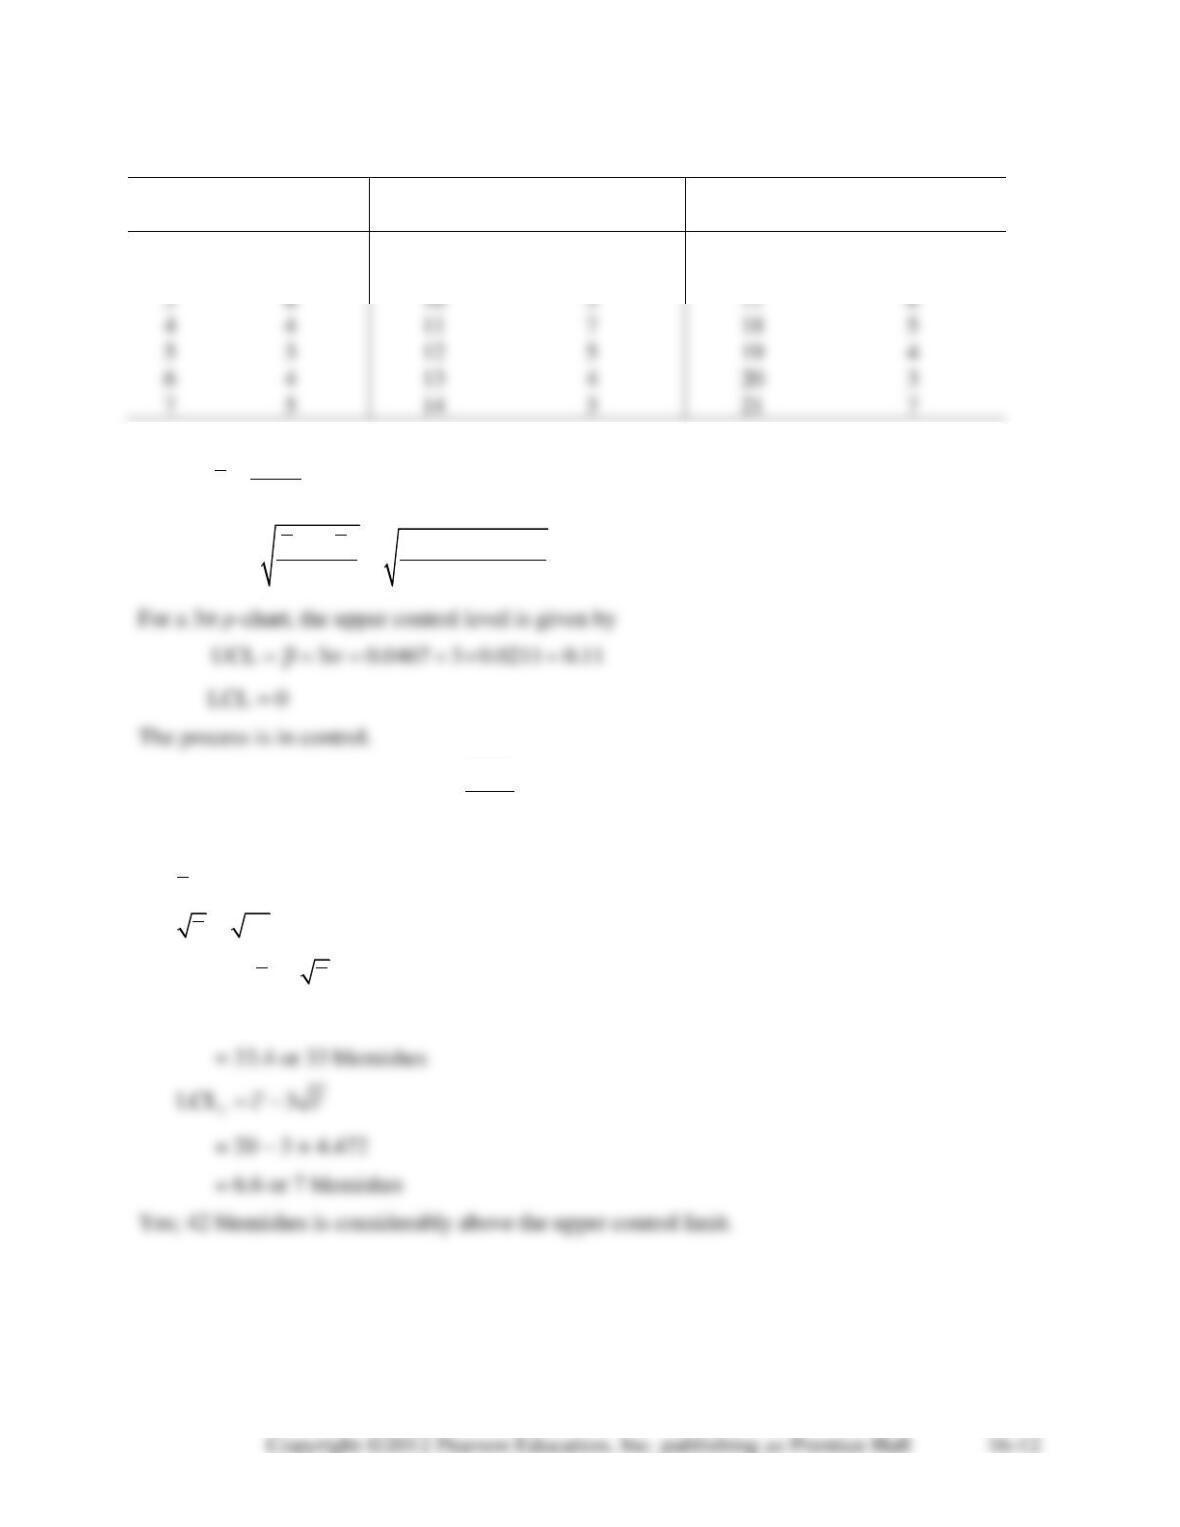
16-22.
Number
Number
Number
Day
Defective
Day
Defective
Day
Defective
1
6
8
3
15
4
2
5
9
6
16
5
3
6
3
17
6
4
4
7
18
5
5
3
5
19
4
6
4
4
20
3
7
5
3
21
7
0.0467
i
p
pN
==
( )
10.0467 0.9533 0.0211
100
p
pp
n
−
= = =
16-23. Average blemishes/table
2000 20
100
==
Using a normal approximation to the Poisson distribution:
20c=
20 4.472c==
UCL 3
ccc=+
= 20 + 3 × 4.472