Archives
Appendix A Homework Publishing as Prentice Hall. APPENDIXA Try It Yourself Solutions
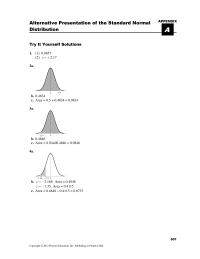
Alternative Presentation of the Standard Normal Distribution 507 APPENDIX A Try It Yourself Solutions 1. (1) 0.4857 (2) 2.17z=± 2a. b. 0.4834 c. Area = 0.5 + 0.4834 = 0.9834 3a. b. 0.4846 c. Area = 0.50+00.4846 = 0.9846 4a. […]
Appendix C Homework Because the points do not appear to be approximately linear
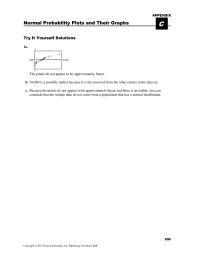
Normal Probability Plots and Their Graphs 508 APPENDIX C Try It Yourself Solutions 1a. The points do not appear to be approximately linear. b. 39,860 is a possible outlier because it is far removed from the other entries in the […]
Chapter 01 Data With Respect The Four Levels Measurement
Ch.1 IntroductiontoStatistics 1.1 AnOverviewofStatistics 1 DistinguishBetweenaPopulationandaSample SHORTANSWER.Writethewordorphrasethatbestcompleteseachstatementoranswersthequestion. Identifythepopulationandthesample. 1) Asurveyof1378Americanhouseholdsfoundthat27%ofthehouseholdsownacomputer. 2) When1094Americanhouseholdsweresurveyed,itwasfoundthat67%ofthemownedtwocars. 3) Asurveyof2625elementaryschoolchildrenfoundthat28%ofthechildrencouldbeclassifiedasobese. 2 DistinguishBetweenaParameterandaStatistic SHORTANSWER.Writethewordorphrasethatbestcompleteseachstatementoranswersthequestion. Determinewhetherthenumericalvalueisaparameterorastatistic.Explainyourreasoning. 4) Arecentsurveybythealumniofamajoruniversityindicatedthattheaveragesalaryof10,500ofits175,000 graduateswas$95,000. 5) Theaveragesalaryofallassembly–lineemployeesatacertaincarmanufactureris$41,000.. 6) Asurveyof1162studentswastakenfromauniversitywith10,000 students. 3 DistinguishBetweenDescriptiveStatisticsandInferentialStatistics MULTIPLECHOICE.Choosetheonealternativethatbestcompletesthestatementoranswersthequestion. Identifywhetherthestatementdescribesinferentialstatisticsordescriptivestatistics. 7) Theaverageageofthestudentsinastatisticsclassis19 years. A) descriptivestatistics B) inferentialstatistics 8) ThechancesofwinningtheCaliforniaLotteryareonechanceintwenty–twomillion. A) […]
Chapter 02 A city in the Pacific Northwest recorded its
Ch.2 DescriptiveStatistics 2.1 FrequencyDistributionsandTheirGraphs 1 InterpretaFrequencyDistribution MULTIPLECHOICE.Choosetheonealternativethatbestcompletesthestatementoranswersthequestion. Usethegivenfrequencydistributiontofindthe (a)classwidth. (b)classmidpointsofthefirstclass. (c)classboundariesofthefirstclass. 1) Height(ininches) Class Frequency,f 50–52 5 53–55 8 56–58 12 59–61 13 62–64 11 A) (a)3 (b)51 (c)49.5–52.5 B) (a)2 (b)51.5 (c)49.5–52.5 C) (a)3 (b)51 (c)50–52 D) (a)2 (b)51.5 […]
Chapter 06 Confidence Interval For The Population
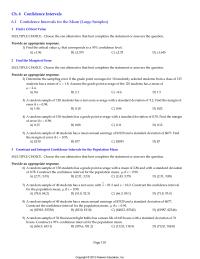
Ch.6 ConfidenceIntervals 6.1 ConfidenceIntervalsfortheMean(LargeSamples) 1 FindaCriticalValue MULTIPLECHOICE.Choosetheonealternativethatbestcompletesthestatementoranswersthequestion. Provideanappropriateresponse. 1) Findthecriticalvaluezcthatcorrespondstoa95%confidencelevel. A) ±1.96 B) ±2.575 C) ±2.33 D) ±1.645 2 FindtheMarginofError MULTIPLECHOICE.Choosetheonealternativethatbestcompletesthestatementoranswersthequestion. Provideanappropriateresponse. 2) Determinethesamplingerrorifthegradepointaveragesfor10randomlyselectedstudentsfromaclassof125 studentshasameanofx=1.8.Assumethegradepointaverageofthe125studentshasameanof μ=2.4. A) 0.6 B) 2.1 C) –0.6 D) 1.5 3) Arandomsampleof120studentshasatestscoreaveragewithastandarddeviationof9.2.Findthemarginof errorifc=0.98. A) 1.96 B) […]
Chapter 07 The dean of a major university claims that the mean
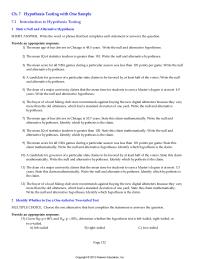
Ch.7 HypothesisTestingwithOneSample 7.1 IntroductiontoHypothesisTestin g 1 StateaNullandAlternativeHypothesis SHORTANSWER.Writethewordorphrasethatbestcompleteseachstatementoranswersthequestion. Provideanappropriateresponse. 1) ThemeanageofbusdriversinChicagois48.5 years.Writethenullandalternativehypotheses. 2) ThemeanIQofstatisticsteachersisgreaterthan110.Writethenullandalternativehypotheses. 3) ThemeanscoreforallNBAgamesduringaparticularseasonwaslessthan101 pointspergame.Writethenull andalternativehypotheses. 4) Acandidateforgovernorofaparticularstateclaimstobefavoredbyatleasthalfofthevoters.Writethenull andalternativehypotheses. 5) ThedeanofamajoruniversityclaimsthatthemeantimeforstudentstoearnaMasterʹsdegreeisatmost4.9 years.Writethenullandalternativehypotheses. 6) Thebuyerofalocalhikingclubstorerecommendsagainstbuyingthenewdigitalaltimetersbecausetheyvary morethantheoldaltimeters,whichhadastandarddeviationofoneyard.Writethenullandalternative hypotheses. 7) ThemeanageofbusdriversinChicagois53.7 years.Statethisclaimmathematically.Writethenulland alternativehypotheses.Identifywhichhypothesisistheclaim. 8) ThemeanIQofstatisticsteachersisgreaterthan120.Statethisclaimmathematically.Writethenulland alternativehypotheses.Identifywhichhypothesisistheclaim. 9) ThemeanscoreforallNBAgamesduringaparticularseasonwaslessthan101 pointspergame.Statethis claimmathematically.Writethenullandalternativehypotheses.Identifywhichhypothesisistheclaim. 10) […]
Chapter 08 Find The Standardized Test Statistic Test The
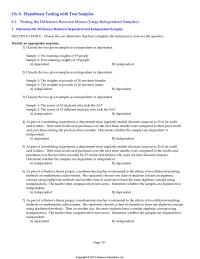
Ch.8 HypothesisTestingwithTwoSamples 8.1 TestingtheDifferenceBetweenMeans(LargeIndependentSamples) 1 DeterminetheDifferenceBetweenDependentandIndependentSamples MULTIPLECHOICE.Choosetheonealternativethatbestcompletesthestatementoranswersthequestion. Provideanappropriateresponse. 1) Classifythetwogivensamplesasindependentordependent. Sample1:Pre–trainingweightsof19people Sample2:Post–trainingweightsof19people A) dependent B) independent 2) Classifythetwogivensamplesasindependentordependent. Sample1:Theweightsinpoundsof26newbornfemales Sample2:Theweightsinpoundsof26newbornmales A) independent B) dependent 3) Classifythetwogivensamplesasindependentordependent. Sample1:Thescoresof10studentswhotooktheACT Sample2:Thescoresof10differentstudentswhotooktheSAT A) independent B) dependent 4) Aspartofamarketingexperiment,adepartmentstoreregularlymaileddiscountcouponsto25ofitscredit cardholders.Theirtotalcreditcardpurchasesoverthenextthreemonthswerecomparedtotheirpriorcredit cardpurchasesduringthepreviousthreemonths.Determinewhetherthesamplesaredependentor independent. A) dependent B) […]
Chapter 09 The Data Below Are The Final Exam
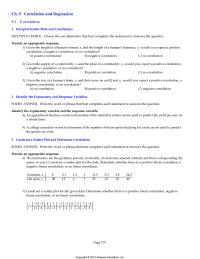
Ch.9 CorrelationandRegression 9.1 Correlation 1 InterpretScatterPlotsandCorrelations MULTIPLECHOICE.Choosetheonealternativethatbestcompletesthestatementoranswersthequestion. Provideanappropriateresponse. 1) Giventhelengthofahumanʹsfemur,x,andthelengthofahumanʹshumerus,y,wouldyouexpectapositive correlation,anegativecorrelation,ornocorrelation? A) positivecorrelation B) negativecorrelation C) nocorrelation 2) Giventhesupplyofacommodity,x,andthepriceofacommodity,y,wouldyouexpectapositivecorrelation, anegativecorrelation,ornocorrelation? A) negativecorrelation B) positivecorrelation C) nocorrelation 3) Giventhesizeofahumanʹsbrain,x,andtheirscoreonanIQtest,y,wouldyouexpectapositivecorrelation,a negativecorrelation,ornocorrelation? A) nocorrelation B) positivecorrelation C) negativecorrelation 2 IdentifytheExplanatoryandResponseVariables SHORTANSWER.Writethewordorphrasethatbestcompleteseachstatementoranswersthequestion. Identifytheexplanatoryvariableandtheresponsevariable. 4) […]
Chapter 1 Homework Perform Observational Study Because You Want Observe
CHAPTER Introduction to Statistics Copyright © 2012 Pearson Education, Inc. Publishing as Prentice Hall. 1 1.1 AN OVERVIEW OF STATISTICS 1.1 Try It Yourself Solutions 1a. The population consists of the prices per gallon of regular gasoline at all gasoline […]
Chapter 10 Find The Critical Value Test The Claim
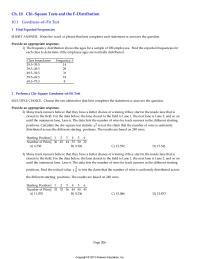
Ch.10 Chi–SquareTestsandtheF–Distribution 10.1 Goodness–o f –FitTest 1 FindExpectedFrequencies SHORTANSWER.Writethewordorphrasethatbestcompleteseachstatementoranswersthequestion. Provideanappropriateresponse. 1) Thefrequencydistributionshowstheagesforasampleof100employees.Findtheexpectedfrequenciesfor eachclasstodetermineiftheemployeeagesarenormallydistributed. Classboundaries Frequency,f 29.5–39.5 14 39.5–49.5 29 49.5–59.5 31 59.5–69.5 18 69.5–79.5 8 2 PerformaChi–SquareGoodness–of–FitTest MULTIPLECHOICE.Choosetheonealternativethatbestcompletesthestatementoranswersthequestion. Provideanappropriateresponse. 2) Manytrackrunnersbelievethattheyhaveabetterchanceofwinningiftheystartintheinsidelanethatis closesttothefield.Forthedatabelow,thelaneclosesttothefieldisLane1,thenextlaneisLane2,andsoon untiltheoutermostlane,Lane6.Thedataliststhenumberofwinsfortrackrunnersinthedifferentstarting positions.Calculatethechi–squareteststatisticχ2totesttheclaimthatthenumberofwinsisuniformly distributedacrossthedifferentstartingpositions.Theresultsarebasedon240wins. StartingPosition 123456 NumberofWins 36 45 […]
Chapter 10 Homework Also Appears That Type Vehicle Has Effect
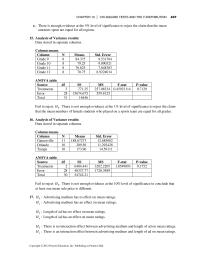
CHAPTER 10 │ CHI-SQUARE TESTS AND THE F -DISTRIBUTION 437 Copyright © 2012 Pearson Education, Inc. Publishing as Prentice Hall. e. There is enough evidence at the 5% level of significance to reject the claim that the mean amounts spent […]
Chapter 10 Homework The Claim The Proportions Motor Vehicle Crash
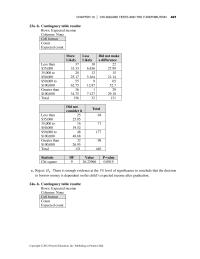
CHAPTER 10 │ CHI-SQUARE TESTS AND THE F -DISTRIBUTION 421 23a−b. Contingency table results: Rows: Expected income Columns: None Cell format Count Expected count More Likely Less Likely Did not make a difference Less than $35,000 37 33.33 10 6.836 […]
Chapter 10 Homework The distribution of ages differs from the claimed distribution
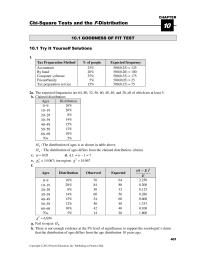
CHAPTER Chi-Square Tests and the F -Distribution 401 1 0 10.1 GOODNESS OF FIT TEST 10.1 Try It Yourself Solutions 1. Tax Preparation Method % of people Expected frequency Accountant By hand Computer software Friend/family Tax preparation service 20% 35% […]
Chapter 11 Homework A nonparametric test is a hypothesis test that does not require any
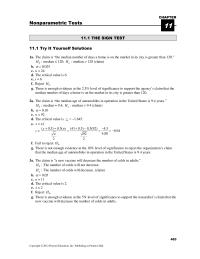
CHAPTER Nonparametric Tests Copyright © 2012 Pearson Education, Inc. Publishing as Prentice Hall. 11 11.1 THE SIGN TEST 11.1 Try It Yourself Solutions 1a. The claim is “the median number of days a home is on the market in its […]
Chapter 11 Homework Energy Drinks 200 Energy Drinks 206 Coffee
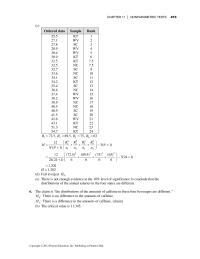
CHAPTER 11 │ NONPARAMETRIC TESTS 473 (c) Ordered data Sample Rank 25.5 KT 1 27.1 WV 2 27.8 SC 3 28.9 WV 4 30.4 WV 5 30.9 KT 6 32.5 KT 7.5 32.5 NC 7.5 32.7 SC 9 33.6 NC […]
Chapter 11 Homework Ha There Reduction Diastolic Blood Pressure B
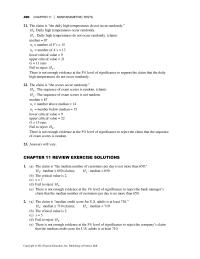
490 CHAPTER 11 │ NONPARAMETRIC TESTS Copyright © 2012 Pearson Education, Inc. Publishing as Prentice Hall. 21. The claim is “the daily high temperatures do not occur randomly.” 0:HDaily high temperatures occur randomly. : a H Daily high temperatures do […]
Chapter 11Us 665 Random Sample 100 Workers Were
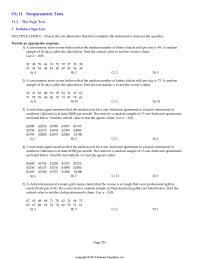
Ch.11 NonparametricTests 11.1 TheSignTest 1 PerformaSignTest MULTIPLECHOICE.Choosetheonealternativethatbestcompletesthestatementoranswersthequestion. Provideanappropriateresponse. 1) Aconveniencestoreownerbelievesthatthemediannumberoflotteryticketssoldperdayis49.Arandom sampleof20daysyieldsthedatabelow.Findthecriticalvaluetotesttheownerʹsclaim. Useα=0.05. 32 48 59 64 31 55 70 27 33 38 47 54 54 44 44 49 49 59 54 38 A) 4 B) 2 C) 3 D) 5 […]
Chapter 15 Homework Activity 54 The Mean The Sampling Distribution
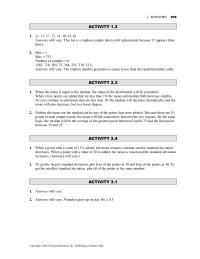
│ ACTIVITIES 509 ACTIVITY 1.3 1. {1, 17, 17, 17, 14, 10, 15, 6} Answers will vary. This list is a random sample taken with replacement because 17 appears three times. 2. Min = 1 Max = 731 Number of […]
Chapter 16 Homework The NBA Had The Greatest Earnings Per
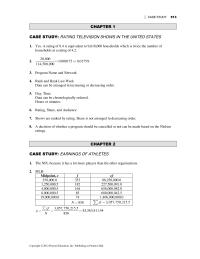
│ CASE STUDY 513 CHAPTER 1 CASE STUDY: RATING TELEVISION SHOWS IN THE UNITED STATES 1. Yes. A rating of 8.4 is equivalent to 9,618,000 households which is twice the number of households at a rating of 4.2. 2. 20,000 […]
Chapter 17 Homework Once The Temperature Passes That Point The
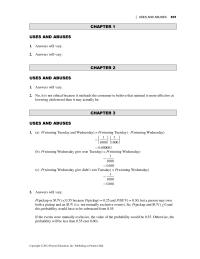
│ USES AND ABUSES 531 CHAPTER 1 USES AND ABUSES 1. Answers will vary. 2. Answers will vary. CHAPTER 2 USES AND ABUSES 1. Answers will vary. 2. No, it is not ethical because it misleads the consumer to believe […]
Chapter 18 Homework Real Statistics real Decisions A Answers Will
│ REAL STATISTICS–REAL DECISIONS 535 CHAPTER 1 REAL STATISTICS–REAL DECISIONS 1. (a) Answers will vary. (b) Yes (c) Use surveys (d) You may take too large a percentage of your sample from a subgroup of the population that is relatively […]
Chapter 2 Homework because the mean is to the left of the median in a skewed
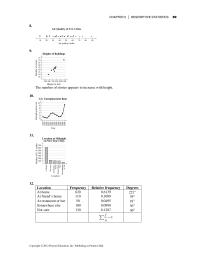
CHAPTER 2 │ DESCRIPTIVE STATISTICS 89 8. 9. The number of stories appears to increase with height. 10. 11. 12. Location Frequency Relative frequency Degrees At home 620 0.6139 221° At friend’s home 110 0.1089 39° At restaurant or bar […]
Chapter 2 Homework None The Z scores Are Unusual
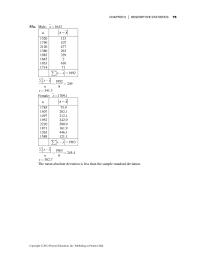
CHAPTER 2 │ DESCRIPTIVE STATISTICS 75 Copyright © 2012 Pearson Education, Inc. Publishing as Prentice Hall. 55a. Male: 1643x= x x x− 1520 123 1750 107 2120 477 1380 263 1982 339 1645 2 1033 610 1714 71 1992xx−= ∑ […]
Chapter 2 Homework Organizing the data into a frequency distribution may make
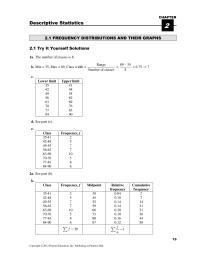
CHAPTER Descriptive Statistics 15 2 2.1 FREQUENCY DISTRIBUTIONS AND THEIR GRAPHS 2.1 Try It Yourself Solutions 1a. The number of classes is 8. b. Min = 35, Max = 89, Class width = Range Number of classes = 89 35 […]
Chapter 2 Homework The Mean And Median Cannot Found Because
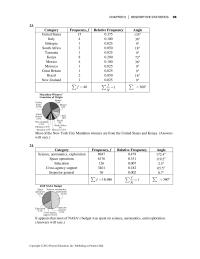
CHAPTER 2 │ DESCRIPTIVE STATISTICS 35 Copyright © 2012 Pearson Education, Inc. Publishing as Prentice Hall. 23. Category Frequency, f Relative Frequency Angle United States 15 0.375 135° Italy 4 0.100 36° Ethiopia 1 0.025 9° South Africa 2 0.050 […]
Chapter 2 Homework The standard deviation is the positive square root of the variance
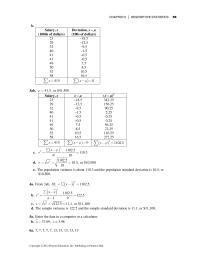
CHAPTER 2 │ DESCRIPTIVE STATISTICS 55 b. Salary, x (1000s of dollars) Deviation, x – µ (100s of dollars) 23 –18.5 29 –12.5 32 –9.5 40 –1.5 41 –0.5 41 –0.5 49 7.5 50 8.5 52 10.5 58 16.5 415x= […]
Chapter 20 Homework Answers Will Vary Technology Simulation Composing
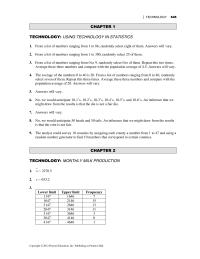
│ TECHNOLOGY 545 CHAPTER 1 TECHNOLOGY: USING TECHNOLOGY IN STATISTICS 1. From a list of numbers ranging from 1 to 86, randomly select eight of them. Answers will vary. 2. From a list of numbers ranging from 1 to 300, […]
Chapter 3 Homework Mutually Exclusive Person Who Wears Only Contacts
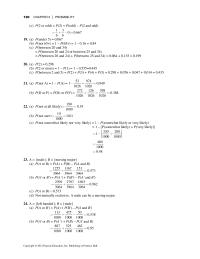
120 CHAPTER 3 │ PROBABILITY (c) P(2 or odd) = P(2) + P(odd) – P(2 and odd) 13 0 0.667 66 =+−≈ 19. (a) P(under 5) = 0.067 (b) P(not 65+) = 1 – P(65+) = 1 – 0.16 = […]
Chapter 3 Homework Yes The Probability Event Occurring Must Contained
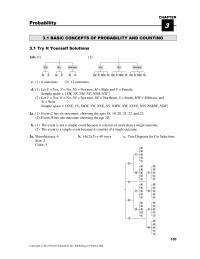
CHAPTER Probability 103 3 3.1 BASIC CONCEPTS OF PROBABILITY AND COUNTING 3.1 Try It Yourself Solutions 1ab. (1) (2) c. (1) 6 outcomes (2) 12 outcomes d. (1) Let Y = Yes, N = No, NS = Not sure, M […]
Chapter 4 Homework The random variable is continuous because X can be any
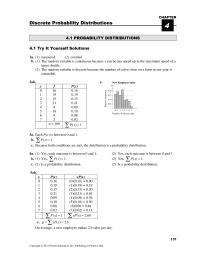
CHAPTER Discrete Probability Distributions 137 4 4.1 PROBABILITY DISTRIBUTIONS 4.1 Try It Yourself Solutions 1a. (1) measured (2) counted b. (1) The random variable is continuous because x can be any speed up to the maximum speed of a space […]
Chapter 4 Homework The Values And Would Unusual Because Their
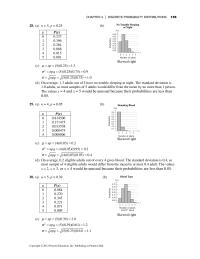
CHAPTER 4 │ DISCRETE PROBABILITY DISTRIBUTIONS 155 28. (a) n = 5, p = 0.25 (b) x P(x) 0 0.237 1 0.396 2 0.264 3 0.088 4 0.015 5 0.001 Skewed right (c) (5)(0.25) 1.3np µ == ≈ 2(5)(0.25)(0.75) 0.9npq […]
Chapter 5 Homework Can use normal distribution unusual because its probability
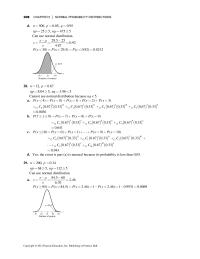
208 CHAPTER 5 │ NORMAL PROBABILITY DISTRIBUTIONS d. 500, 0.05, 0.95 25 5, 475 5 np q np nq == = =≥ = ≥ Can use normal distribution. 29.5 25 0.92 4.87 x zµ σ −− =≈ ≈ ( 30) […]
Chapter 5 Homework The two curves will have the same shape because they
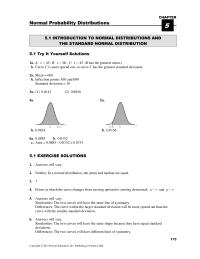
CHAPTER Normal Probability Distributions 173 5 5.1 INTRODUCTION TO NORMAL DISTRIBUTIONS AND THE STANDARD NORMAL DISTRIBUTION 5.1 Try It Yourself Solutions 1a. A: 45x=, B: 60x=, C: 45x= (B has the greatest mean.) b. Curve C is more spread out, […]
Chapter 5 Homework while the mean of the sample means remains the same
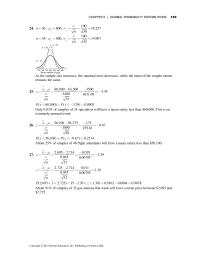
CHAPTER 5 │ NORMAL PROBABILITY DISTRIBUTIONS 193 24. 100 30 : 800, 18.257 30 xx n n σ µσ== ==≈ 100 45 : 800, 14.907 45 xx n n σ µσ== ==≈ As the sample size increases, the standard error […]
Chapter 6 Homework proportion of successes for population method
240 CHAPTER 6 │ CONFIDENCE INTERVALS With 90% confidence, you can say that the population proportion of U.S. females ages 18-64 who say they have gone to the dentist in the past year is between 62.6% and 70.2%. With 95% […]
Chapter 6 Homework You are more likely to be correct using an interval estimate
CHAPTER Confidence Intervals 223 6 6.1 CONFIDENCE INTERVALS FOR THE MEAN (LARGE SAMPLES) 6.1 Try It Yourself Solutions 1a. 4155 138.5 30 x xn == = ∑ b. A point estimate for the population mean number of friends is 138.5. […]
Chapter 7 Homework Hypothesis Test Results Population Mean 2118 Ha
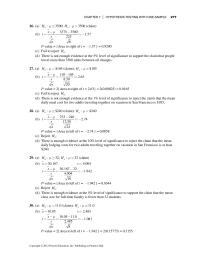
CHAPTER 7 │ HYPOTHESIS TESTING WITH ONE SAMPLE 277 26. (a) 0: 3500; : 3500 (claim) a HHµµ≤> (b) 3375 3500 1.57 225 8 x ts n µ−− == ≈− P-value = {Area to right of t = 1.57−} = […]
Chapter 7 Homework Prentice Hall Hypothesis Testing With One
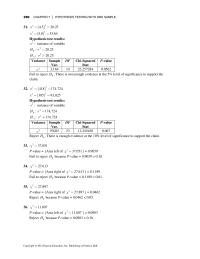
290 CHAPTER 7 │ HYPOTHESIS TESTING WITH ONE SAMPLE 31. () 2 24.5 20.25σ== () 2 25.8 33.64s== Hypothesis test results: 2 2 0 2 : variance of variable : 20.25 : 20.25 A H H σ σ σ = […]
Chapter 7 Homework There us enough evidence to support the realtor’s claim that
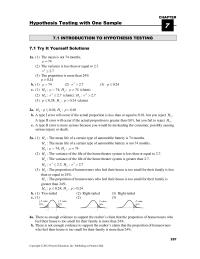
CHAPTER Hypothesis Testing with One Sample Copyright © 2012 Pearson Education, Inc. Publishing as Prentice Hall. 7 7.1 INTRODUCTION TO HYPOTHESIS TESTING 7.1 Try It Yourself Solutions 1a. (1) The mean is not 74 months. 74µ≠ (2) The variance is […]
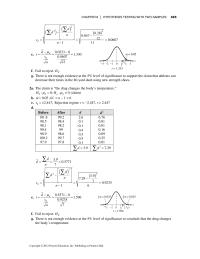
Chapter 8 Homework The claim is “the drug changes the body’s temperature
CHAPTER 8 │ HYPOTHESIS TESTING WITH TWO SAMPLES 323 () () () 2 22 0.28 0.047 12 0.0607 111 d d dn sn ⎡⎤ ⎢⎥ −⎢⎥ − ⎢⎥ ⎣⎦ ==≈ − ∑ ∑ e. 0.0233 0 1.330 0.0607 12 d […]
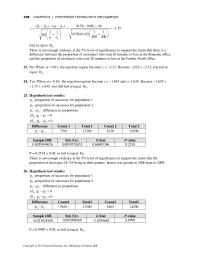
Chapter 8 Homework There is not enough evidence at the 5% level of significance
338 CHAPTER 8 │ HYPOTHESIS TESTING WITH TWO SAMPLES 12 12 12 ˆˆ ()() (0.56 0.60) (0) 1.15 11 11 (0.58)(0.42) 400 400 pp pp z pq nn −−− −− == ≈− ⎛⎞ ⎛ ⎞ + +⎜⎟ ⎜⎟ ⎝⎠ ⎝⎠ […]
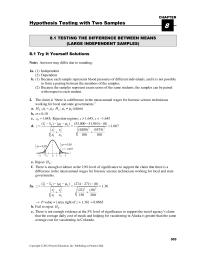
Chapter 8 Homework Try It Yourself Solutions Note: Answers may differ due to
CHAPTER Hypothesis Testing with Two Samples 303 8 8.1 TESTING THE DIFFERENCE BETWEEN MEANS (LARGE INDEPENDENT SAMPLES) 8.1 Try It Yourself Solutions Note: Answers may differ due to rounding. 1a. (1) Independent (2) Dependent b. (1) Because each sample represents […]
Chapter 9 Homework it is not meaningful to predict a salary for a registered
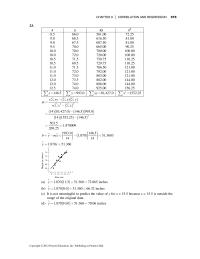
CHAPTER 9 │ CORRELATION AND REGRESSION 373 23. x y xy x2 8.5 66.0 561.00 72.25 9.0 68.5 616.50 81.00 9.0 67.5 607.50 81.00 9.5 70.0 665.00 90.25 10.0 70.0 700.00 100.00 10.0 72.0 720.00 100.00 10.5 71.5 750.75 110.25 […]
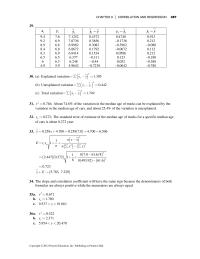
Chapter 9 Homework The standard error of estimate of the median age of trucks
CHAPTER 9 │ CORRELATION AND REGRESSION 387 29. i x i y i y i yy− ii yy− i yy− 9.4 7.6 7.1252 0.4372 0.4748 0.912 9.2 6.9 7.0736 0.3856 –0.1736 0.212 8.9 6.6 6.9962 0.3082 –0.3962 […]
Chapter 9 Homework There is enough evidence at the 1% level of significance
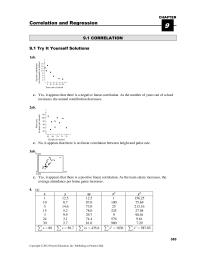
CHAPTER Correlation and Regression Copyright © 2012 Pearson Education, Inc. Publishing as Prentice Hall. 9 9.1 CORRELATION 9.1 Try It Yourself Solutions 1ab. c. Yes, it appears that there is a negative linear correlation. As the number of years out […]