CHAPTER 2 │ DESCRIPTIVE STATISTICS 35
23.
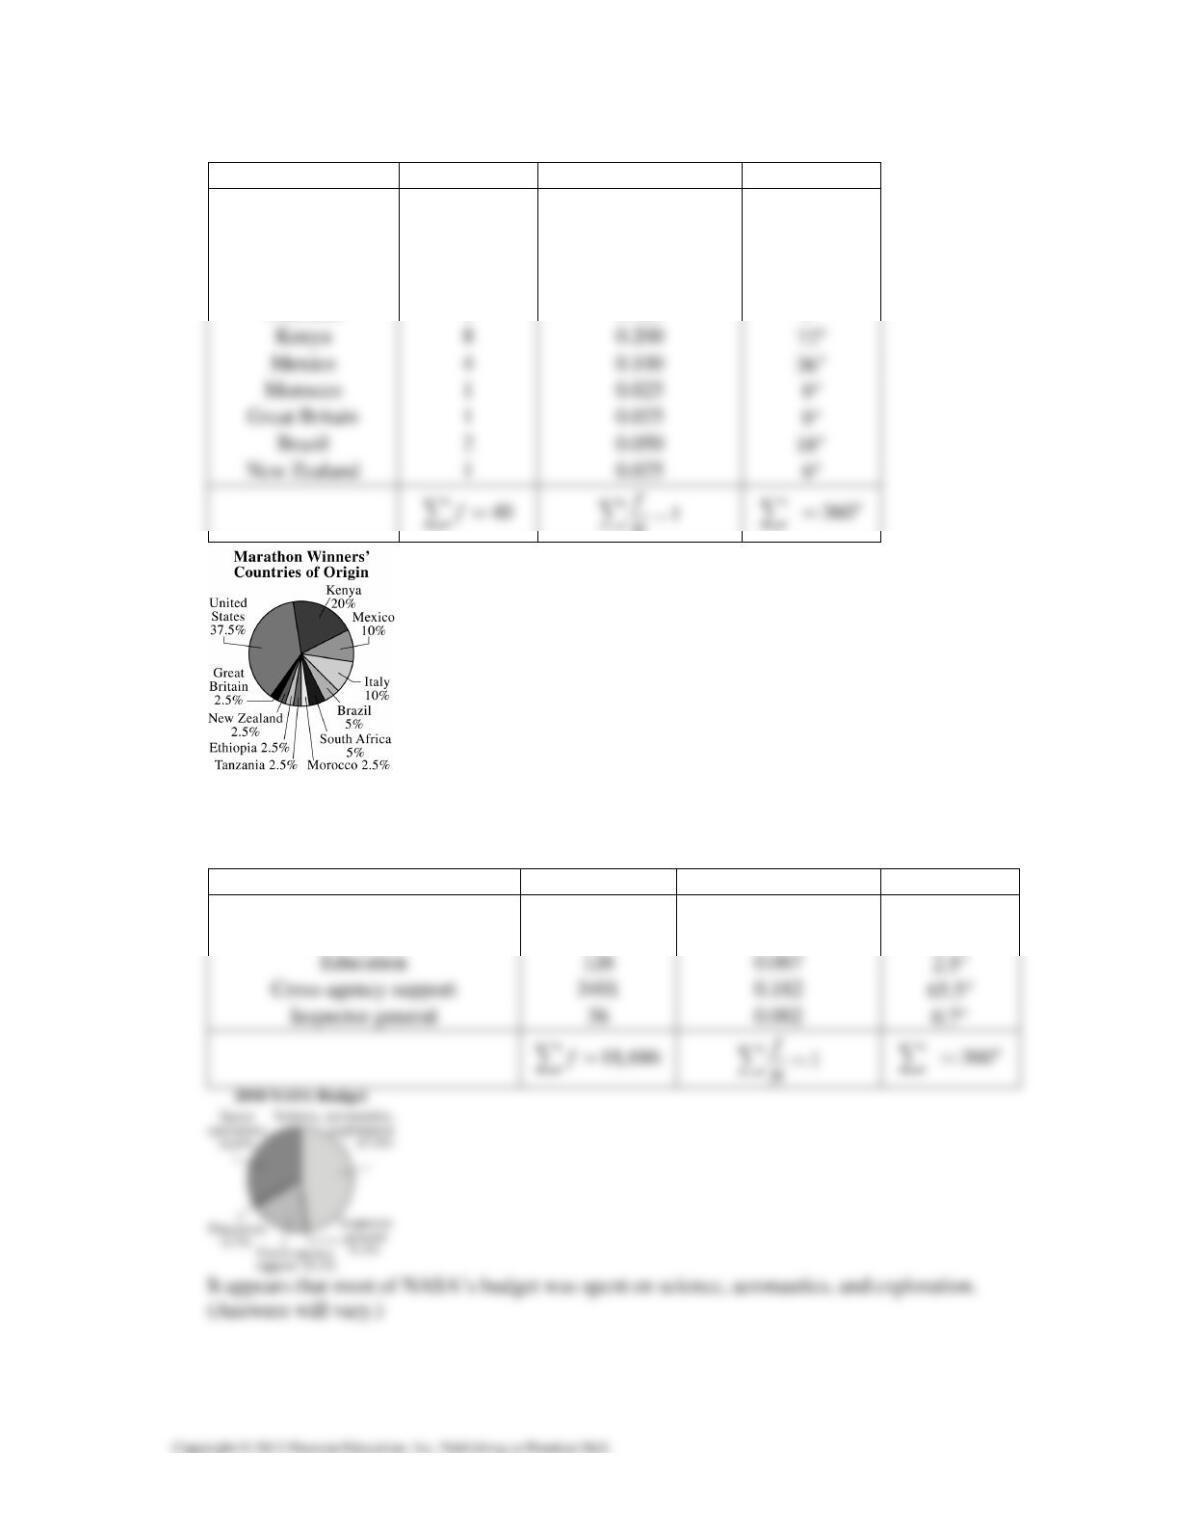
Category Frequency, f Relative Frequency Angle
United States 15 0.375 135°
Italy 4 0.100
36°
Ethiopia 1 0.025 9°
South Africa 2 0.050 18°
Tanzania 1 0.025 9°
N=
Most of the New York City Marathon winners are from the United States and Kenya. (Answers
will vary.)
24.
Category Frequency, f Relative Frequency Angle
Science, aeronautics, exploration 8947 0.479 172.4°
Space operations 6176 0.331 119.2°
36 CHAPTER 2 │ DESCRIPTIVE STATISTICS
25.
26.
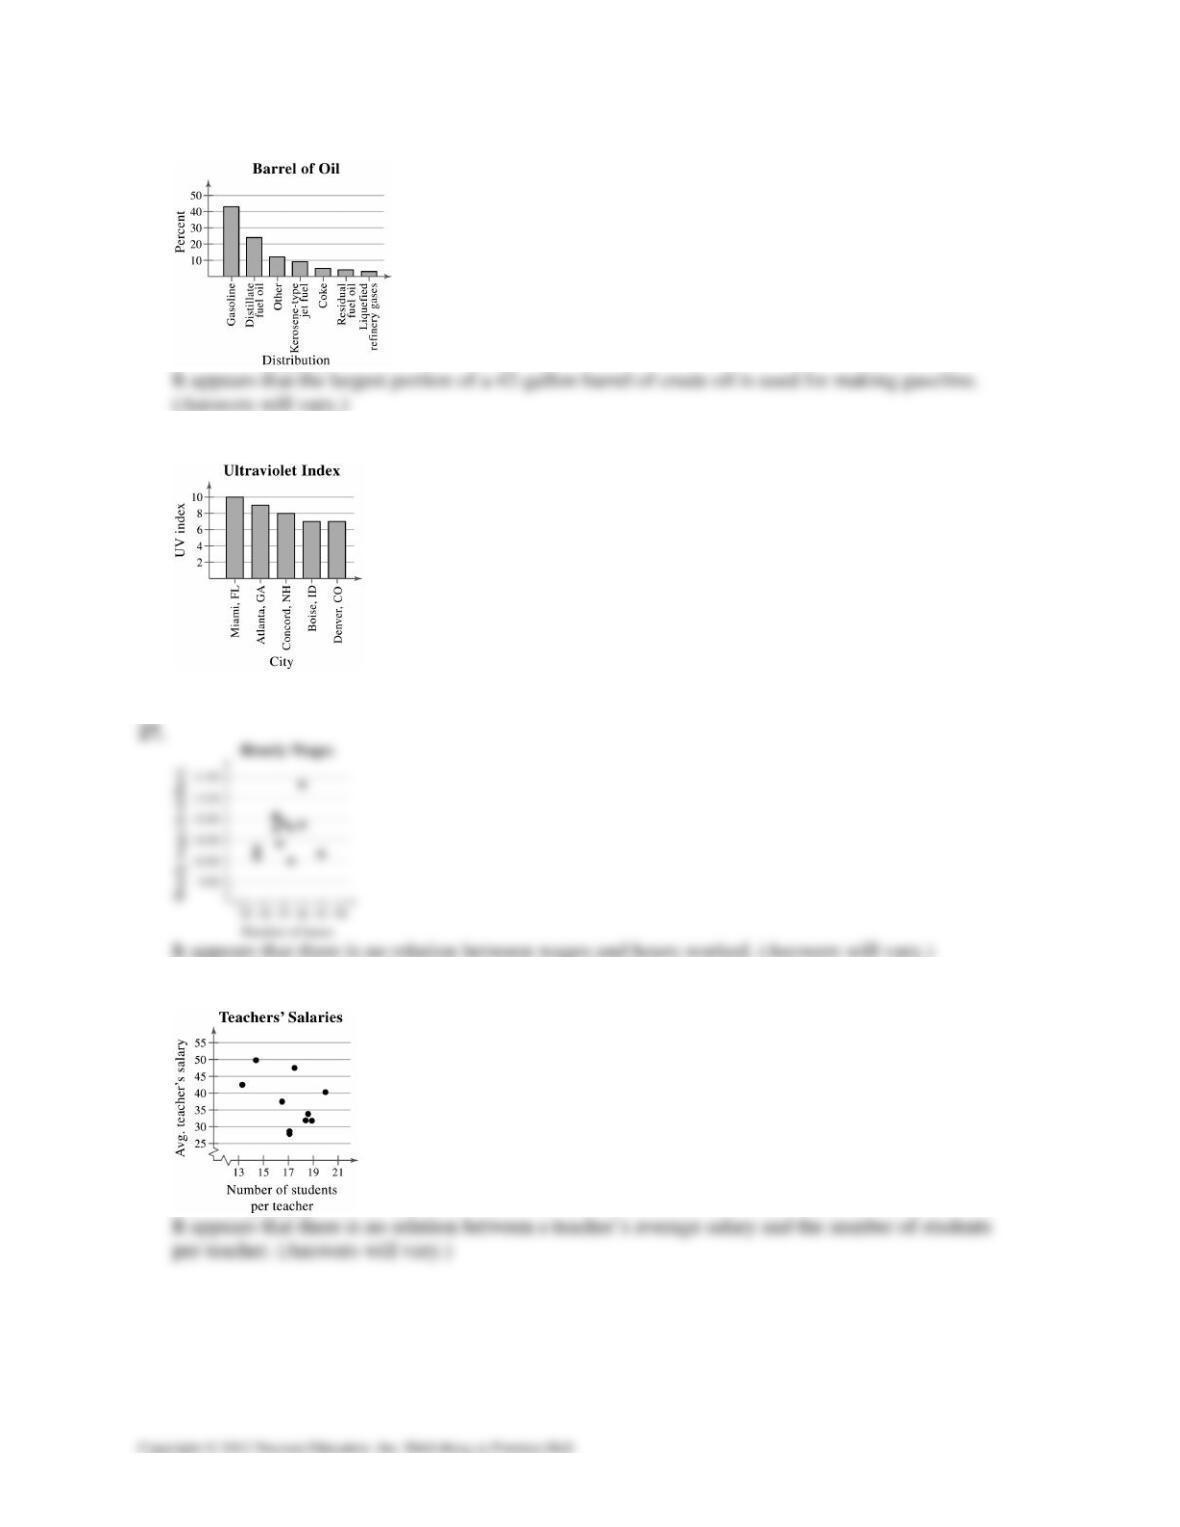
It appears that Boise, ID and Denver, CO have the same UV index. (Answers will vary.)
28.
CHAPTER 2 │ DESCRIPTIVE STATISTICS 37
29.
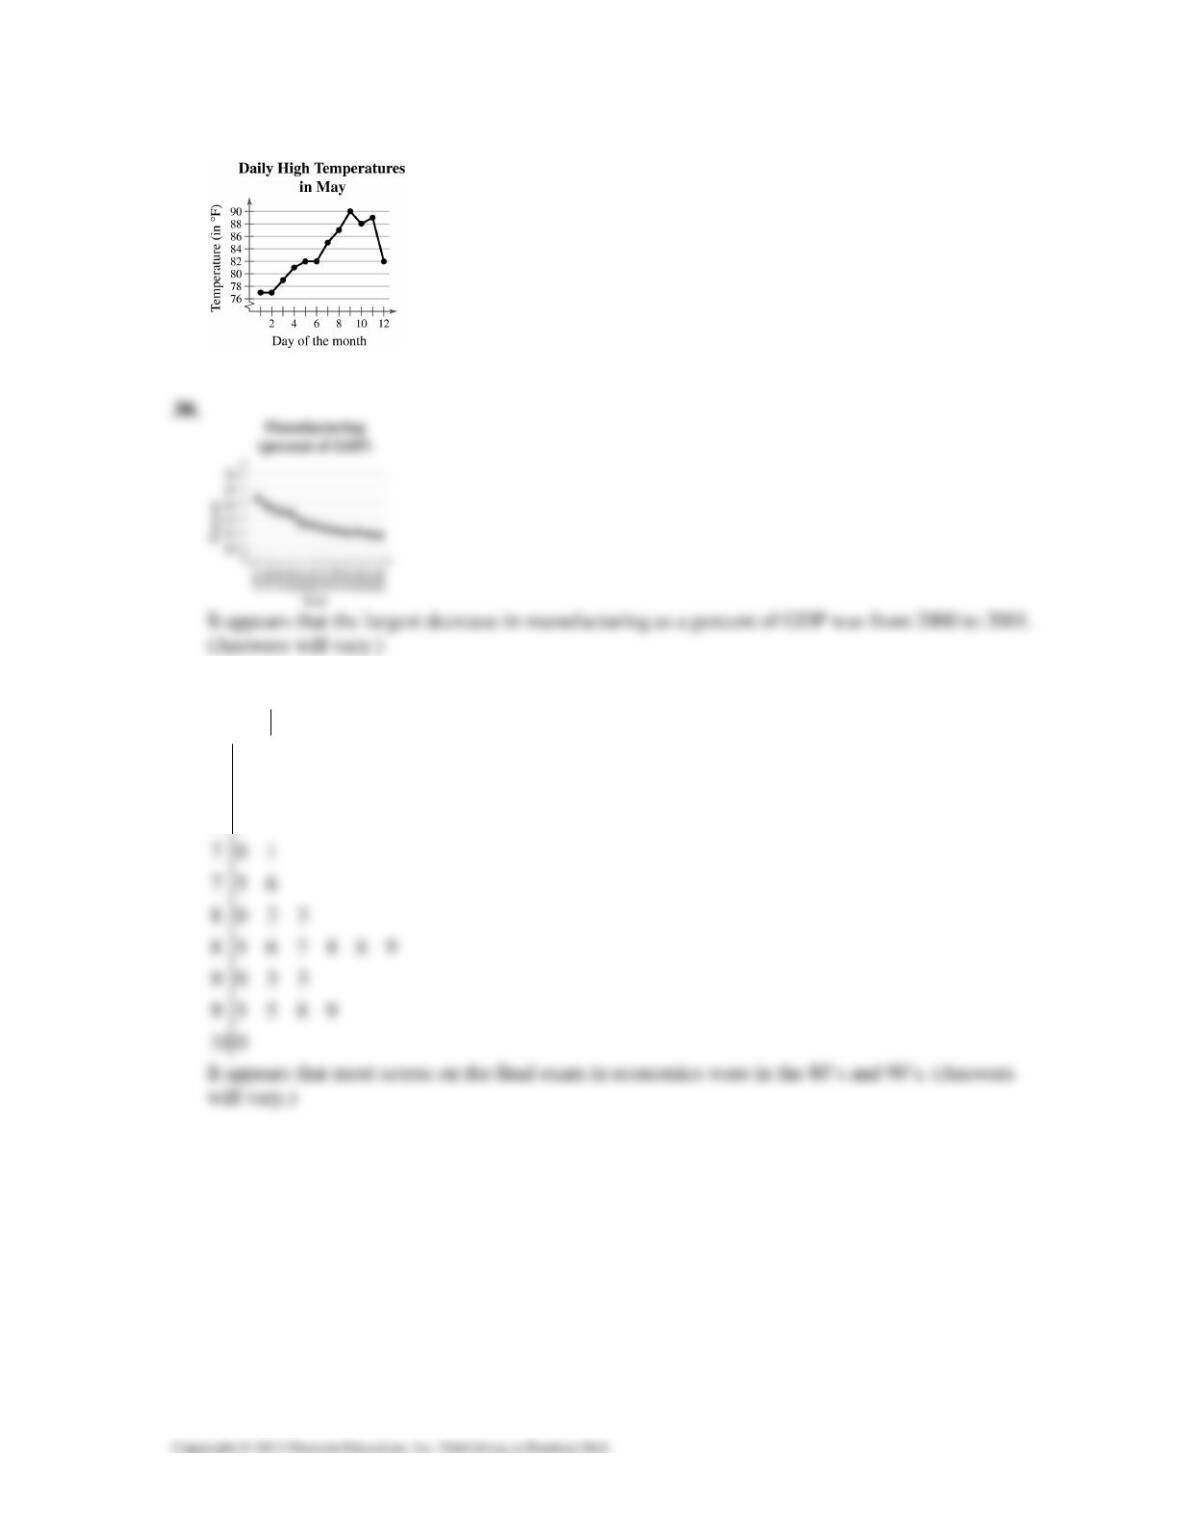
It appears that it was hottest from May 7 to May 11. (Answers will vary.)
31. Variable: Scores
Key: 55 5.5=
55
62
68
38 CHAPTER 2 │ DESCRIPTIVE STATISTICS
32.
33a.
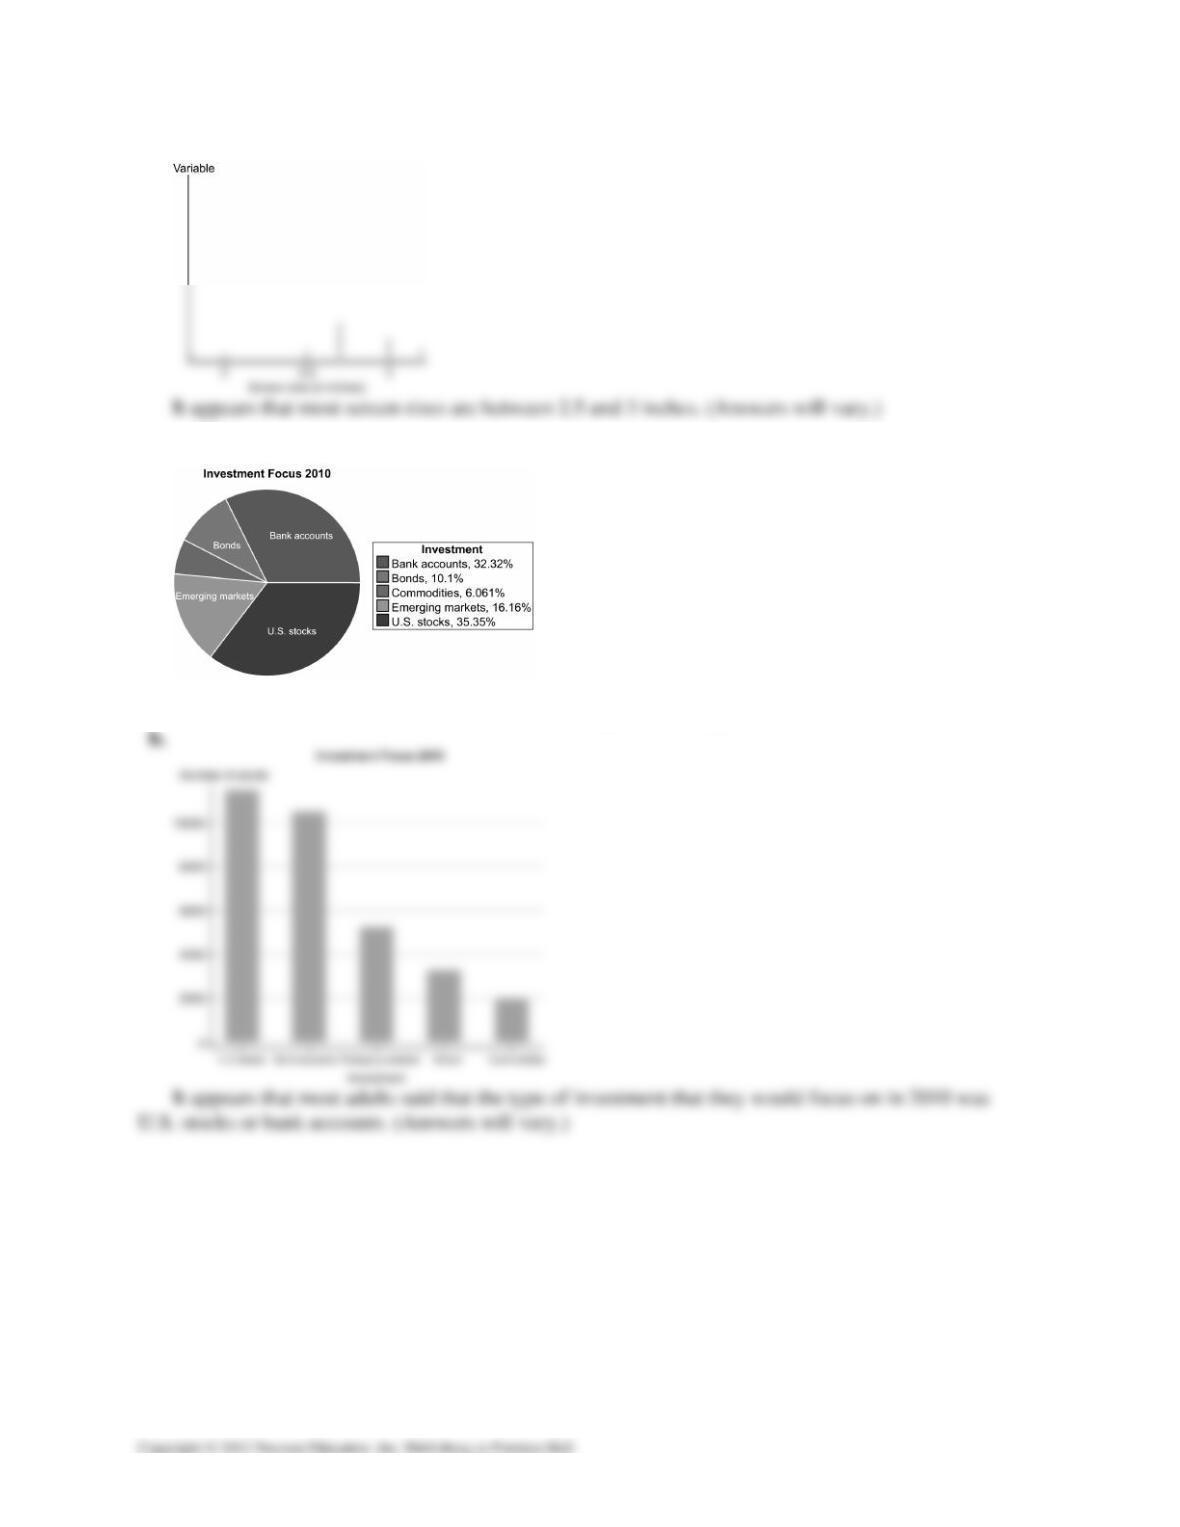
It appears that a large portion of adults said that the type of the investment that they would focus
on in 2010 was U.S. stocks or bank accounts. (Answers will vary.)
CHAPTER 2 │ DESCRIPTIVE STATISTICS 39
34a.
b.
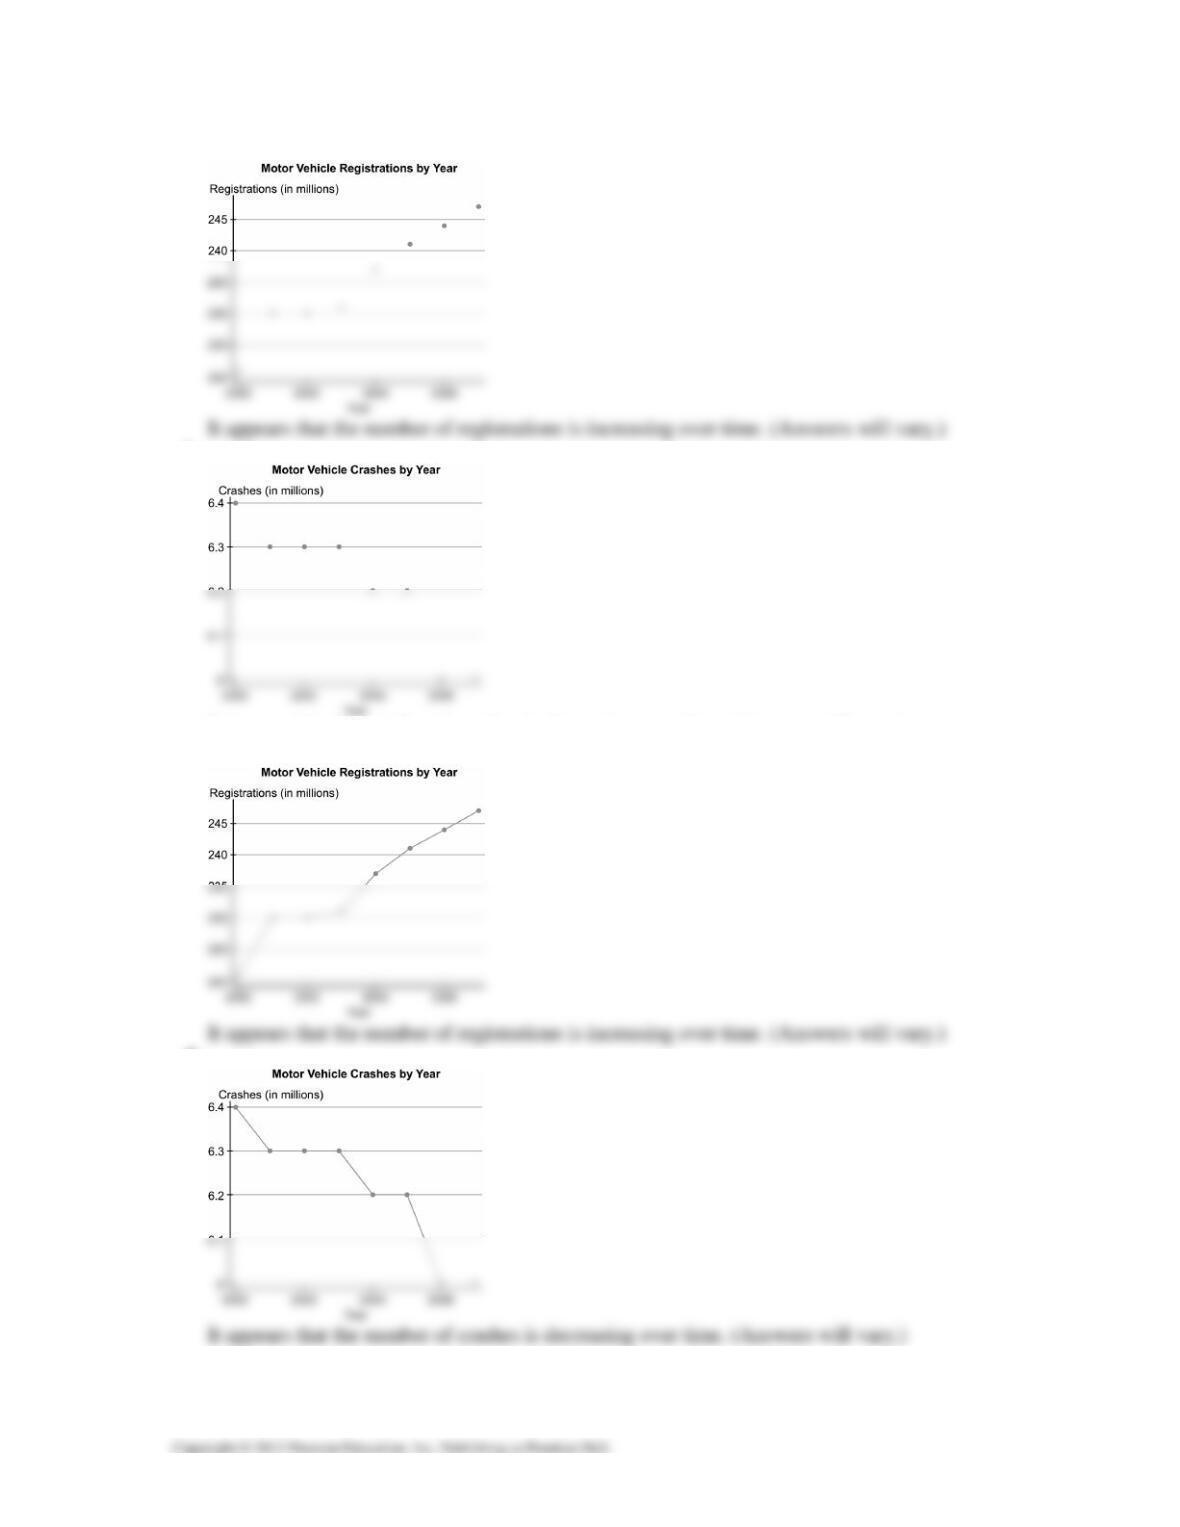
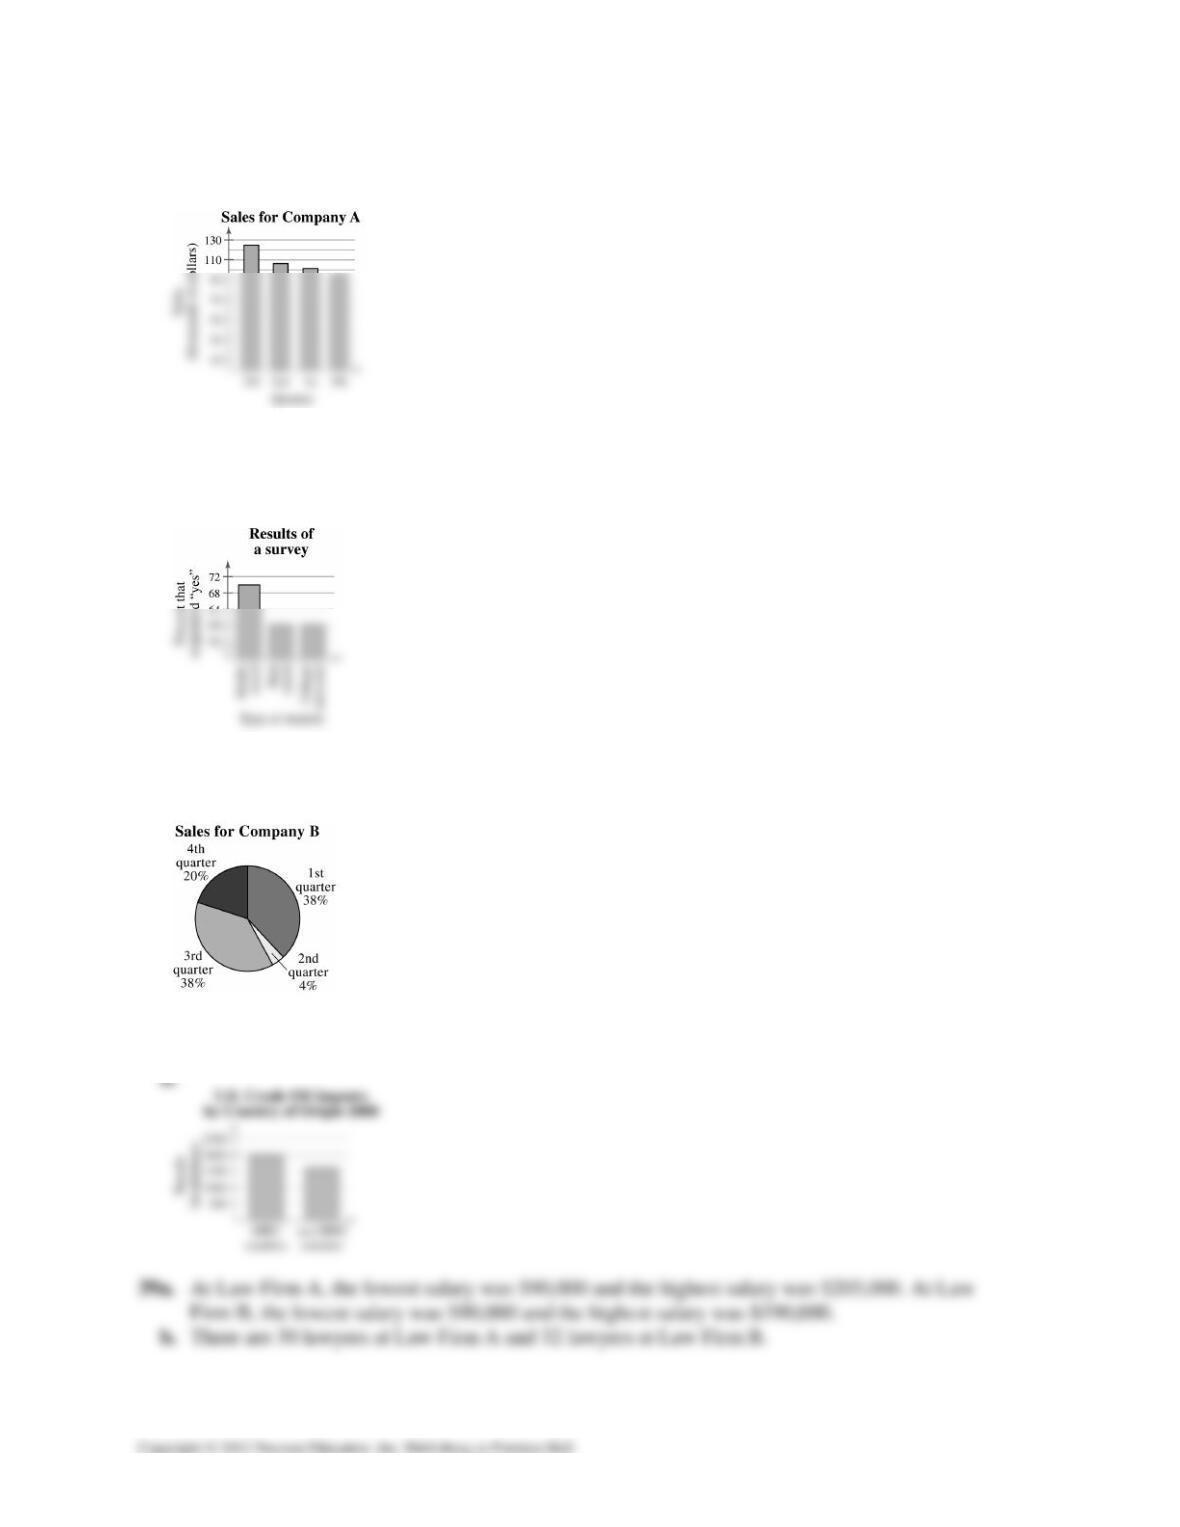
It appears that the number of crashes is decreasing over time. (Answers will vary.)
c.
d.
40 CHAPTER 2 │ DESCRIPTIVE STATISTICS
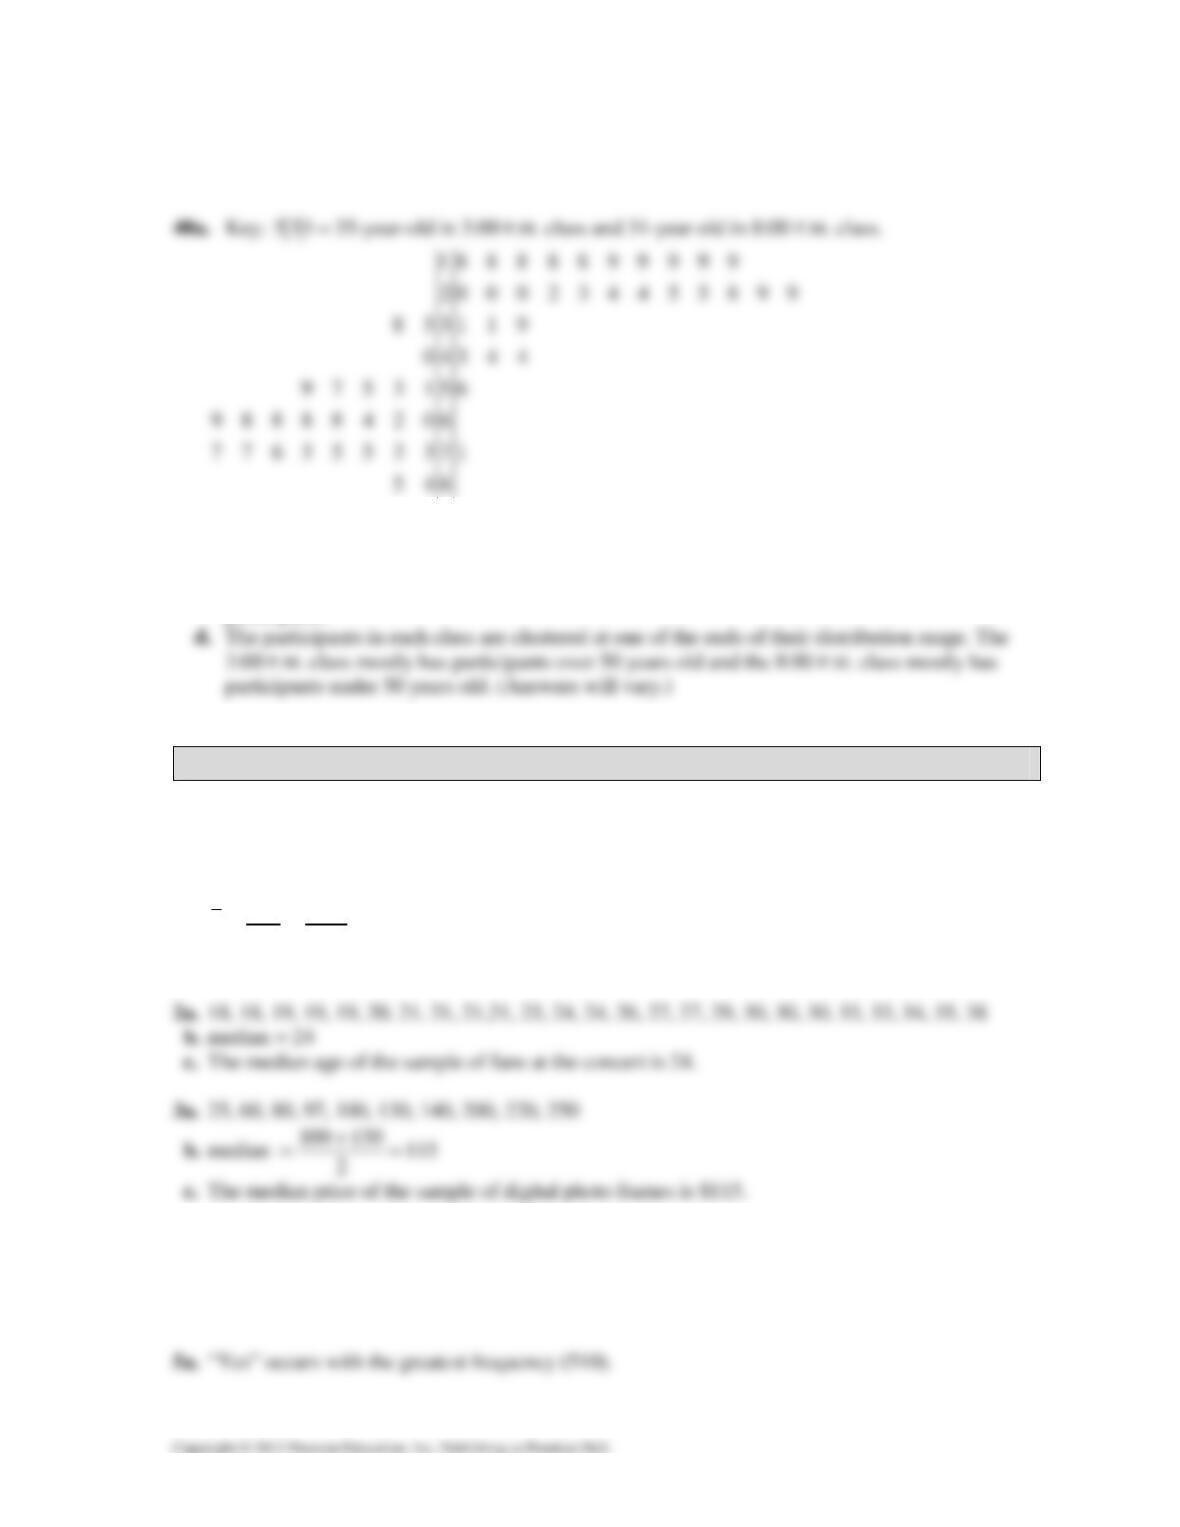
35a. The graph is misleading because the large gap from 0 to 90 makes it appear that the sales for the
3rd quarter are disproportionately larger than the other quarters. (Answers will vary.)
b.
36a. The graph is misleading because the vertical axis has no break. The percent of middle schoolers
that responded “yes” appears three times larger than either of the others when the difference is
only 10%. (Answers will vary.)
b.
37a. The graph is misleading because the angle makes it appear as though the 3rd quarter had a
larger percent of sales than the others, when the 1st and 3rd quarters have the same percent.
b.
38a. The graph is misleading because the “OPEC countries” bar is wider than the “non-OPEC
countries” bar.
CHAPTER 2 │ DESCRIPTIVE STATISTICS 41
c. At Law Firm A, the salaries tend to be clustered at the far ends of the distribution range and at
Law Firm B, the salaries tend to fall in the middle of the distribution range.
b. In the 3:00 P.M. class, the youngest participant is 35 years old and the oldest participant is 85
years old. In the 8:00 P.M. class, the youngest participant is 18 years old and the oldest
participant is 71 years old.
c. In the 3:00 P.M. class, there are 26 participants and in the 8:00 P.M. class there are 30
participants.
2.3 MEASURES OF CENTRAL TENDENCY
2.3 Try It Yourself Solutions
1a. 74 78 81 87 81 80 77 80 85 78 80 83 75 81 73 1193x∑=++++++++++++++=
b. 1193 79.5
15
x
xn
∑
== ≈
c. The mean height of the player is about 79.5 inches.
4a. 324, 385, 450, 450, 462, 475, 540, 540, 564, 618, 624, 638, 670, 670, 670, 705, 720, 723, 750,
750, 825, 830, 912, 975, 980, 980, 1100, 1260, 1420, 1650
b. The price that occurs with the greatest frequency is $670 per square foot.
c. The mode of the prices for the sample of South Beach, FL condominiums is $670 per square foot.
42 CHAPTER 2 │ DESCRIPTIVE STATISTICS
b. The mode of the responses to the survey is “Yes.” In this sample, there were more people who
thought public cell phone conversations were rude than people who did not or had no opinion.
7a, b.
Source Score, x Weight, w x · w
Test mean 86 0.50 43.0
Midterm 96 0.15 14.4
8a, b, c.
Class Midpoint, x Frequency, f x · f
35-41 38 2 76
42-48 45 5 225
49-55 52 7 364
56-62 59 7 413
2.3 EXERCISE SOLUTIONS
1. True
2. False. All quantitative data sets have a median.
CHAPTER 2 │ DESCRIPTIVE STATISTICS 43
5. 1, 2, 2, 2, 3 (Answers will vary.)
6. 2, 4, 5, 5, 6, 8 (Answers will vary.)
10. Symmetric because the left and right halves of the distribution are approximately mirror images.
11. Uniform because the bars are approximately the same height.
12. Skewed left because the “tail” of the distribution extends to the left.
13. (11), because the distribution values range from 1 to 12 and has (approximately) equal
frequencies.
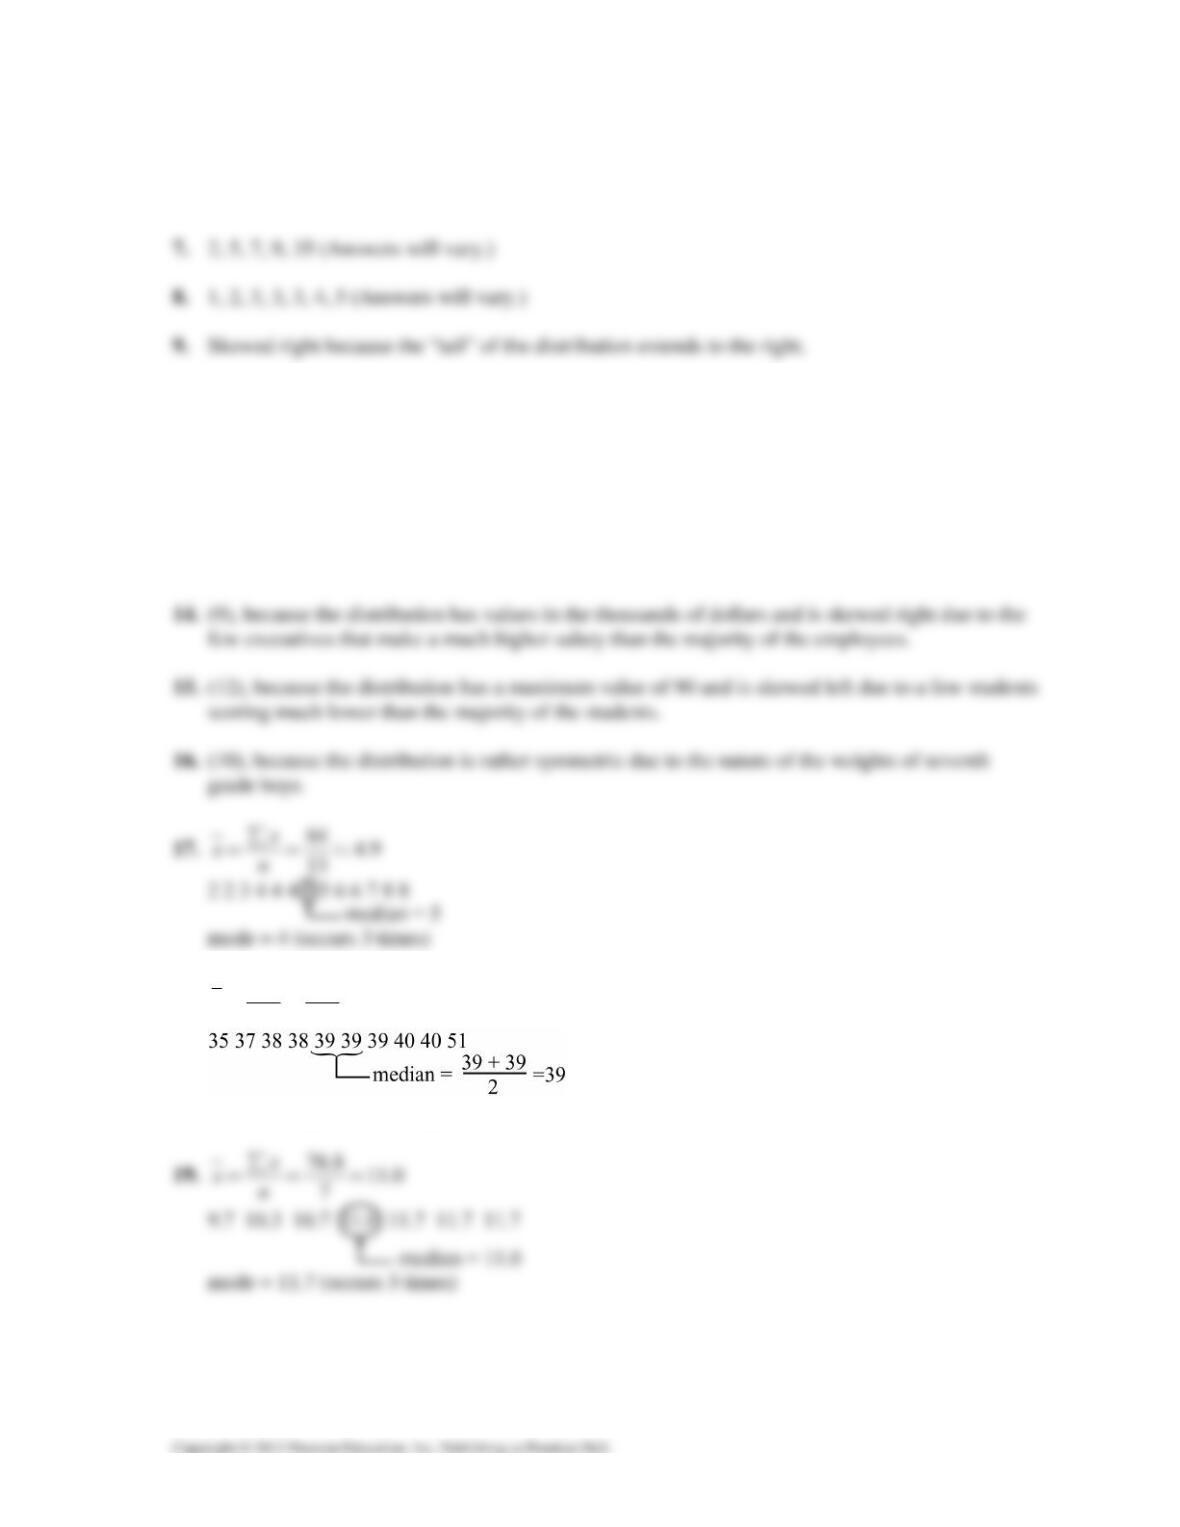
18. 396 39.6
10
x
xn
∑
===
mode = 39 (occurs 3 times)
44 CHAPTER 2 │ DESCRIPTIVE STATISTICS
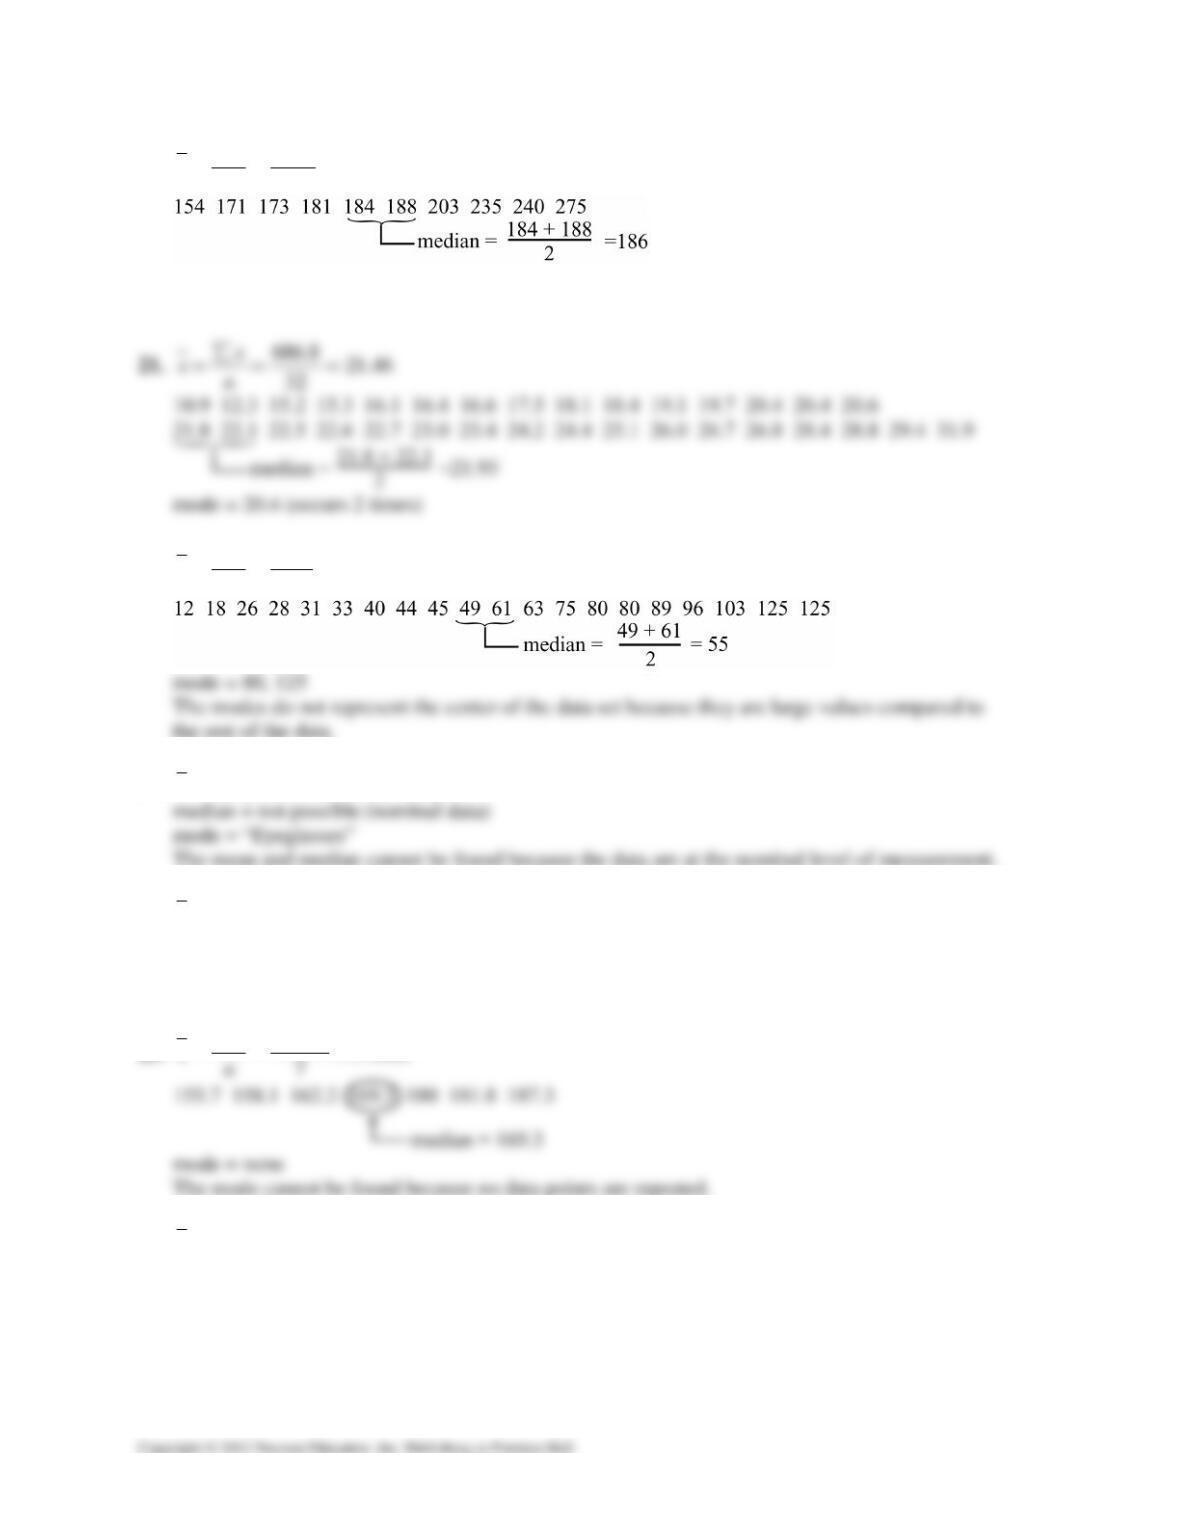
20. 2004 200.4
10
x
xn
∑
== =
mode = none
The mode cannot be found because no data points are repeated.
22. 1223 61.2
20
x
xn
∑
== =
23. x=not possible (nominal data)
24. x=not possible (nominal data)
median = not possible (nominal data)
mode = “Money needed”
The mean and median cannot be found because the data are at the nominal level of measurement.
25. 1194.4 170.63
x
xn
∑
== ≈
26. x=not possible (nominal data)
median = not possible (nominal data)
mode = “Mashed”
The mean and median cannot be found because the data are at the nominal level of measurement.
CHAPTER 2 │ DESCRIPTIVE STATISTICS 45
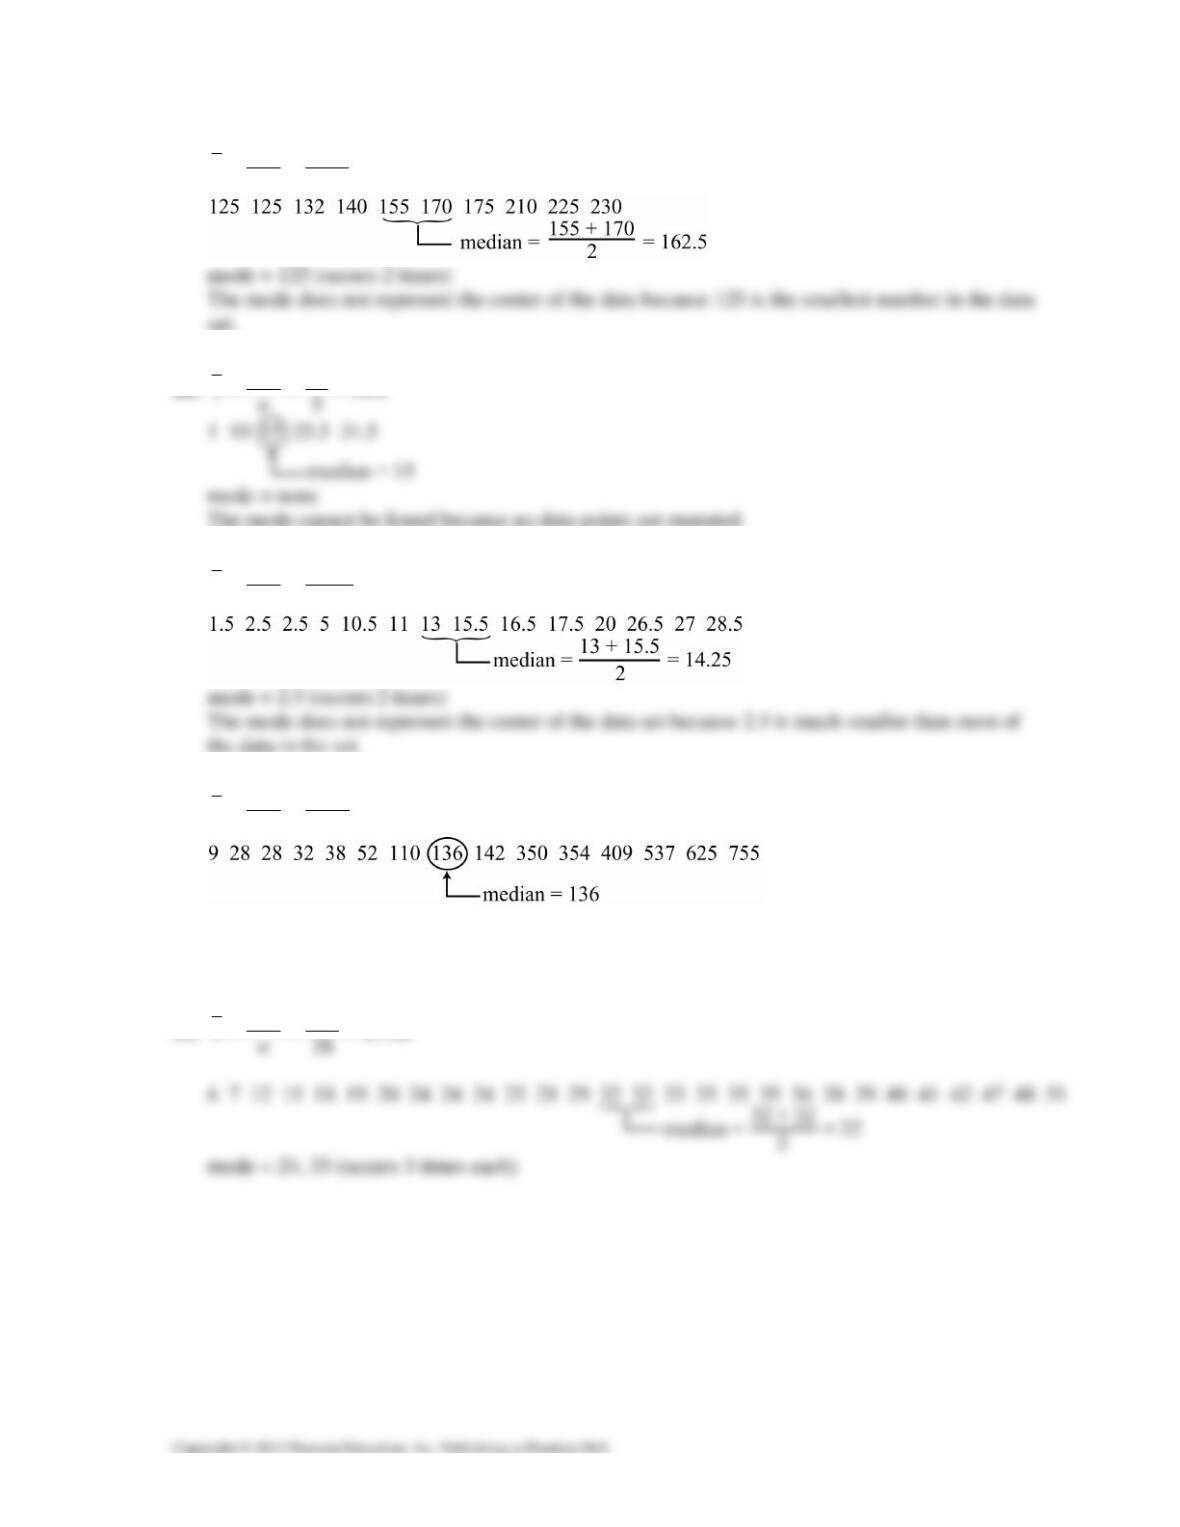
27. 1687 168.7
10
x
xn
∑
== =
28. 83 16.6
x
xn
∑
===
29. 197.5 14.11
14
x
xn
∑
== ≈
30. 3605 240.3
15
x
xn
∑
== ≈
mode = 28 (occurs 2 times)
The mode does not represent the center of the data because it is the second smallest number in the
data set.
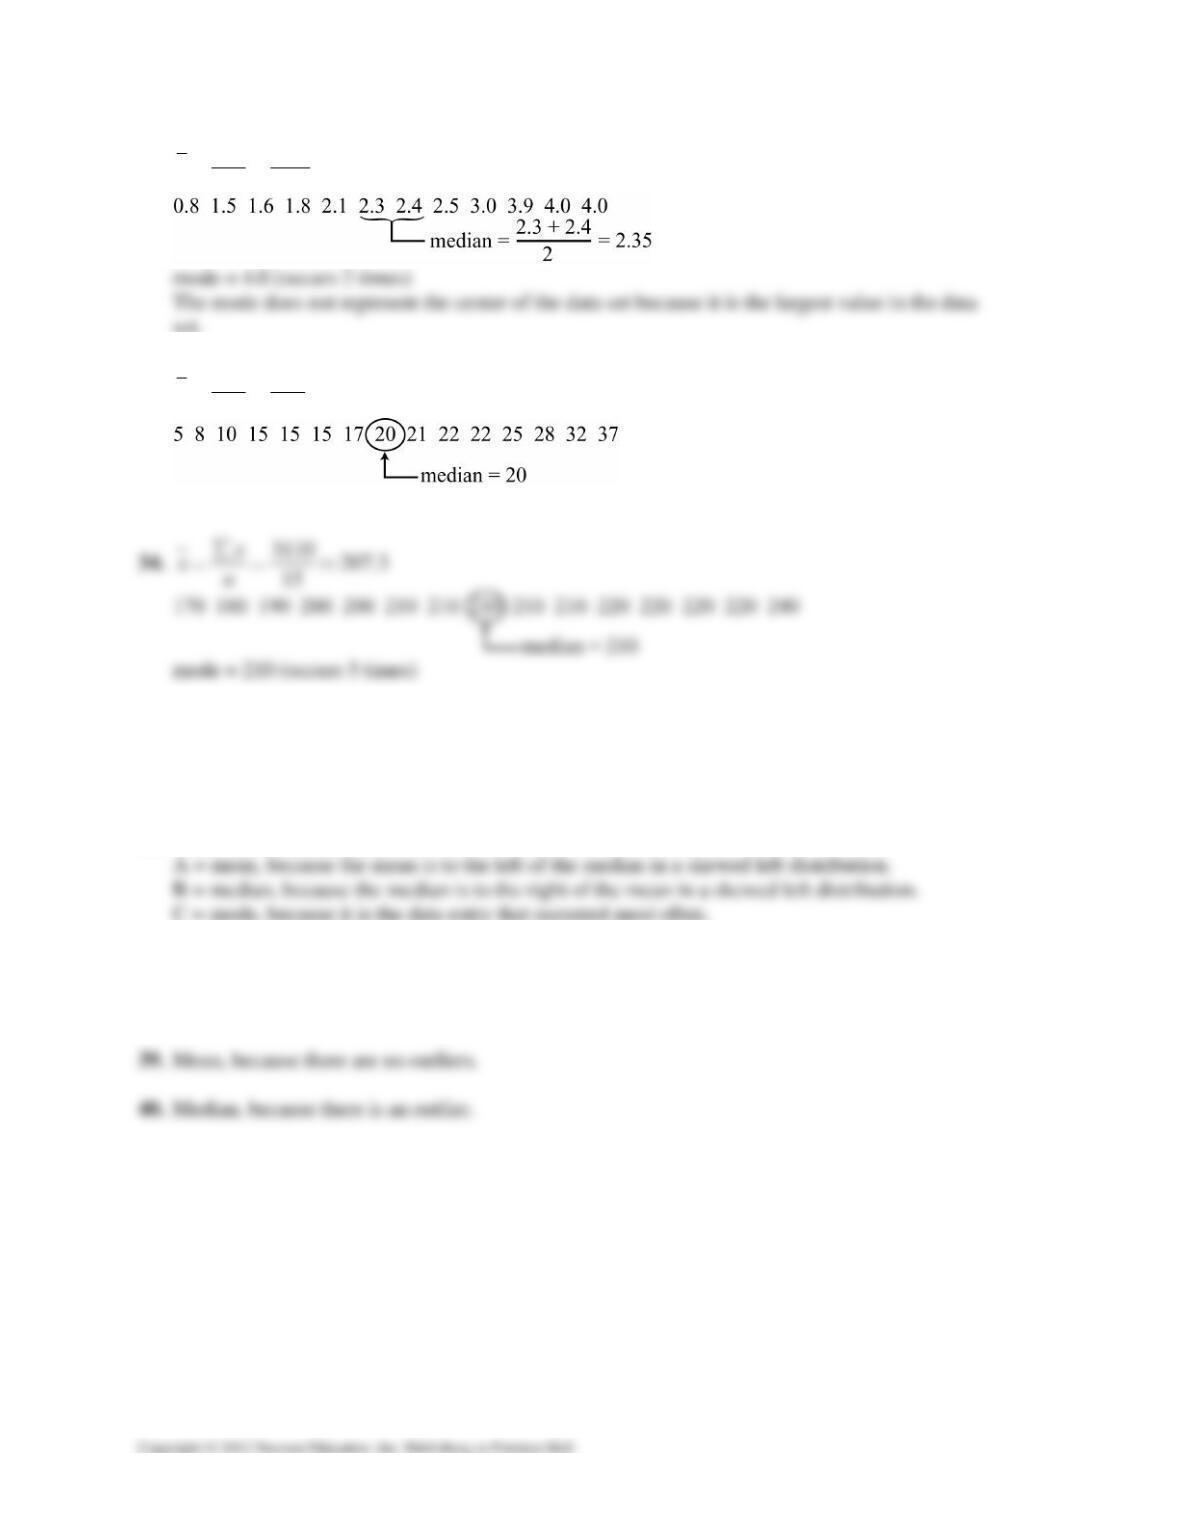
31. 835 29.82
x
xn
∑
===
46 CHAPTER 2 │ DESCRIPTIVE STATISTICS
32. 29.9 2.49
12
x
xn
∑
== ≈
33. 292 19.47
15
x
xn
∑
==≈
mode = 15 (occurs 3 times)
35. The data are skewed right.
A = mode, because it is the data entry that occurred most often.
B = median, because the median is to the left of the mean in a skewed right distribution.
C = mean, because the mean is to the right of the median in a skewed right distribution.
36. The data are skewed left.
37. Mode, because the data are at the nominal level of measurement.
38. Mean, because the data are symmetric.
CHAPTER 2 │ DESCRIPTIVE STATISTICS 47
41.
Source Score, x Weight, w x · w
Homework 85 0.05 4.25
42.
Source Score, x Weight, w x · w
MBAs 92,500 8 740,000
43.
Balance, x Days, w x · w
$523 24 12,552
$2415 2 4830
$250 4 1000
30w=
∑
()
18,382xw⋅=
∑
()
18,382 $612.73
30
xw
xw
∑⋅
==≈
∑
44.
Balance, x Days, w x · w
$759 15 11,385
48 CHAPTER 2 │ DESCRIPTIVE STATISTICS
45.
Grade Points, x Credits, w x · w
B 3 3 9
46.
Source Score, x Weight, w x · w
Engineering 85 9 765
Business 81 13 1053
Math 90 5 450
27w=
∑
()
2268xw⋅=
∑
()
2268 84
27
xw
xw
∑⋅
===
∑
47.
Source Score, x Weight, w x · w
Homework 85 0.05 4.25
48.
Grade Points, x Credits, w x · w
A 4 3 12
B 3 3 9
CHAPTER 2 │ DESCRIPTIVE STATISTICS 49
49.
Class Midpoint, x Frequency, f x · f
29-33 31 11 341
34-38 36 12 432
50.
Class Midpoint, x Frequency, f x · f
22-27 24.5 16 392
28-33 30.5 2 61
24
51.
Class Midpoint, x Frequency, f x · f
0-9 4.5 55 247.5
10-19 14.5 70 1015
20-29 24.5 35 857.5
30-39 34.5 56 1932
40-49 44.5 74 3293
50 CHAPTER 2 │ DESCRIPTIVE STATISTICS
52.
Class Midpoint, x Frequency, f x · f
1-5 3 12 36
6-10 8 26 208
11-15 13 20 260
16-20 18 7 126
53. Range 297 127
Class width = 34 35
Number of classes 5
−
==⇒
Class Midpoint Frequency, f
127-161 144 9
162-196 179 8
197-231 214 3
232-266 249 3
267-301 284 1
24f∑=
Shape: Positively skewed
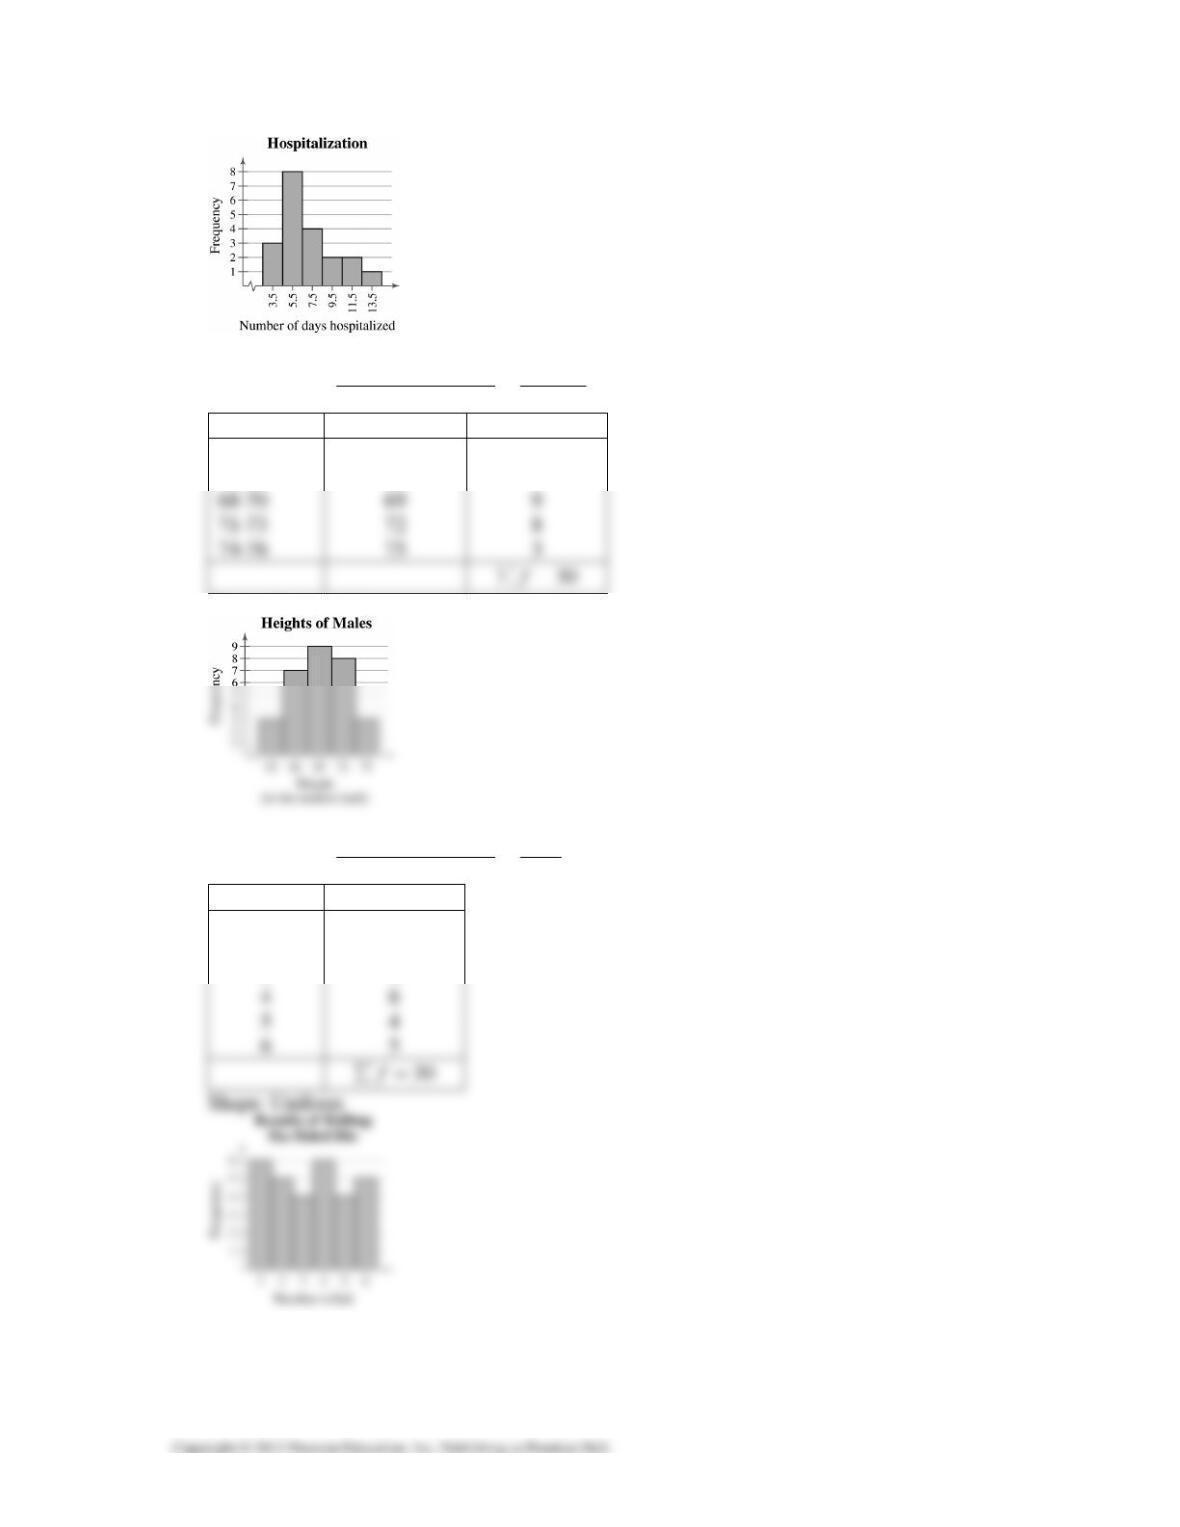
54. Range 14 3
Class width = 1.83 2
Number of classes 6
−
=≈⇒
Class Midpoint Frequency, f
3-4 3.5 3
5-6 5.5 8
CHAPTER 2 │ DESCRIPTIVE STATISTICS 51
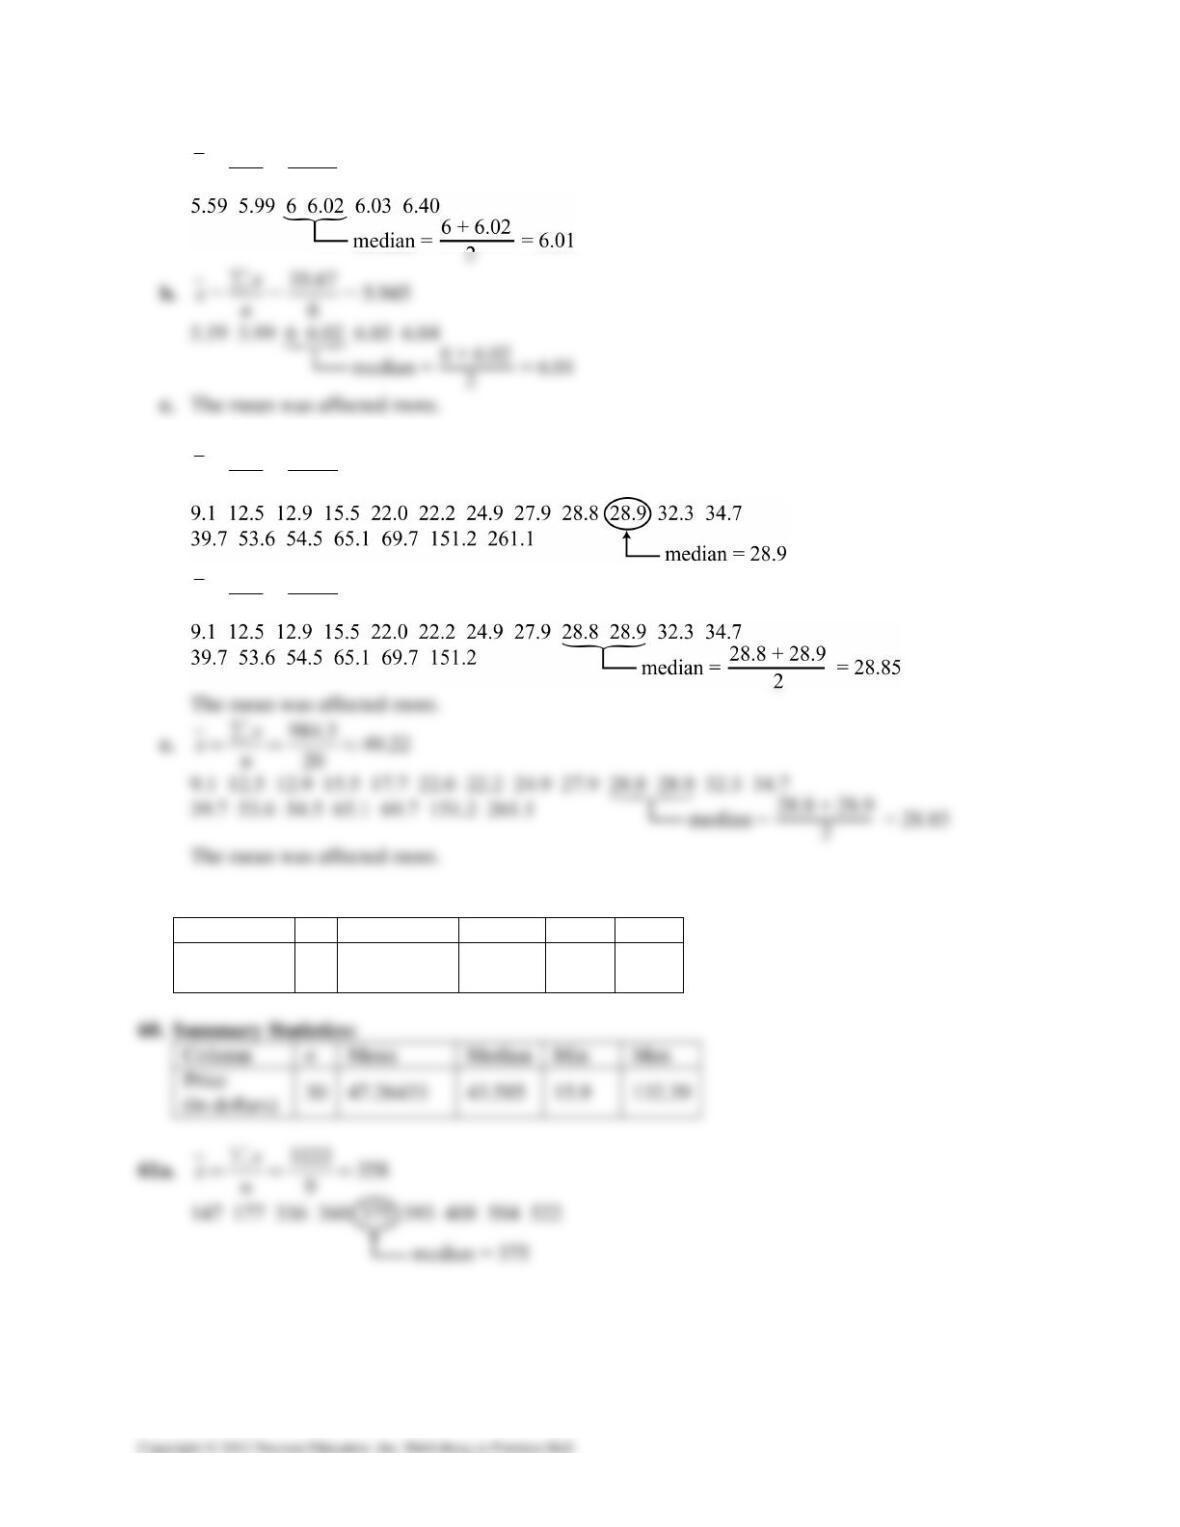
55. Range 76 62
Class width = 2.8 3
Number of classes 5
−
==⇒
Class Midpoint Frequency, f
62-64 63 3
65-67 66 7
Shape: Symmetric
56. Range 6 1
Class width = 0.8333 1
Number of classes 6
−
== ⇒
Class Frequency, f
1 6
2 5
3 4
52 CHAPTER 2 │ DESCRIPTIVE STATISTICS
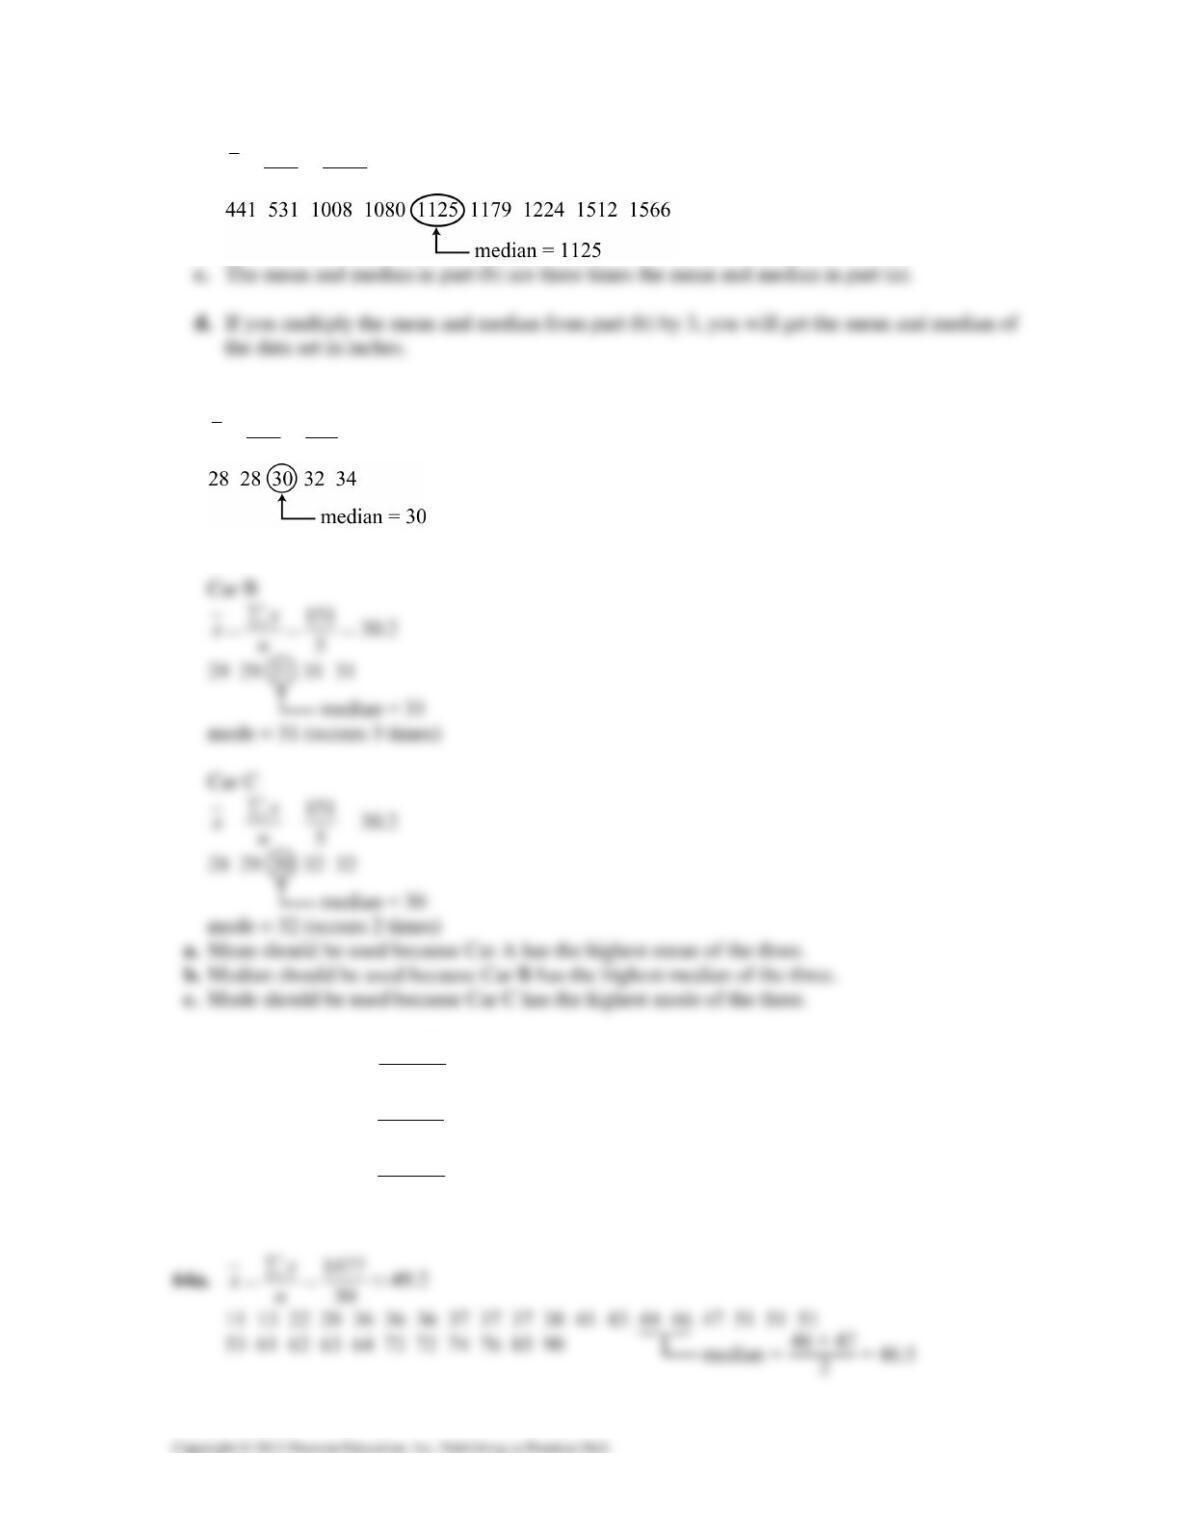
57a. 36.03 6.005
6
x
xn
∑
== =
58a. 966.6 50.87
19
x
xn
∑
== ≈
b. 705.5 39.19
18
x
xn
∑
== ≈
59. Summary Statistics:
Column n Mean Median Min Max
Amount
(in dollars) 11 112.11364 105.25 79 151.5
CHAPTER 2 │ DESCRIPTIVE STATISTICS 53
b. 9666 1074
9
x
xn
∑
== =
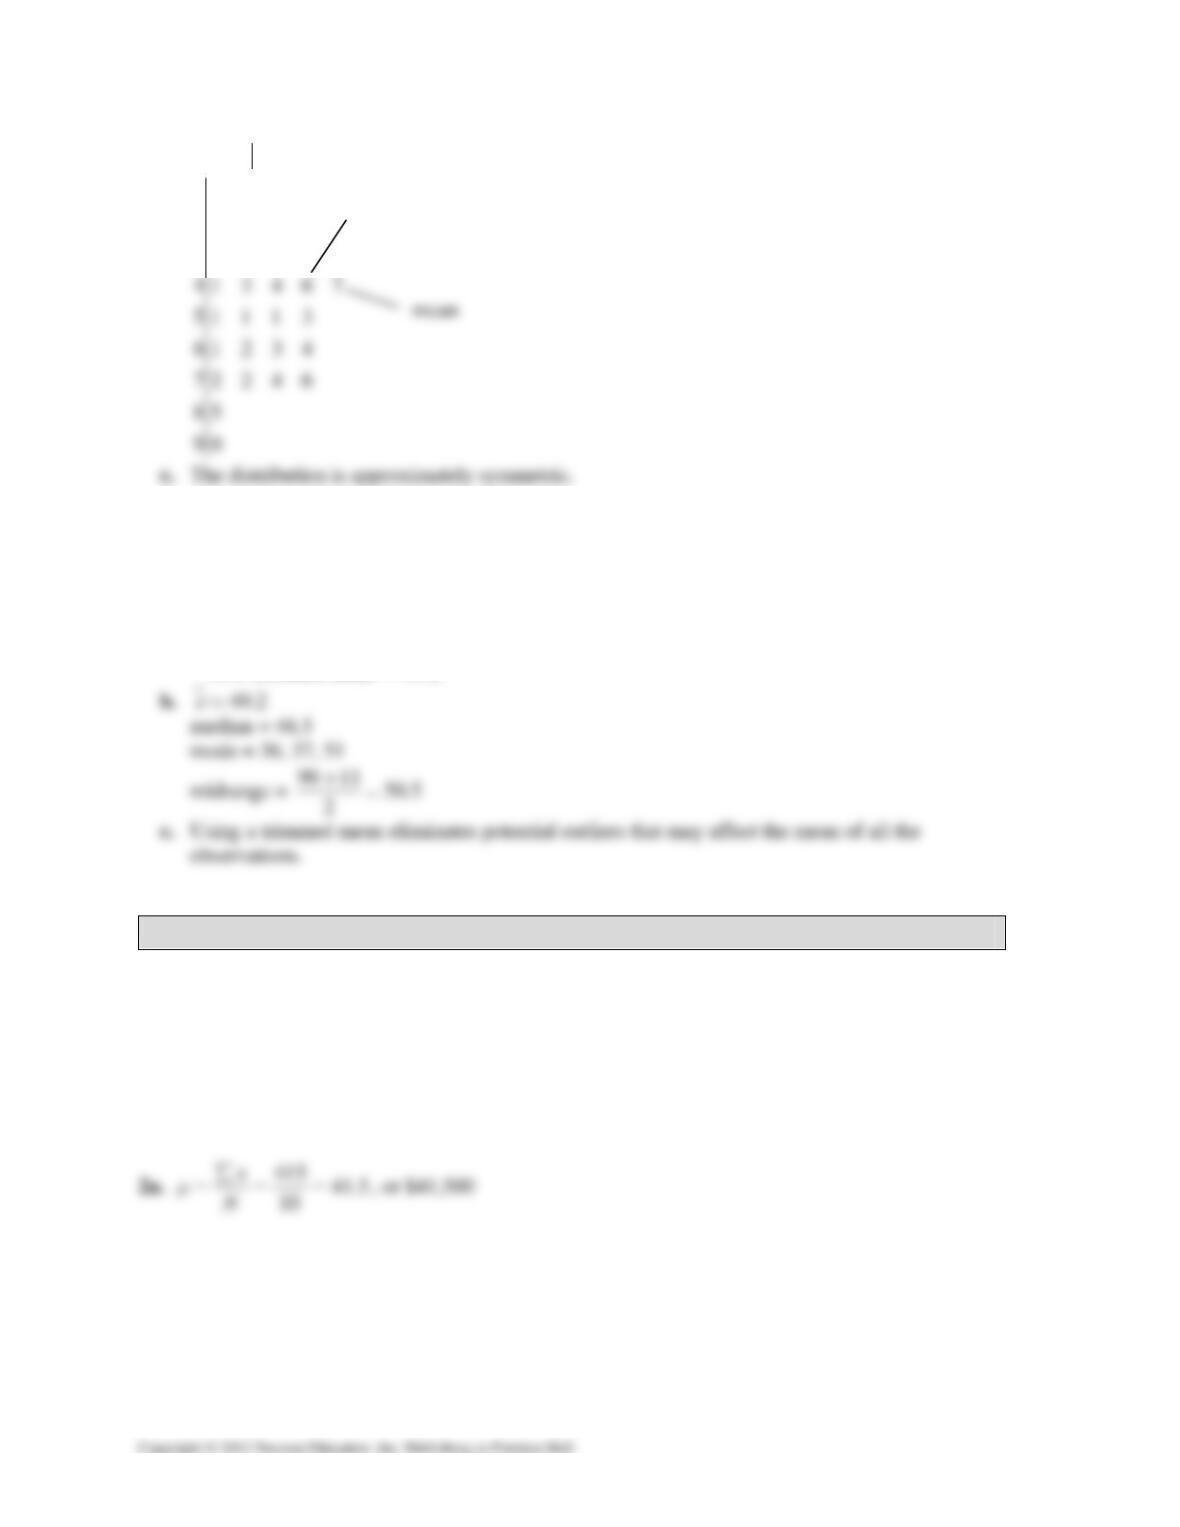
62. Car A
152 30.4
5
x
xn
∑
===
mode = 28 (occurs 2 times)
63. Car A: Midrange = 34 28 31
2
+=
Car B: Midrange = 31 29 30
2
+=
Car C: Midrange = 32 28 30
2
+=
Car A because it has the highest midrange of the three.
54 CHAPTER 2 │ DESCRIPTIVE STATISTICS
b. Key: 36 36= c. Positively skewed
113
228
36667778
65a. Order the data values.
11 13 22 28 36 36 36 37 37 37 38 41 43 44 46
47 51 51 51 53 61 62 63 64 72 72 74 76 85 90
Delete the lowest 10%, smallest 3 observations (11, 13, 22).
Delete the highest 10%, largest 3 observations (76, 85, 90).
Find the 10% trimmed mean using the remaining 24 observations.
10% trimmed mean 49.2≈
2.4 MEASURES OF VARIATION
2.4 Try It Yourself Solutions
1a. Min = 23, or $23,000 and Max = 58, or $58,000
b. Range = Max – Min = 58 – 23 = 35, or $35,000
c. The range of the starting salaries for Corporation B is 35, or $35,000. This is much larger than the
range for Corporation A.
median