CHAPTER
Descriptive Statistics
15
2
2.1 FREQUENCY DISTRIBUTIONS AND THEIR GRAPHS
2.1 Try It Yourself Solutions
1a. The number of classes is 8.
b. Min = 35, Max = 89, Class width = Range
Number of classes = 89 35
8
− = 6.75 7⇒
e.
Class Frequency, f
35-41 2
42-48 5
49-55 7
2a. See part (b).
b.
Class Frequency, f Midpoint Relative
frequency
Cumulative
frequency
35-41 2 38 0.04 2
16 CHAPTER 2 │ DESCRIPTIVE STATISTICS
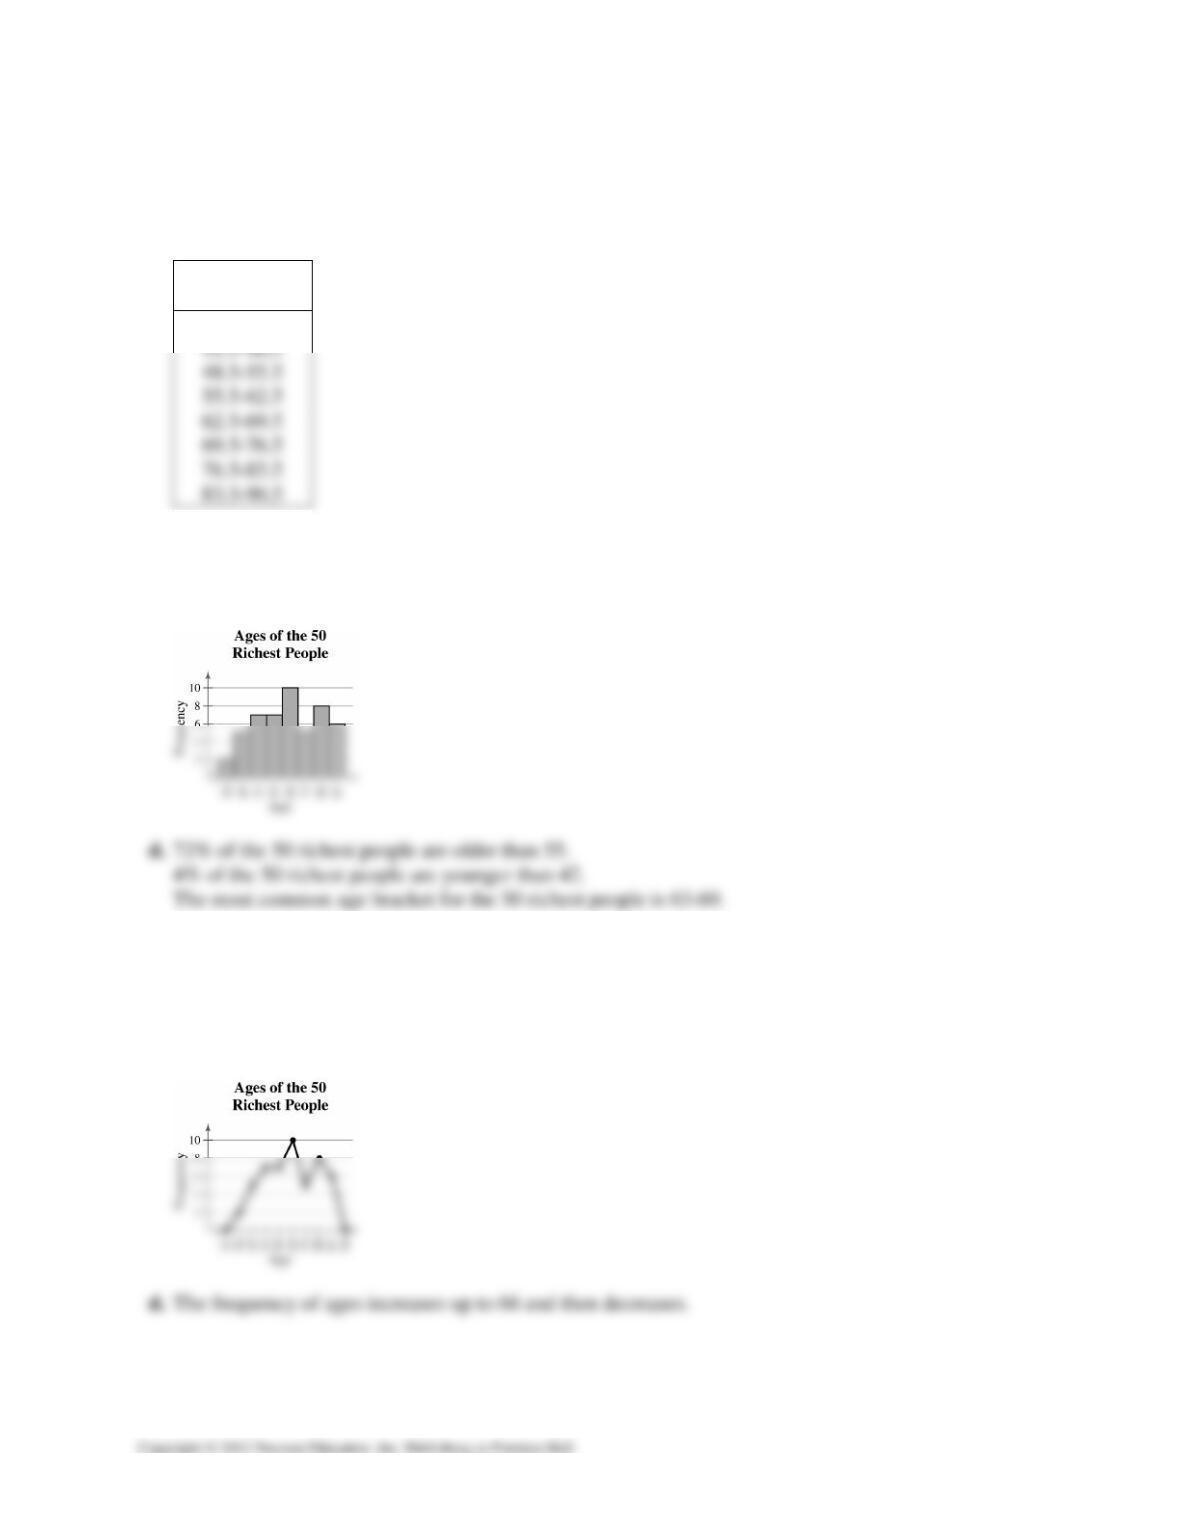
c. 72% of the 50 richest people are older than 55.
4% of the 50 richest people are younger than 42.
The most common age bracket for the 50 richest people is 63-69.
3a.
Class
Boundaries
34.5-41.5
b. Use class midpoints for the horizontal scale and frequency for the vertical scale. (Class
boundaries can also be used for the horizontal scale.)
c.
4a. Use class midpoints for the horizontal scale and frequency for the vertical scale. (Class
boundaries can also be used for the horizontal scale.)
b. See part (c).
c.
CHAPTER 2 │ DESCRIPTIVE STATISTICS 17
5abc.
6a. Use upper class boundaries for the horizontal scale and cumulative frequency for the vertical
scale.
b. See part (c).
c.
7ab.
2.1 EXERCISE SOLUTIONS
1. Organizing the data into a frequency distribution may make patterns within the data more evident.
Sometimes it is easier to identify patterns of a data set by looking at a graph of the frequency
distribution.
18 CHAPTER 2 │ DESCRIPTIVE STATISTICS
4. Relative frequency of a class is the portion or percentage of the data that falls in that class.
Cumulative frequency of a class is the sum of the frequencies of that class and all previous
classes.
7. False. Class width is the difference between the lower (or upper limits) of consecutive classes.
8. True
12. Class width = Range
Number of classes = 88 12
6
− ≈ 12.7 13⇒
Lower class limits: 12, 25, 38, 51, 64, 77
Upper class limits: 24, 37, 50, 63, 76, 89
13. Class width = Range
Number of classes = 135 17
8
− = 14.75 15⇒
Lower class limits: 17, 32, 47, 62, 77, 92, 107, 122
Upper class limits: 31, 46, 61, 76, 91, 106, 121, 136
CHAPTER 2 │ DESCRIPTIVE STATISTICS 19
b. and c.
Class Frequency, f Midpoint Class
boundaries
20-30 19 25 19.5-30.5
31-41 43 36 30.5-41.5
86-96 24 91 85.5-96.5
16a. Class width = 10 – 0 = 10
b. and c.
Class Frequency, f Midpoint Class
boundaries
0-9 188 4.5
0.5−-9.5
10-19 372 14.5 9.5-19.5
17.
Class Frequency, f Midpoint Relative
frequency
Cumulative
frequency
20-30 19 25 0.05 19
18.
Class Frequency, f Midpoint Relative
frequency
Cumulative
frequency
0-9 188 4.5 0.15 188
10-19 372 14.5 0.30 560
20 CHAPTER 2 │ DESCRIPTIVE STATISTICS
19a. Number of classes = 7 b. Least frequency 10
c. Greatest frequency 300 d. Class width = 10
23a. 42 b. 29.5 pounds
c. 35 d. 2
24a. 48 b. 66 inches
c. 20 d. 6
26a. Class with greatest relative frequency: 19-20 minutes
Class with least relative frequency: 21-22 minutes
b. Greatest relative frequency 40%
Least relative frequency 2%
c. Approximately 33%
29. Class width = Range
Number of classes = 39 0
5
− = 7.8 8⇒
Class Frequency, f Midpoint Relative
frequency
Cumulative
frequency
0-7 8 3.5 0.32 8
8-15 8 11.5 0.32 16
16-23 3 19.5 0.12 19
CHAPTER 2 │ DESCRIPTIVE STATISTICS 21
30. Class width = Range
Number of classes = 530 30
6
− 83.3 84⇒
Class Frequency, f Midpoint Relative
frequency
Cumulative
frequency
30-113 5 71.5 0.1724 5
114-197 7 155.5 0.2414 12
198-281 8 239.5 0.2759 20
31. Class width = Range
Number of classes = 7119 1000
6
− 1019.83 1020⇒
Class Frequency, f Midpoint Relative
frequency
Cumulative
frequency
1000-2019 12 1509.5 0.5455 12
2020-3039 3 2529.5 0.1364 15
3040-4059 2 3549.5 0.0909 17
The graph shows that most of the sales representatives at the company sold between $1000 and
$2019. (Answers will vary.)
32. Class width = Range
Number of classes = 51 32
5
− = 3.8 4⇒
Class Frequency, f Midpoint Relative
frequency
Cumulative
frequency
32-35 3 33.5 0.1250 3
36-39 9 37.5 0.3750 12
22 CHAPTER 2 │ DESCRIPTIVE STATISTICS
33. Class width = Range
Number of classes = 514 291
8
− = 27.875 28⇒
Class Frequency, f Midpoint Relative
frequency
Cumulative
frequency
291-318 5 304.5 0.1667 5
319-346 4 332.5 0.1333 9
347-374 3 360.5 0.1000 12
The graph shows that the most frequent reaction times were between 403 and 430 milliseconds.
(Answers will vary.)
34. Class width = Range
Number of classes = 2888 2456
5
− = 86.4 87⇒
Class Frequency, f Midpoint Relative
frequency
Cumulative
frequency
2456-2542 7 2499 0.28 7
2543-2629 3 2586 0.12 10
CHAPTER 2 │ DESCRIPTIVE STATISTICS 23
35. Class width = Range
Number of classes = 55 24
5
− = 6.2 7⇒
Class Frequency, f Midpoint Relative
frequency
Cumulative
frequency
24-30 9 27 0.30 9
31-37 8 34 0.27 17
n
36. Class width = Range
Number of classes = 80 10
5
− = 14 15⇒
Class Frequency, f Midpoint Relative
frequency
Cumulative
frequency
10-24 11 17 0.3438 11
24 CHAPTER 2 │ DESCRIPTIVE STATISTICS
37. Class width = Range
Number of classes = 462 138
5
− = 64.8 65⇒
Class Frequency, f Midpoint Relative
frequency
Cumulative
frequency
138-202 12 170 0.46 12
203-267 6 235 0.23 18
n
38. Class width = Range
Number of classes = 14 6
5
− = 1.6 2⇒
Class Frequency, f Midpoint Relative
frequency
Cumulative
frequency
6-7 3 6.5 0.12 3
8-9 10 8.5 0.38 13
CHAPTER 2 │ DESCRIPTIVE STATISTICS 25
39. Class width = Range
Number of classes = 73 52
6
− = 3.5 4⇒
Class Frequency, f Relative
frequency
Cumulative
frequency
52-55 3 0.125 3
56-59 3 0.125 6
Location of the greatest increase in frequency: 60-63
40. Class width = Range
Number of classes = 57 16
6
− 6.83 7⇒
Class Frequency, f Relative
frequency
Cumulative
frequency
16-22 2 0.10 2
23-29 3 0.15 5
30-36 8 0.40 13
26 CHAPTER 2 │ DESCRIPTIVE STATISTICS
41. Class width = Range
Number of classes = 98 47
5
− = 10.2 11⇒
Class Frequency, f Midpoint Relative
frequency
Cumulative
frequency
47-57 1 52 0.05 1
58-68 1 63 0.05 2
20f=
∑ 1
f
N
=
∑
42. Class width = Range
Number of classes = 15 0
6
− = 2.5 3⇒
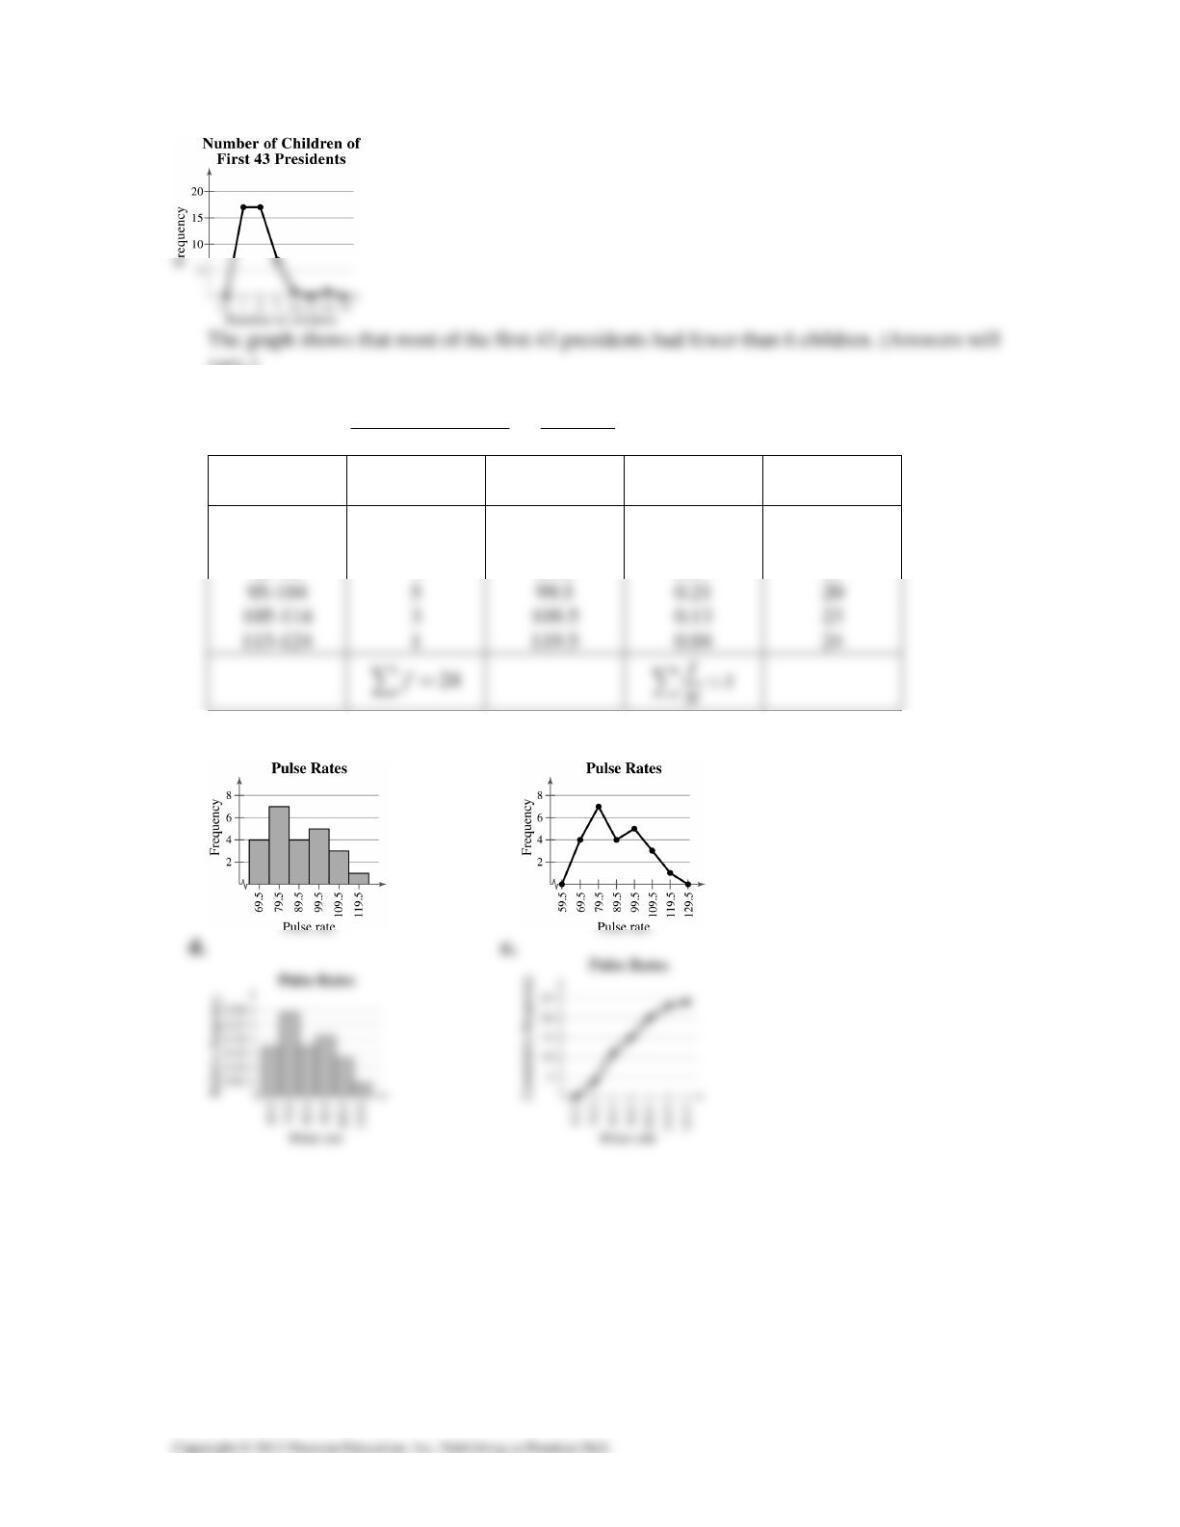
Class Frequency, f Midpoint Relative
frequency
Cumulative
frequency
0-2 17 1 0.3953 17
3-5 17 4 0.3953 34
6-8 7 7 0.1628 41
CHAPTER 2 │ DESCRIPTIVE STATISTICS 27
vary.)
43a. Class width = Range
Number of classes = 120 65 9.2 10
6
−≈⇒
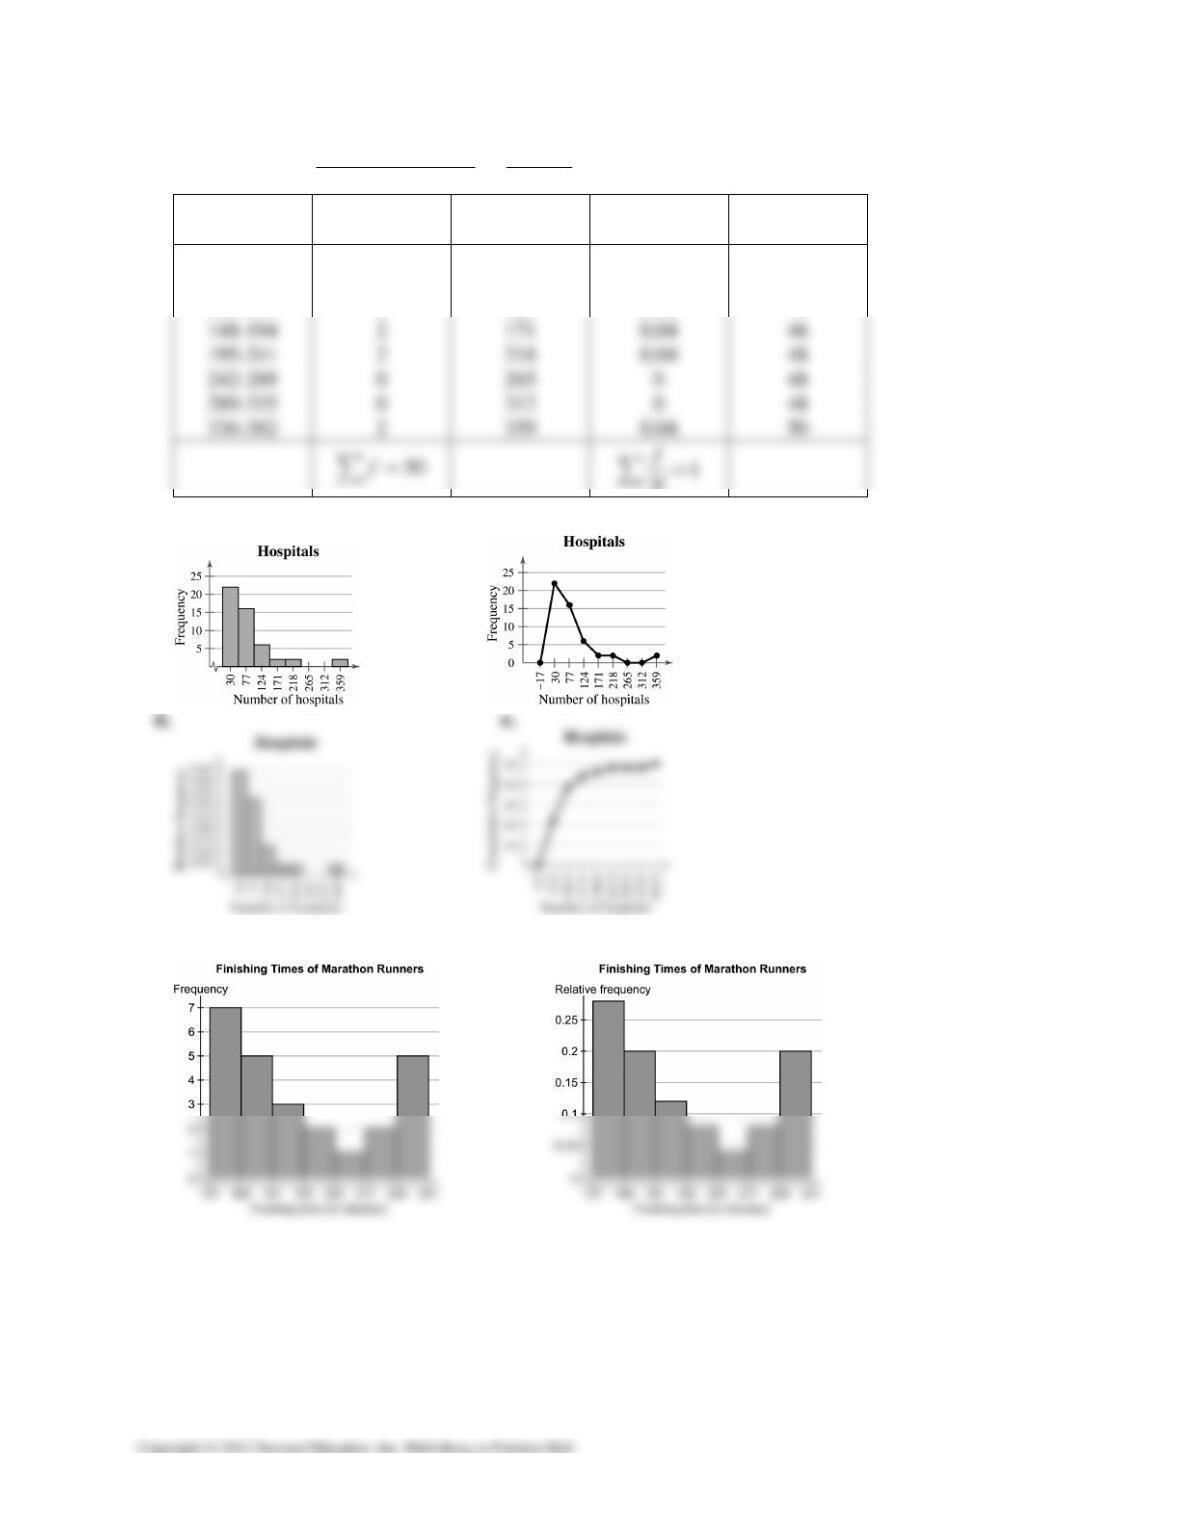
Class Frequency, f Midpoint Relative
frequency
Cumulative
frequency
65-74 4 69.5 0.17 4
75-84 7 79.5 0.29 11
85-94 4 89.5 0.17 15
b. c.
28 CHAPTER 2 │ DESCRIPTIVE STATISTICS
44a. Class width = Range
Number of classes = 378 7 46.375 47
8
−=⇒
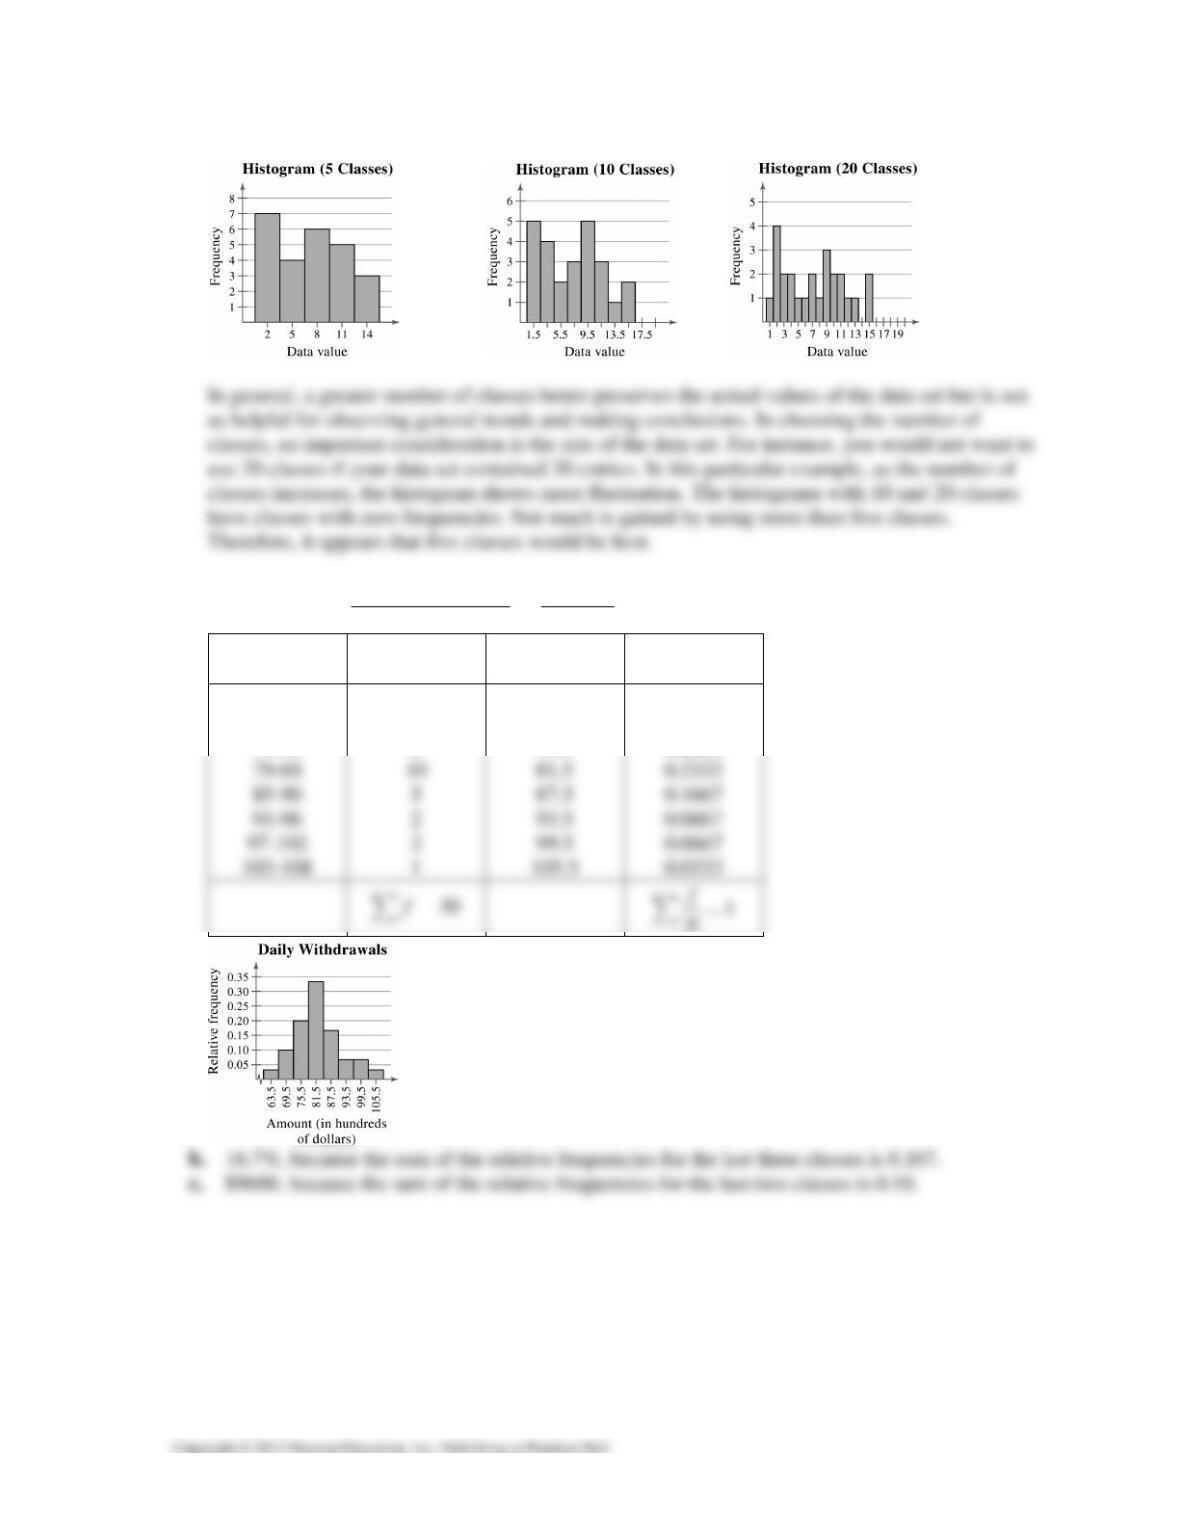
Class Frequency, f Midpoint Relative
frequency
Cumulative
frequency
7-53 22 30 0.44 22
54-100 16 77 0.32 38
101-147 6 124 0.12 44
N
b. c.
45.
CHAPTER 2 │ DESCRIPTIVE STATISTICS 29
46.
47a. Class width = Range
Number of classes = 104 61 5.375 6
8
−=⇒
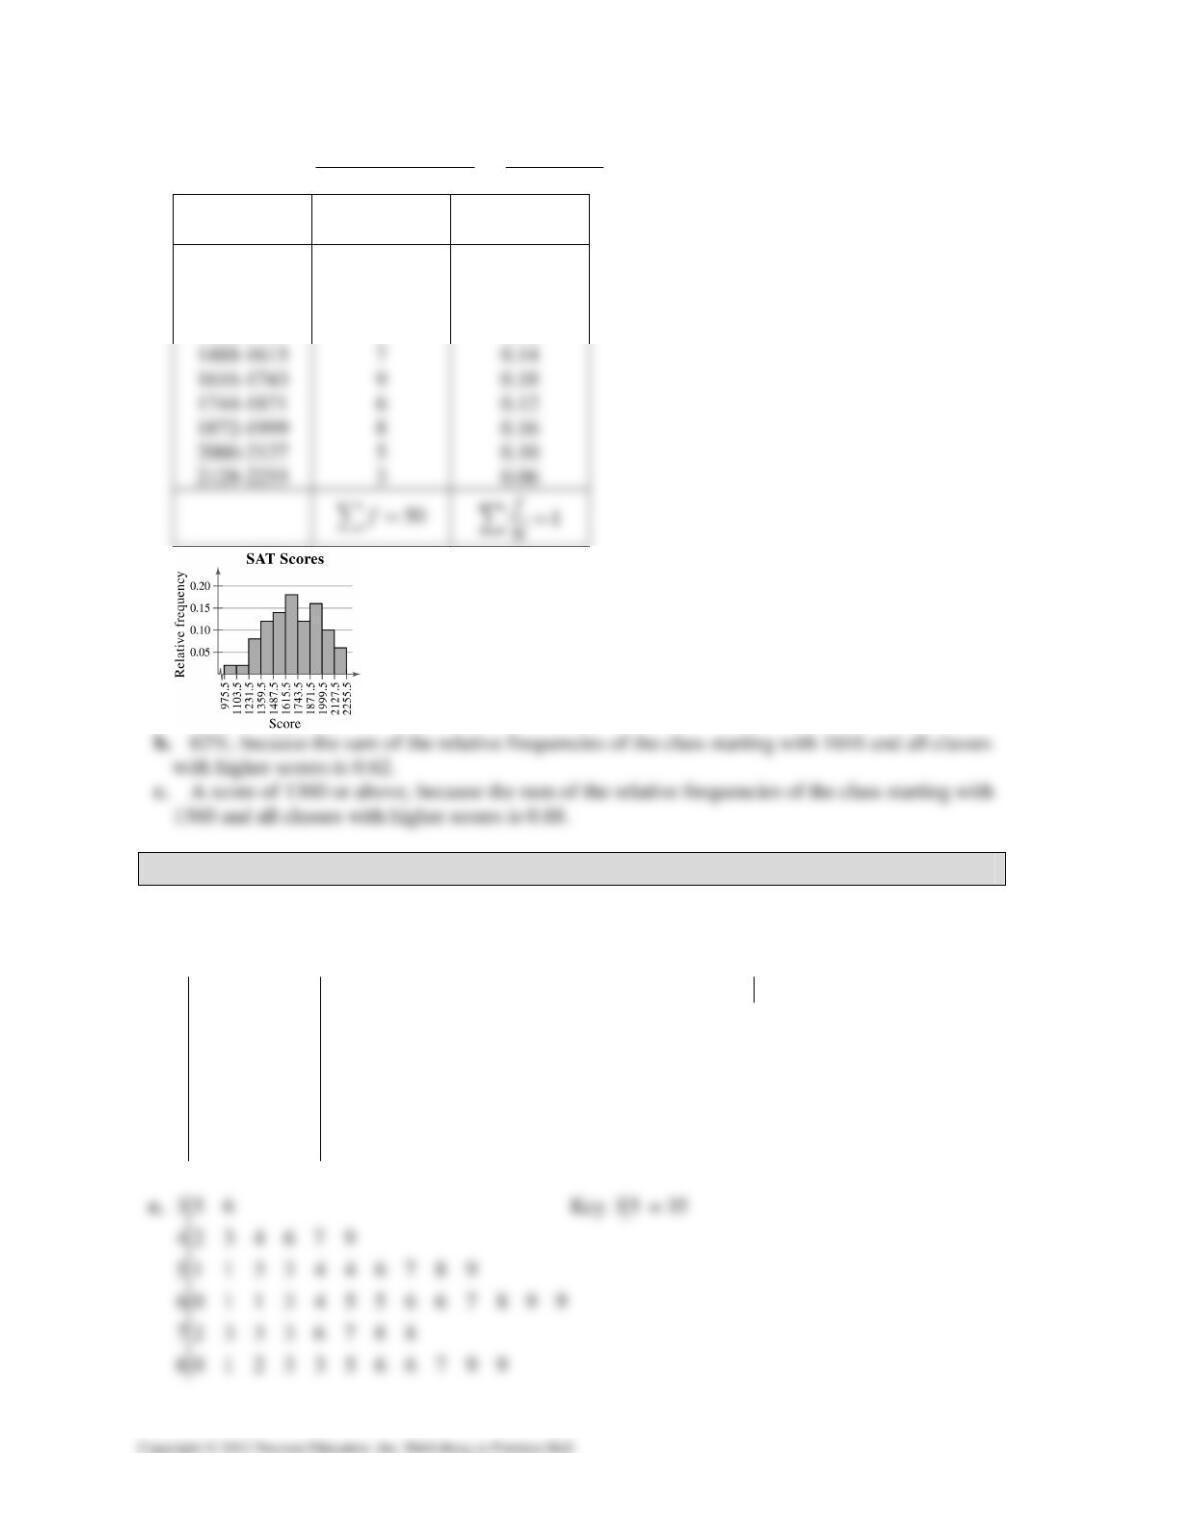
Class Frequency, f Midpoint Relative
frequency
61-66 1 63.5 0.0333
67-72 3 69.5 0.1000
73-78 6 75.5 0.2000
N
30 CHAPTER 2 │ DESCRIPTIVE STATISTICS
48a. Class width = Range
Number of classes = 2250 976 127.4 128
10
−=⇒
Class Frequency, f Relative
frequency
976-1103 1 0.02
1104-1231 1 0.02
1232-1359 4 0.08
1360-1487 6 0.12
2.2 MORE GRAPHS AND DISPLAYS
2.2 Try It Yourself Solutions
1a. 3
4
5
6
7
8
b. 36 5
9764324
9876443311
5
99876655431106
88763332
7
99766533210
8
Key 36 = 36
CHAPTER 2 │ DESCRIPTIVE STATISTICS 31
2a, b.
3Key 3535
563
234
4
6794
=
b.
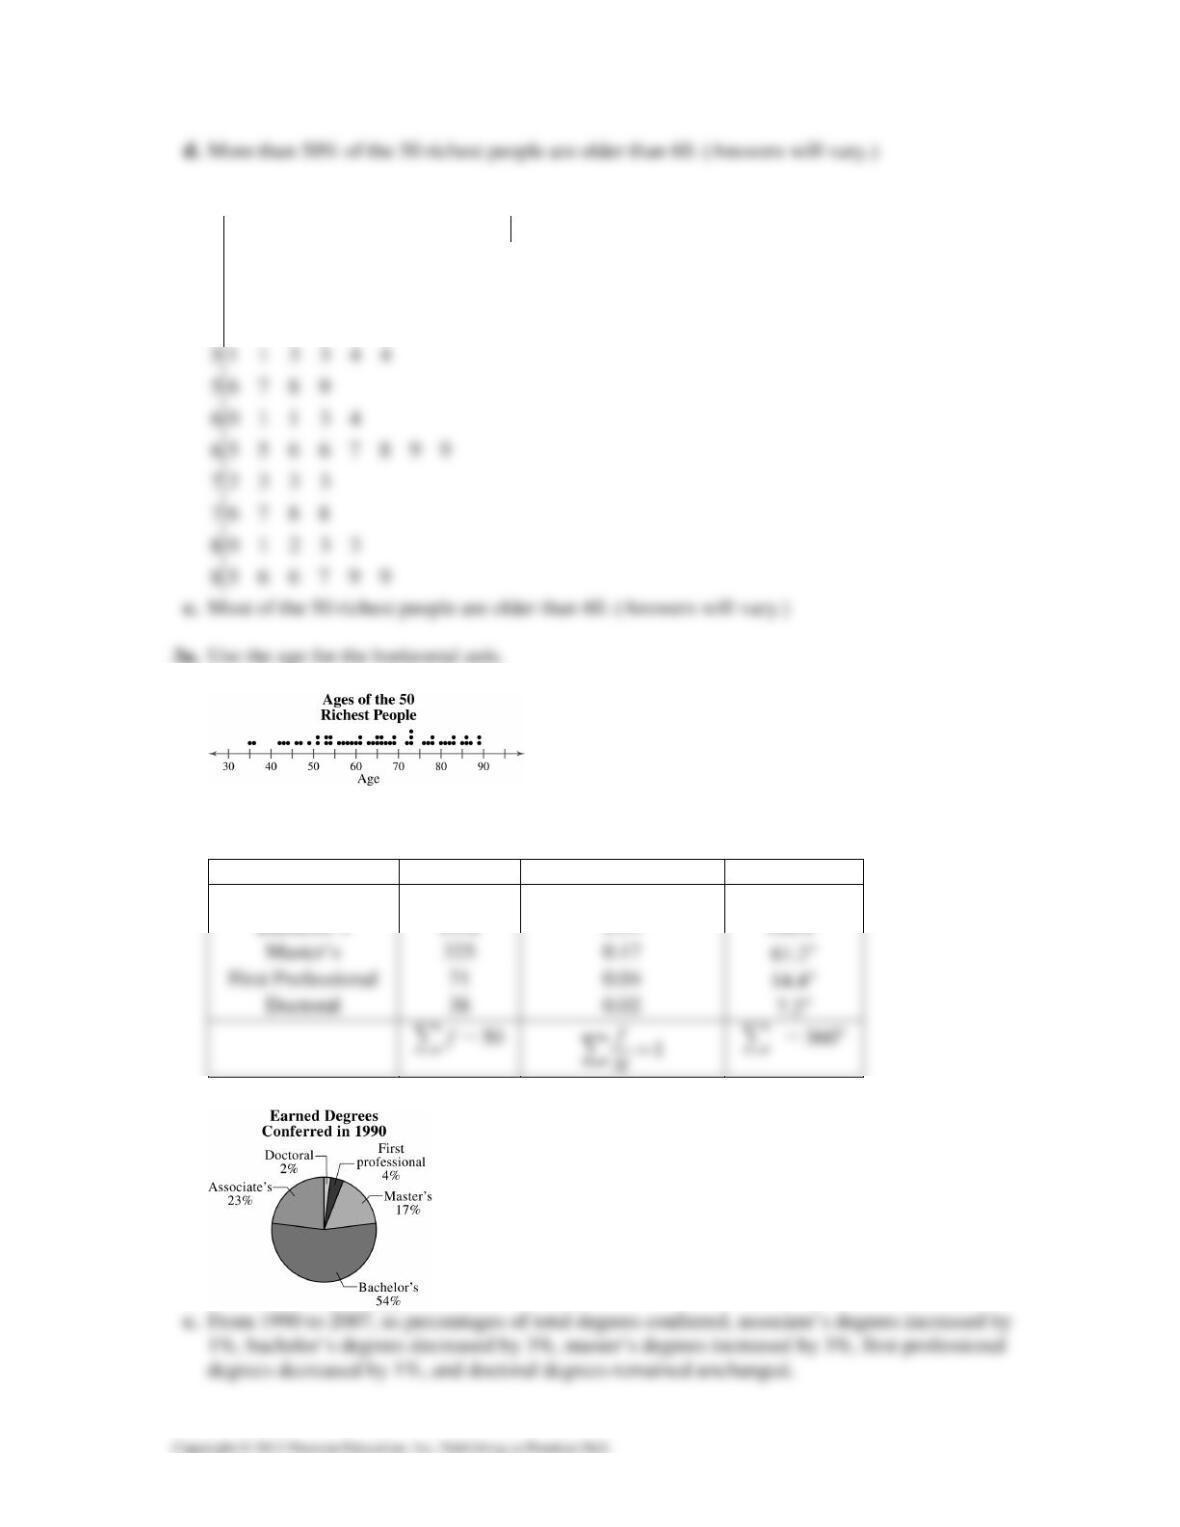
c. A large percentage of the ages are over 60. (Answers will vary.)
4a.
Type of Degree f Relative Frequency Angle
Associate’s 455 0.23 82.8°
Bachelor’s 1052 0.54 194.4°
b.
32 CHAPTER 2 │ DESCRIPTIVE STATISTICS
5a.
Cause Frequency, f
Auto Dealers 14,668
b.
6a, b.
c. It appears that the longer an employee is with the company, the larger the employee’s salary will
be.
2.2 EXERCISE SOLUTIONS
1. Quantitative: stem-and-leaf plot, dot plot, histogram, time series chart, scatter plot.
Qualitative: pie chart, Pareto chart
CHAPTER 2 │ DESCRIPTIVE STATISTICS 33
3. Both the stem-and-leaf plot and the dot plot allow you to see how data are distributed, determine
specific data entries, and identify unusual data values.
10. 12.9, 13.3, 13.6, 13.7, 13.7, 14.1, 14.1, 14.1, 14.1, 14.3, 14.4, 14.4, 14.6, 14.9, 14.9, 15.0, 15.0,
15.0, 15.1, 15.2, 15.4, 15.6, 15.7, 15.8, 15.8, 15.8, 15.9, 16.1, 16.6, 16.7
Max: 16.7 Min: 12.9
11. 13, 13, 14, 14, 14, 15, 15, 15, 15, 15, 16, 17, 17, 18, 19
Max: 19 Min: 13
12. 214, 214, 214, 216, 216, 217, 218, 218, 220, 221, 223, 224, 225, 225, 227, 228, 228, 228, 228,
230, 230, 231, 235, 237, 239
Max: 239 Min: 214
16. Answers will vary. Sample answer: The most frequent incident occurring while driving and using
a cell phone is swerving. Twice as many people “sped up” than “cut off a car.”
17. Key: 67 67=
678
34 CHAPTER 2 │ DESCRIPTIVE STATISTICS
18. Key: 49 49=
489
50 0 0 1 2
19. Key: 43 4.3=
439
20. Key: 17 5 17.5=
16 48
21.
It appears that systolic blood pressure tends to be between 120 and 150 millimeters of mercury.
(Answers will vary.)