Archives
Chapter 01 The process of using data collected from a small group to reach
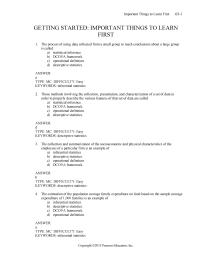
Important Things to Learn First GS-1 Copyright ©2015 Pearson Education, Inc. GETTING STARTED: IMPORTANT THINGS TO LEARN FIRST 1. The process of using data collected from a small group to reach conclusions about a large group is called a) statistical […]
Chapter 1 Which of the following is a discrete quantitative (numerical) variable
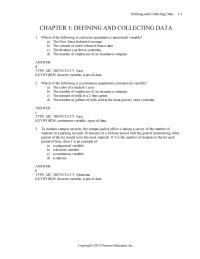
Defining and Collecting Data 1-1 Copyright ©2015 Pearson Education, Inc. CHAPTER 1: DEFINING AND COLLECTING DATA 1. Which of the following is a discrete quantitative (numerical) variable? a) The Dow Jones Industrial average b) The volume of water released from […]
Chapter 10 When the sample sizes are equal, the pooled variance of the two groups is
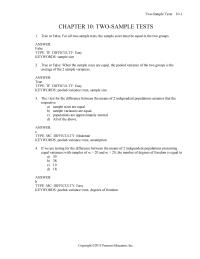
Two-Sample Tests 10-1 Copyright ©2015 Pearson Education, Inc. CHAPTER 10: TWO-SAMPLE TESTS 1. True or False: For all two-sample tests, the sample sizes must be equal in the two groups. ANSWER: False TYPE: TF DIFFICULTY: Easy KEYWORDS: sample size 2. […]
Chapter 11 if the computed F statistic is greater than the critical
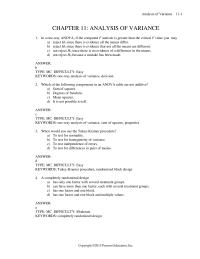
Analysis of Variance 11-1 CHAPTER 11: ANALYSIS OF VARIANCE 1. In a one-way ANOVA, if the computed F statistic is greater than the critical F value you may a) reject H0 since there is evidence all the means differ. b) […]
Chapter 12 If we use the method of analysis to test for the differences
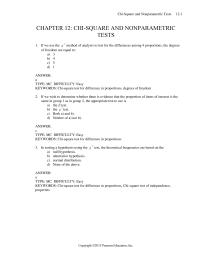
Chi-Square and Nonparametric Tests 12-1 Copyright ©2015 Pearson Education, Inc. CHAPTER 12: CHI-SQUARE AND NONPARAMETRIC TESTS 1. If we use the 2 method of analysis to test for the differences among 4 proportions, the degrees of freedom are equal […]
Chapter 13 The least squares method minimizes which of the following
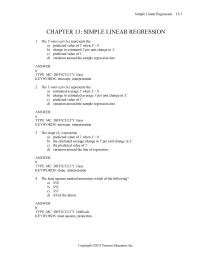
Simple Linear Regression 13-1 Copyright ©2015 Pearson Education, Inc. CHAPTER 13: SIMPLE LINEAR REGRESSION 1. The Y-intercept (b0) represents the a) predicted value of Y when X = 0. b) change in estimated Y per unit change in X. c) […]
Chapter 14 the mean percentage of students passing the proficiency test is estimated
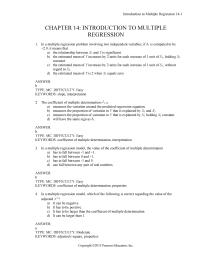
Introduction to Multiple Regression 14-1 Copyright ©2015 Pearson Education, Inc. CHAPTER 14: INTRODUCTION TO MULTIPLE REGRESSION 1. In a multiple regression problem involving two independent variables, if b1 is computed to be +2.0, it means that a) the relationship between […]
Chapter 15 A real estate builder wishes to determine how house size
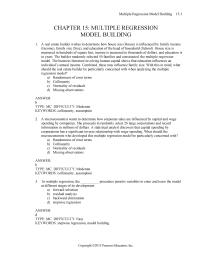
Multiple Regression Model Building 15-1 Copyright ©2015 Pearson Education, Inc. CHAPTER 15: MULTIPLE REGRESSION MODEL BUILDING 1. A real estate builder wishes to determine how house size (House) is influenced by family income (Income), family size (Size), and education of […]
Chapter 16 after estimating a trend model for annual time-series data
Time-Series Forecasting 16-1 CHAPTER 16: TIME-SERIES FORECASTING 1. The effect of an unpredictable, rare event will be contained in the ___________ component. a) trend b) cyclical c) irregular d) seasonal ANSWER: c TYPE: MC DIFFICULTY: Easy KEYWORDS: component factors, properties […]
Chapter 17 explores business activities that have occurred or are occurring
Business Analytics 17-1 CHAPTER 17: BUSINESS ANALYTICS 1. Which of the following disciplines is typically NOT involved in business analytics? a) Economics b) Statistics c) Information system d) Management science ANSWER: a TYPE: MC DIFFICULTY: Easy KEYWORDS: analytic methods, definition […]
Chapter 18 referring to scenario 18-8, which of the following is a correct statement
A Roadmap for Analyzing Data 18-1 CHAPTER 18: A ROADMAP FOR ANALYZING DATA 1. The probability that a particular brand of smoke alarm will function properly and sound an alarm in the presence of smoke is 0.8. You have 5 […]
Chapter 19 The principal focus of the control chart is the attempt to separate special
Statistical Applications in Quality Management 19-1 ONLINE CHAPTER 19: STATISTICAL APPLICATIONS IN QUALITY MANAGEMENT 1. The control chart a) focuses on the time dimension of a system. b) captures the natural variability in the system. c) can be used for […]
Chapter 2 An insurance company evaluates many numerical variables
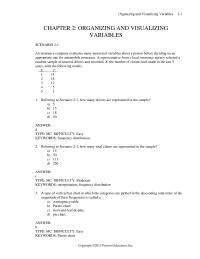
Organizing and Visualizing Variables 2-1 CHAPTER 2: ORGANIZING AND VISUALIZING VARIABLES SCENARIO 2-1 An insurance company evaluates many numerical variables about a person before deciding on an appropriate rate for automobile insurance. A representative from a local insurance agency selected […]
Chapter 20 A tabular presentation that shows the outcome for each decision
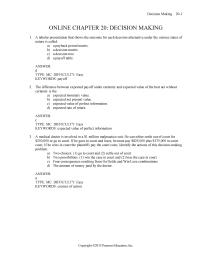
Decision Making 20-1 ONLINE CHAPTER 20: DECISION MAKING 1. A tabular presentation that shows the outcome for each decision alternative under the various states of nature is called: a) a payback period matrix. b) a decision matrix. c) a decision […]
Chapter 22 When you use the Poisson distribution to approximate
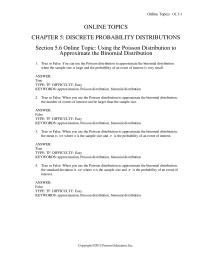
Online Topics OLT-1 ONLINE TOPICS CHAPTER 5: DISCRETE PROBABILITY DISTRIBUTIONS Section 5.6 Online Topic: Using the Poisson Distribution to Approximate the Binomial Distribution 1. True or False: You can use the Poisson distribution to approximate the binomial distribution when the […]
Chapter 3 Which of the following statistics is not a measure of central tendency
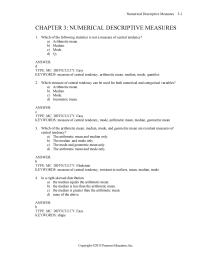
Numerical Descriptive Measures 3-1 Copyright ©2015 Pearson Education, Inc. CHAPTER 3: NUMERICAL DESCRIPTIVE MEASURES 1. Which of the following statistics is not a measure of central tendency? a) Arithmetic mean. b) Median. c) Mode. d) Q3. ANSWER: d TYPE: MC […]
Chapter 4 If two equally likely events A and B are collectively exhaustive
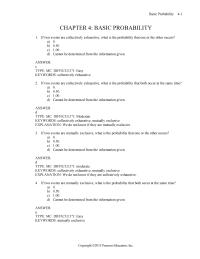
Basic Probability 4-1 Copyright ©2015 Pearson Education, Inc. CHAPTER 4: BASIC PROBABILITY 1. If two events are collectively exhaustive, what is the probability that one or the other occurs? a) 0. b) 0.50. c) 1.00. d) Cannot be determined from […]
Chapter 5 Thirty-six of the staff of 80 teachers at a local intermediate
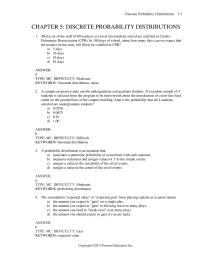
Discrete Probability Distributions 5-1 CHAPTER 5: DISCRETE PROBABILITY DISTRIBUTIONS 1. Thirty-six of the staff of 80 teachers at a local intermediate school are certified in Cardio– Pulmonary Resuscitation (CPR). In 180 days of school, about how many days can we […]
Chapter 6 Which of the following about the normal distribution is not true
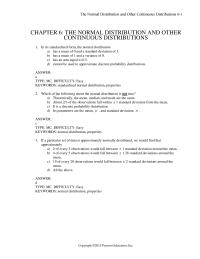
The Normal Distribution and Other Continuous Distributions 6-1 CHAPTER 6: THE NORMAL DISTRIBUTION AND OTHER CONTINUOUS DISTRIBUTIONS 1. In its standardized form, the normal distribution a) has a mean of 0 and a standard deviation of 1. b) has a […]
Chapter 7 If the expected value of a sample statistic is equal to the parameter
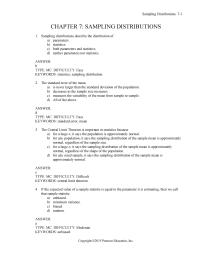
Sampling Distributions 7-1 Copyright ©2015 Pearson Education, Inc. CHAPTER 7: SAMPLING DISTRIBUTIONS 1. Sampling distributions describe the distribution of a) parameters. b) statistics. c) both parameters and statistics. d) neither parameters nor statistics. ANSWER: b TYPE: MC DIFFICULTY: Easy KEYWORDS: […]
Chapter 8 If it is decided to take a larger sample and to decrease the confidence
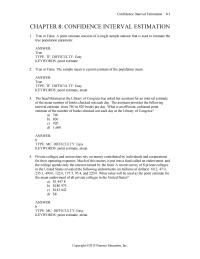
Confidence Interval Estimation 8-1 Copyright ©2015 Pearson Education, Inc. CHAPTER 8: CONFIDENCE INTERVAL ESTIMATION 1. True or False: A point estimate consists of a single sample statistic that is used to estimate the true population parameter. ANSWER: True TYPE: TF […]
Chapter 9 Which of the following would be an appropriate null hypothesis
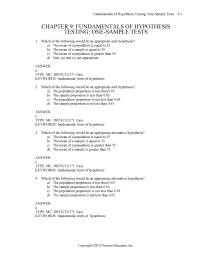
Fundamentals of Hypothesis Testing: One-Sample Tests 9-1 Copyright ©2015 Pearson Education, Inc. CHAPTER 9: FUNDAMENTALS OF HYPOTHESIS TESTING: ONE-SAMPLE TESTS 1. Which of the following would be an appropriate null hypothesis? a) The mean of a population is equal to […]