Chi-Square and Nonparametric Tests 12-1
CHAPTER 12: CHI-SQUARE AND NONPARAMETRIC
TESTS
1. If we use the
2
method of analysis to test for the differences among 4 proportions, the degrees
of freedom are equal to:
a) 3
b) 4
c) 5
d) 1
2. If we wish to determine whether there is evidence that the proportion of items of interest is the
same in group 1 as in group 2, the appropriate test to use is
a) the Z test.
b) the
2
test.
c) Both a) and b).
d) Neither of a) nor b).
2
3. In testing a hypothesis using the
test, the theoretical frequencies are based on the
a) null hypothesis.
b) alternative hypothesis.
c) normal distribution.
d) None of the above.
12-2 Chi-Square and Nonparametric Tests
SCENARIO 12-1
A corporation randomly selects 150 salespeople and finds that 66% who have never taken a self-
improvement course would like such a course. The firm did a similar study 10 years ago in which
60% of a random sample of 160 salespeople wanted a self-improvement course. The groups are
assumed to be independent random samples. Let
1
and
2
represent the true proportion of workers
who would like to attend a self-improvement course in the recent study and the past study,
respectively.
4. Referring to Scenario 12-1, if the firm wanted to test whether this proportion has changed from
the previous study, which represents the relevant hypotheses?
a) H0:
12
= 0 versus H1:
12
0
b) H0:
12
0 versus H1:
12
= 0
c) H0:
12
0 versus H1:
12
> 0
d) H0:
12
0 versus H1:
12
< 0
5. Referring to Scenario 12-1, what is the critical value when performing a chi-square test on
whether the population proportions are different if
= 0.05?
a)
1.645
b)
1.96
c) 3.841
d) 2.706
6. Referring to Scenario 12-1, what is the critical value when testing whether the population
proportions are different if
= 0.10?
a)
1.645
b)
1.96
c) 3.842
d) 2.706
Chi-Square and Nonparametric Tests 12-3
7. Referring to Scenario 12-1, what is the value of the test statistic to use in evaluating the
alternative hypothesis that there is a difference in the two population proportions using
=
0.10?
a) 4.335
b) 2.706
c) 1.194
d) 0.274
8. Referring to Scenario 12-1, the company tests to determine at the 0.05 level whether the
population proportion has changed from the previous study. Which of the following is most
correct?
a) Reject the null hypothesis and conclude that the proportion of employees who are
interested in a self-improvement course has changed over the intervening 10 years.
b) Do not reject the null hypothesis and conclude that the proportion of employees who are
interested in a self-improvement course has not changed over the intervening 10 years.
c) Reject the null hypothesis and conclude that the proportion of employees who are
interested in a self-improvement course has increased over the intervening 10 years.
d) Do not reject the null hypothesis and conclude that the proportion of employees who are
interested in a self-improvement course has increased over the intervening 10 years.
9. True or False: In testing the difference between two proportions using the normal distribution,
we may use either a one-tail Chi-square test or two-tail Z test.
10. True or False: The squared difference between the observed and theoretical frequencies should
be large if there is no significant difference between the proportions.
12-4 Chi-Square and Nonparametric Tests
11. True or False: A test for the difference between two proportions can be performed using the chi–
square distribution.
12. True or False: A test for whether one proportion is higher than the other can be performed using
the chi-square distribution.
SCENARIO 12-2
The dean of a college is interested in the proportion of graduates from his college who have a job
offer on graduation day. He is particularly interested in seeing if there is a difference in this
proportion for accounting and economics majors. In a random sample of 100 of each type of major at
graduation, he found that 65 accounting majors and 52 economics majors had job offers. If the
accounting majors are designated as “Group 1” and the economics majors are designated as “Group
2,” perform the appropriate hypothesis test using a level of significance of 0.05.
13. Referring to Scenario 12-2, the hypotheses the dean should use are:
a) H0:
12
= 0 versus H1:
12
0
b) H0:
12
0 versus H1:
12
= 0
c) H0:
12
0 versus H1:
12
> 0
d) H0:
12
0 versus H1:
12
< 0
14. Referring to Scenario 12-2, the null hypothesis will be rejected if the test statistic is ________.
15. Referring to Scenario 12-2, the value of the test statistic is ________.
Chi-Square and Nonparametric Tests 12-5
16. Referring to Scenario 12-2, the p-value of the test is ________.
17. True or False: Referring to Scenario 12-2, the null hypothesis should be rejected.
18. True or False: Referring to Scenario 12-2, the same decision would be made with this test if the
level of significance had been 0.01 rather than 0.05.
19. True or False: Referring to Scenario 12-2, the same decision would be made with this test if the
level of significance had been 0.10 rather than 0.05.
SCENARIO 12-3
The director of transportation of a large company is interested in the usage of her van pool. She
considers her routes to be divided into local and non-local. She is particularly interested in learning if
there is a difference in the proportion of males and females who use the local routes. She takes a
sample of a day’s riders and finds the following:
Male
Female
Total
Local
27
44
71
Non-Local
33
25
58
Total
60
69
129
She will use this information to perform a chi-square hypothesis test using a level of significance of
0.05.
12-6 Chi-Square and Nonparametric Tests
20. Referring to Scenario 12-3, the test will involve _________ degree(s) of freedom.
21. Referring to Scenario 12-3, the overall or mean proportion of local riders is __________.
22. Referring to Scenario 12-3, the expected cell frequency in the Male/Local cell is __________.
23. Referring to Scenario 12-3, the expected cell frequency in the Female/Non-Local cell is
__________.
24. Referring to Scenario 12-3, the critical value of the test is _________.
25. Referring to Scenario 12-3, the value of the test statistic is _________.
26. True or False: Referring to Scenario 12-3, the null hypothesis will be rejected.
Chi-Square and Nonparametric Tests 12-7
27. True or False: Referring to Scenario 12-3, the decision made suggests that there is a difference
between the proportion of males and females who ride local versus non-local routes.
SCENARIO 12-4
A computer used by a 24-hour banking service is supposed to randomly assign each transaction to
one of 5 memory locations. A check at the end of a day’s transactions gave the counts shown in the
table to each of the 5 memory locations, along with the number of reported errors.
Memory Location:
1
2
3
4
5
Number of Transactions:
82
100
74
92
102
Number of Reported Errors
11
12
6
9
10
The bank manager wanted to test whether the proportion of errors in transactions assigned to each of
the 5 memory locations differ.
28. Referring to Scenario 12-4, which test would be used to properly analyze the data in this
experiment?
a)
2
test of independence
b)
2
test for difference among more than two proportions
c) Wilcoxon rank sum test
d) Kruskal-Wallis rank Test
29. Referring to Scenario 12-4, the degrees of freedom of the test statistic is
a) 4
b) 8
c) 10
d) 448
12-8 Chi-Square and Nonparametric Tests
30. Referring to Scenario 12-4, the critical value of the test statistic at 1% level of significance is
a) 7.7794
b) 13.2767
c) 20.0902
d) 23.2093
31. Referring to Scenario 12-4, the calculated value of the test statistic is
a) -0.1777
b) -0.0185
c) 1.4999
d) 1.5190
32. Referring to Scenario 12-4, at 1% level of significance
a) there is sufficient evidence to conclude that the proportions of errors in transactions
assigned to each of the 5 memory locations are all different.
b) there is insufficient evidence to conclude that the proportions of errors in transactions
assigned to each of the 5 memory locations are all different.
c) there is sufficient evidence to conclude that the proportion of errors in transactions
assigned to each of the 5 memory locations are not all the same.
d) there is insufficient evidence to conclude that the proportion of errors in transactions
assigned to each of the 5 memory locations are not all the same.
Chi-Square and Nonparametric Tests 12-9
SCENARIO 12-5
Four surgical procedures currently are used to install pacemakers. If the patient does not need to
return for follow-up surgery, the operation is called a “clear” operation. A heart center wants to
compare the proportion of clear operations for the 4 procedures, and collects the following numbers
of patients from their own records:
Procedure
A
B
C
D
Total
Clear
27
41
21
7
96
Return
11
15
9
11
46
Total
38
56
30
18
142
They will use this information to test for a difference among the proportion of clear operations using
a chi-square test with a level of significance of 0.05.
33. Referring to Scenario 12-5, the test will involve _________ degrees of freedom.
34. Referring to Scenario 12-5, the overall or mean proportion of clear operations is __________.
35. Referring to Scenario 12-5, the expected cell frequency for the Procedure A/Clear cell is
__________.
36. Referring to Scenario 12-5, the expected cell frequency for the Procedure D/Return cell is
__________.
12-10 Chi-Square and Nonparametric Tests
37. Referring to Scenario 12-5, the critical value of the test is ________.
38. Referring to Scenario 12-5, the value of the test statistic is _________.
39. True or False: Referring to Scenario 12-5, the null hypothesis will be rejected.
40. True or False: Referring to Scenario 12-5, the decision made suggests that the 4 procedures all
have different proportions of clear operations.
41. True or False: Referring to Scenario 12-5, the decision made suggests that the 4 procedures do
not all have the same proportion of clear operations.
42. Referring to Scenario 12-5, what is the value of the critical range for the Marascuilo procedure
to test for the difference in proportions between procedure A and procedure B using a 0.05 level
of significance?
Chi-Square and Nonparametric Tests 12-11
43. True or False: Referring to Scenario 12-5, there is sufficient evidence to conclude that the
proportions between procedure A and procedure B are different at a 0.05 level of significance.
44. Referring to Scenario 12-5, what is the value of the critical range for the Marascuilo procedure
to test for the difference in proportions between procedure A and procedure C using a 0.05 level
of significance?
ANSWER:
45. True or False: Referring to Scenario 12-5, there is sufficient evidence to conclude that the
proportions between procedure A and procedure C are different at a 0.05 level of significance.
46. Referring to Scenario 12-5, what is the value of the critical range for the Marascuilo procedure
to test for the difference in proportions between procedure A and procedure D using a 0.05 level
of significance?
critical value
47. True or False: Referring to Scenario 12-5, there is sufficient evidence to conclude that the
proportions between procedure A and procedure D are different at a 0.05 level of significance.
12-12 Chi-Square and Nonparametric Tests
48. Referring to Scenario 12-5, what is the value of the critical range for the Marascuilo procedure
to test for the difference in proportions between procedure B and procedure C using a 0.05 level
of significance?
49. True or False: Referring to Scenario 12-5, there is sufficient evidence to conclude that the
proportions between procedure B and procedure C are different at a 0.05 level of significance.
50. Referring to Scenario 12-5, what is the value of the critical range for the Marascuilo procedure
to test for the difference in proportions between procedure B and procedure D using a 0.05 level
of significance?
51. True or False: Referring to Scenario 12-5, there is sufficient evidence to conclude that the
proportions between procedure B and procedure D are different at a 0.05 level of significance.
52. Referring to Scenario 12-5, what is the value of the critical range for the Marascuilo procedure
to test for the difference in proportions between procedure C and procedure D using a 0.05 level
of significance?
Chi-Square and Nonparametric Tests 12-13
53. True or False: Referring to Scenario 12-5, there is sufficient evidence to conclude that the
proportions between procedure C and procedure D are different at a 0.05 level of significance.
Scenario 12-6
According to an article in Marketing News, fewer checks are being written at the grocery store
checkout than in the past. To determine whether there is a difference in the proportion of shoppers
who pay by check among three consecutive years at a 0.05 level of significance, the results of a
survey of 500 shoppers in three consecutive years are obtained and presented below.
Year
Check Written
Year 1
Year 2
Year 3
Yes
225
175
125
No
275
325
375
54. Referring to Scenario 12-6, what is the expected number of shoppers who pay by check in year
1 if there is no difference in the proportion of shoppers who pay by check among the three years?
55. Referring to Scenario 12-6, what is the expected number of shoppers who do not pay by check
in year 3 if there is no difference in the proportion of shoppers who pay by check among the
three years?
56. Referring to Scenario 12-6, what is the form of the null hypothesis?
a)
0 1 2 3
:H
b)
0 1 2 3
:H
c)
0 1 2 3
:H
d)
0 1 2 3
:H
12-14 Chi-Square and Nonparametric Tests
57. Referring to Scenario 12-6, what is the form of the alternative hypothesis?
a)
1 1 2 3
:H
b)
1 1 2 3
:H
c)
1 1 2 3
:H
d)
1:H
not all
j
are the same
58. True or False: Referring to Scenario 12-6, the assumptions needed to perform the test are
satisfied.
59. Referring to Scenario 12-6, what are the degrees of freedom of the test statistic?
60. Referring to Scenario 12-6, what is the value of the test statistic?
61. Referring to Scenario 12-6, what is the critical value?
62. Referring to Scenario 12-6, what is the p–value of the test statistic?
Chi-Square and Nonparametric Tests 12-15
63. True or False: Referring to Scenario 12-6, the null hypothesis cannot be rejected.
64. Referring to Scenario 12-6, what is the correct conclusion?
a) There is enough evidence that the proportions are all different in the 3 years.
b) There is not enough evidence that the proportions are all different in the 3 years.
c) There is enough evidence that at least two of the proportions are not equal.
d) There is not enough evidence that at least two of the proportions are not equal.
65. Referring to Scenario 12-6, what is the value of the critical range for the Marascuilo procedure
to test for the difference in proportions between year 1 and year 2 using a 0.05 level of
significance?
ANSWER:
0.0754
TYPE: PR DIFFICULTY: Difficult
KEYWORDS: Chi-square test for difference in more than two proportions, Marascuilo procedure,
critical value
66. Referring to Scenario 12-6, what is the value of the critical range for the Marascuilo procedure
to test for the difference in proportions between year 1 and year 3 using a 0.05 level of
significance?
67. Referring to Scenario 12-6, what is the value of the critical range for the Marascuilo procedure
to test for the difference in proportions between year 2 and year 3 using a 0.05 level of
significance?
12-16 Chi-Square and Nonparametric Tests
68. True or False: Referring to Scenario 12-6, there is sufficient evidence to conclude that the
proportions between year 1 and year 2 are different at a 0.05 level of significance.
69. True or False: Referring to Scenario 12-6, there is insufficient evidence to conclude that the
proportions between year 1 and year 3 are different at a 0.05 level of significance.
70. True or False: Referring to Scenario 12-6, there is sufficient evidence to conclude that the
proportions between year 2 and year 3 are different at a 0.05 level of significance.
SCENARIO 12-7
Data on the percentage of 200 hotels in each of the three large cities across the world on whether
minibar charges are correctly posted at checkout are given below.
Hong Kong
New York
Paris
Yes
86%
76%
78%
No
14%
24%
22%
At the 0.05 level of significance, you want to know if there is evidence of a difference in the
proportion of hotels that correctly post minibar charges among the three cities.
71. Referring to Scenario 12-7, the test will involve _________ degrees of freedom.
Chi-Square and Nonparametric Tests 12-17
72. Referring to Scenario 12-7, the expected cell frequency for the Hong Kong/Yes cell is
__________.
73. Referring to Scenario 12-7, the expected cell frequency for the Paris/No cell is __________.
74. Referring to Scenario 12-7, the critical value of the test is ________.
75. Referring to Scenario 12-7, the value of the test statistic is _________.
76. True or False: Referring to Scenario 12-7, the null hypothesis will be rejected.
77. True or False: Referring to Scenario 12-7, the decision made suggests that the 3 cities all have
different proportions of hotels that correctly post minibar charges.
12-18 Chi-Square and Nonparametric Tests
78. True or False: Referring to Scenario 12-7, the decision made suggests that the 3 cities do not all
have the same proportion of hotels that correctly post minibar charges.
79. Referring to Scenario 12-7, what are the values of the absolute difference and the critical range
for the Marascuilo procedure to test for the difference in proportions between Hong Kong and
New York using a 0.05 level of significance?
80. True or False: Referring to Scenario 12-7, there is sufficient evidence to conclude that the
proportions between Hong Kong and New York are different at a 0.05 level of significance.
81. Referring to Scenario 12-7, what are the values of the absolute difference and the critical range
for the Marascuilo procedure to test for the difference in proportions between Hong Kong and
Paris using a 0.05 level of significance?
82. True or False: Referring to Scenario 12-7, there is sufficient evidence to conclude that the
proportions between Hong Kong and Paris are different at a 0.05 level of significance.
Chi-Square and Nonparametric Tests 12-19
83. Referring to Scenario 12-7, what are the values of the absolute difference and the critical range
for the Marascuilo procedure to test for the difference in proportions between New York and
Paris using a 0.05 level of significance?
84. True or False: Referring to Scenario 12-7, there is sufficient evidence to conclude that the
proportions between New York and Paris are different at a 0.05 level of significance.
85. True or False: When using the
2
tests for independence, you should be aware that expected
frequencies that are too small will lead to a large Type I error.
86. True or False: If we use the chi-square method of analysis to test for the difference between
proportions, we must assume that there are at least 5 observed frequencies in each cell of the
contingency table.
87. When testing for independence in a contingency table with 3 rows and 4 columns, there are
________ degrees of freedom.
a) 5
b) 6
c) 7
d) 12
12-20 Chi-Square and Nonparametric Tests
SCENARIO 12-8
A study was conducted to determine whether the use of seat belts in motor vehicles depends on the
educational status of the parents. A sample of 792 children treated for injuries sustained from motor
vehicle accidents was obtained, and each child was classified according to (1) parents’ educational
status (College Degree or Non-College Degree) and (2) seat belt usage (worn or not worn) during the
accident. The number of children in each category is given in the table below.
Non-College
Degree
College
Degree
Seat belts not worn
31
148
Seat belts worn
283
330
88. Referring to Scenario 12-8, which test would be used to properly analyze the data in this
experiment?
a)
2
test for independence
b)
2
test for differences among more than two proportions
c) Wilcoxon rank sum test for independent populations
d) Kruskal-Wallis rank test
89. Referring to Scenario 12-8, the calculated test statistic is
a) -0.9991
b) -0.1368
c) 48.1849
d) 72.8063
90. Referring to Scenario 12-8, at 5% level of significance, the critical value of the test statistic is
a) 3.8415
b) 5.9914
c) 9.4877
d) 13.2767
Chi-Square and Nonparametric Tests 12-21
91. Referring to Scenario 12-8, at 5% level of significance, there is sufficient evidence to conclude
that a) use of seat belts in motor vehicles is related to the educational status of the parents.
b) use of seat belts in motor vehicles depends on the educational status of the parents.
c) use of seat belts in motor vehicles is associated with the educational status of the parents.
d) All of the above.
SCENARIO 12-9
Many companies use well-known celebrities as spokespersons in their TV advertisements. A study
was conducted to determine whether brand awareness of female TV viewers and the gender of the
spokesperson are independent. Each in a sample of 300 female TV viewers was asked to identify a
product advertised by a celebrity spokesperson. The gender of the spokesperson and whether or not
the viewer could identify the product was recorded. The numbers in each category are given below.
Male Celebrity
Female Celebrity
Identified product
41
61
Could not identify
109
89
92. Referring to Scenario 12-9, which test would be used to properly analyze the data in this
experiment?
a)
2
test for independence
b)
2
test for differences among more than two proportions
c) Wilcoxon rank sum test for independent populations
d) Kruskal-Wallis rank test
93. Referring to Scenario 12-9, the calculated test statistic is
a) -0.1006
b) 0.00
c) 5.9418
d) 6.1194
12-22 Chi-Square and Nonparametric Tests
94. Referring to Scenario 12-9, at 5% level of significance, the critical value of the test statistic is
a) 3.8415
b) 5.9914
c) 9.4877
d) 13.2767
95. Referring to Scenario 12-9, the degrees of freedom of the test statistic are
a) 1
b) 2
c) 4
d) 299
96. Referring to Scenario 12-9, at 5% level of significance, the conclusion is that
a) brand awareness of female TV viewers and the gender of the spokesperson are
independent.
b) brand awareness of female TV viewers and the gender of the spokesperson are not
independent.
c) brand awareness of female TV viewers and the gender of the spokesperson are related.
d) Both (b) and (c).
Chi-Square and Nonparametric Tests 12-23
SCENARIO 12-10
One criterion used to evaluate employees in the assembly section of a large factory is the number of
defective pieces per 1,000 parts produced. The quality control department wants to find out whether
there is a relationship between years of experience and defect rate. Since the job is repetitious, after
the initial training period any improvement due to a learning effect might be offset by a loss of
motivation. A defect rate is calculated for each worker in a yearly evaluation. The results for 100
workers are given in the table below.
Years Since Training Period
< 1 Year
1 – 4 Years
5 – 9 Years
High
6
9
9
Defect Rate:
Average
9
19
23
Low
7
8
10
97. Referring to Scenario 12-10, which test would be used to properly analyze the data in this
experiment to determine whether there is a relationship between defect rate and years of
experience?
a)
2
test for independence
b)
2
test for differences among more than two proportions
c) Wilcoxon rank sum test for independent populations
d) Kruskal-Wallis rank test
98. Referring to Scenario 12-10, find the rejection region necessary for testing at the 0.05 level of
significance whether there is a relationship between defect rate and years of experience.
a) Reject H0 if
2
> 16.919
b) Reject H0 if
2
> 15.507
c) Reject H0 if
2
> 11.143
d) Reject H0 if
2
> 9.488
12-24 Chi-Square and Nonparametric Tests
99. Referring to Scenario 12-10, what is the expected number of employees with less than 1 year of
training time and a high defect rate?
a) 4.17
b) 4.60
c) 5.28
d) 9.17
100. Referring to Scenario 12-10, what is the expected number of employees with 1 to 4 years of
training time and a high defect rate?
a) 12.00
b) 8.64
c) 6.67
d) 6.00
101. Referring to Scenario 12-10, for the cell with 1 to 4 years of training time and a high defect
rate, what is the contribution to the overall
2
statistic for the independence test?
a) 0.36
b) 0.1296
c) 0.015
d) 0.0144
102. Referring to Scenario 12-10, a test was conducted to determine if a relationship exists between
defect rate and years of experience. Which of the following p-values would indicate that defect
rate and years of experience are dependent? Assume you are testing at
= 0.05.
a) 0.045
b) 0.055
c) 0.074
d) 0.080
Chi-Square and Nonparametric Tests 12-25
SCENARIO 12-11
The director of admissions at a state college is interested in seeing if admissions status (admitted,
waiting list, denied admission) at his college is independent of the type of community in which an
applicant resides. He takes a sample of recent admissions decisions and forms the following table:
Admitted
Wait List
Denied
Total
Urban
45
21
17
83
Rural
33
13
24
70
Suburban
34
12
39
85
Total
112
46
80
238
He will use this table to do a chi-square test of independence with a level of significance of 0.01.
103. Referring to Scenario 12-11, the test will involve _________ degrees of freedom.
104. Referring to Scenario 12-11, the critical value of the test is _________.
105. Referring to Scenario 12-11, the expected cell frequency for the Admitted/Urban cell is
_________.
106. Referring to Scenario 12-11, the value of the test statistic is _________.
107. True or False: Referring to Scenario 12-11, the null hypothesis will be rejected.
12-26 Chi-Square and Nonparametric Tests
108. True or False: Referring to Scenario 12-11, the p-value of this test is greater than 0.01.
109. True or False: Referring to Scenario 12-11, the decision made suggests that admissions status
at the college is independent of the type of community in which an applicant resides.
110. True or False: Referring to Scenario 12-11, the same decision would be made with this test if
the level of significance had been 0.005.
111. True or False: Referring to Scenario 12-11, the same decision would be made with this test if
the level of significance had been 0.05.
112. True or False: Referring to Scenario 12-11, the null hypothesis claims that “there is no
association between admission status at the college and the type of community in which an
applicant resides.”
113. True or False: Referring to Scenario 12-11, the alternative hypothesis claims that “there is
some connection between admission status at the college and the type of community in which an
applicant resides.”
Chi-Square and Nonparametric Tests 12-27
114. True or False: The chi-square test of independence requires that the expected frequency in each
cell to be at least 5.
115. True or False: The chi-square test of independence requires that the expected frequency in each
cell to be at least 1.
SCENARIO 12-12
Parents complain that children read too few storybooks and watch too much television nowadays. A
survey of 1,000 children reveals the following information on average time spent watching TV and
average time spent reading storybooks
Average time spent reading story books
Average time
spent watching
TV
Less than 1 hour
Between 1and 2
hours
More than 2 hours
Less than 2 hours
90
85
130
More than 2 hours
655
32
8
116. Referring to Scenario 12-12, how many children in the survey spent less than 2 hours watching
TV and more than 2 hours reading story books on average?
a) 8
b) 130
c) 175
d) 687
12-28 Chi-Square and Nonparametric Tests
117. Referring to Scenario 12-12, how many children in the survey spent less than 2 hours watching
TV and no more than 2 hours reading storybooks on average?
a) 8
b) 130
c) 175
d) 687
118. Referring to Scenario 12-12, if the null hypothesis of no connection between time spent
watching TV and time spent reading story books is true, how many children watching less than 2
hours of TV and reading no more than 2 hours of story books on average can we expect?
a) 35.69
b) 227.23
c) 262.91
d) 969.75
119. Referring to Scenario 12-12, if the null hypothesis of no connection between time spent
watching TV and time spent reading story books is true, how many children watching less than 2
hours of TV and reading more than 2 hours of story books on average can we expect?
a) 42.09
b) 155.25
c) 262.92
d) 987.75
120. Referring to Scenario 12-12, to test whether there is any relationship between average time
spent watching TV and average time spent reading story books, the value of the measured test
statistic is
a) -12.59
b) 1.61
c) 481.49
d) 1,368.06
Chi-Square and Nonparametric Tests 12-29
121. Referring to Scenario 12-12, suppose we want to constrain the probability of committing a
Type I error to 5% when testing whether there is any relationship between average time spent
watching TV and average time spent reading story books, the critical value will be
a) 5.991
b) 7.378
c) 12.592
d) 14.449
122. Referring to Scenario 12-12, we want to test whether there is any relationship between average
time spent watching TV and average time spent reading storybooks. Suppose the value of the
test statistic was 164 (which is not the correct answer) and the critical value was 19.00 (which is
not the correct answer), then we could conclude that
a) There is a connection between time spent reading storybooks and time spent watching
TV.
b) There is no connection between time spent reading storybooks and time spent watching
TV.
c) More time spent reading storybooks leads to less time spent watching TV.
d) More time spent watching TV leads to less time spent reading storybooks.
SCENARIO 12-13
Recent studies have found that American children are more obese than in the past. The amount of
time children spent watching television has received much of the blame. A survey of 100 ten-year-
olds revealed the following with regards to weights and average number of hours a day spent
watching television. We are interested in testing whether the mean number of hours spent watching
TV and weights are independent at 1% level of significance.
Weights
TV Hours
Total
0-3
3-6
6+
More than 10 lbs. overweight
1
9
20
30
Within 10 lbs. of normal weight
20
15
15
50
More than 10 lbs. underweight
10
5
5
20
Total
31
29
40
100
12-30 Chi-Square and Nonparametric Tests
123. Referring to Scenario 12-13, if there is no connection between weights and average number of
hours spent watching TV, we should expect how many children to be spending 3-6 hours on
average watching TV and are more than 10 lbs. underweight?
a) 5
b) 5.8
c) 6.2
d) 8
124. Referring to Scenario 12-13, if there is no connection between weights and average number of
hours spent watching TV, we should expect how many children to be spending no more than 6
hours on average watching TV and are more than 10 lbs. underweight?
a) 5.8
b) 6.2
c) 8
d) 12
125. Referring to Scenario 12-13, how many children in the survey spend more than 6 hours
watching TV and are more than 10 lbs. overweight?
a) 1
b) 9
c) 20
d) 40
126. Referring to Scenario 12-13, how many children in the survey spend no more than 6 hours
watching TV and are more than 10 lbs. underweight?
a) 5
b) 10
c) 15
d) 20
Chi-Square and Nonparametric Tests 12-31
127. Referring to Scenario 12-13, the value of the test statistic is
a) 8.532
b) 15.483
c) 18.889
d) 69.744
128. Referring to Scenario 12-13, the critical value of the test will be
a) 6.635
b) 13.277
c) 14.860
d) 21.666
129. Referring to Scenario 12-13, suppose the value of the test statistic was 30.00 (which is not the
correct value) and the critical value at 1% level of significance was 10.00 (which is not the
correct value), which of the following conclusions would be correct?
a) We will not reject the null and conclude that mean number of hours spent watching TV
and weights are independent.
b) We will reject the null and conclude that mean number of hours spent watching TV and
weights are independent.
c) We will not reject the null and conclude that mean number of hours spent watching TV
and weights are not independent.
d) We will reject the null and conclude that mean number of hours spent watching TV and
weights are not independent.
130. Referring to Scenario 12-13, which of the following statements is correct?
a) We cannot reject the null for any level of significance greater than 0.005
b) We can reject the null for any level of significance greater than 0.005.
c) We cannot reject the null for any level of significance smaller than 0.005
d) We can reject the null for any level of significance smaller than 0.005.
12-32 Chi-Square and Nonparametric Tests
131. Referring to Scenario 12-13, the degrees of freedom of the test statistic are
a) 1
b) 2
c) 4
d) 9
132. True or False: Referring to Scenario 12-13, the test is always a one-tail test.
133. In testing for differences between the median of two independent populations, the null
hypothesis is
a)
0: 0
D
HM
.
b)
0: 0
D
HM
.
c)
0 1 2
: 0H M M
.
d)
0 1 2
: 0H M M
.
134. To use the Wilcoxon Rank Sum Test as a test for location, you must assume that
a) the obtained data are either ranks or numerical measurements that will be converted to
combined ranks.
b) both samples are randomly and independently drawn from their respective populations.
c) both underlying populations from which the samples were drawn are equivalent in shape
and dispersion.
d) All the above.
Chi-Square and Nonparametric Tests 12-33
135. Which of the following is a “robust” test procedure against the violation of distribution
assumptions?
a)
2
-test of independence.
b) McNemar test for the difference between two proportions
c)
2
-test for the differences among more than two proportions
d) Wilcoxon rank sum test for difference in medians
136. A local real estate appraiser analyzed the sales prices of homes in 2 neighborhoods to the
corresponding appraised values of the homes. The goal of the analysis was to compare the
distribution of sale-to-appraised ratios from homes in the 2 neighborhoods. Random and
independent samples were selected from the 2 neighborhoods from last year’s homes sales, 8
from each of the 2 neighborhoods. Identify the nonparametric method that would be used to
analyze the data.
a)
2
-test for the differences between two proportions
b)
2
-test for the differences among more than two proportions
c)
2
-test for independence
d) the Wilcoxon Rank Sum Test, using the test statistic T1
137. True or False: The procedure for the Wilcoxon rank sum test requires that you rank each group
separately rather than together.
12-34 Chi-Square and Nonparametric Tests
SCENARIO 12-14
A perfume manufacturer is trying to choose between 2 magazine advertising layouts. An expensive
layout would include a small package of the perfume. A cheaper layout would include a “scratch–
and-sniff” sample of the product. The manufacturer would use the more expensive layout only if
there is evidence that it would lead to a higher approval rate. The manufacturer presents the more
expensive layout to 4 groups and determines the approval rating for each group. He presents the
“scratch-and-sniff” layout to 5 groups and again determines the approval rating of the perfume for
each group. The data are given below. Use this to test the appropriate hypotheses with the Wilcoxon
Rank Sum Test with a level of significance of 0.05.
Package Scratch
52 37
68 43
43 53
48 39
47
138. Referring to Scenario 12-14, the hypotheses that should be used are:
a)
H0:
1
2 versus H1:
1
2
b)
H0:
1
2 versus H1:
1
2
c)
H0:M1M2 versus H1:M1M2
d)
H0:M1M2 versus H1:M1M2
139. Referring to Scenario 12-14, the rank given to the last observation in the “scratch-and-sniff”
group is ________.
140. Referring to Scenario 12-14, the rank given to the second observation in the “scratch-and-sniff”
group is ________.
Chi-Square and Nonparametric Tests 12-35
141. Referring to Scenario 12-14, the calculated value of the test statistic is ________.
142. Referring to Scenario 12-14, the critical value of the test is ________.
143. True or False: Referring to Scenario 12-14, the null hypothesis should be rejected.
144. Referring to Scenario 12-14, the perfume manufacturer will
a) use the “scratch-and-sniff” layout because there is insufficient evidence to do otherwise.
b) use the package layout because there is insufficient evidence to do otherwise.
c) use the “scratch-and-sniff” layout because there is sufficient evidence to conclude that
this is the best course of action.
d) use the package layout because there is sufficient evidence to conclude that this is the
best course of action.
12-36 Chi-Square and Nonparametric Tests
SCENARIO 12-15
Two new different models of compact SUVs have just arrived at the market. You are interested in
comparing the gas mileage performance of both models to see if they are the same. A partial
computer output for twelve compact SUVs of model 1 and thirteen of model 2 is given below:
Data
Level of Significance
0.05
Population 1 Sample
Sample Size
12
Sum of Ranks
192.5
Population 2 Sample
Sample Size
13
Sum of Ranks
132.5
Intermediate Calculations
Total Sample Size n
25
You are told that the gas mileage population distributions for both models are not normally
distributed.
145. Referring to Scenario 12-15, what should be the null and alternative hypotheses of the test?
a)
0 1 2
:H M M
vs.
1 1 2
:H M M
b)
0 1 2
:H M M
vs.
1 1 2
:H M M
c)
0 1 2
:H M M
vs.
1 1 2
:H M M
d)
0 1 2
:H M M
vs.
1 1 2
:H M M
146. Referring to Scenario 12-15, what is the value of the Wilcoxon rank sum test statistic
1
T
?
147. Referring to Scenario 12-15, what is the mean of the Wilcoxon rank sum test statistic
1
T
?
Chi-Square and Nonparametric Tests 12-37
148. Referring to Scenario 12-15, what is the standard deviation of the Wilcoxon rank sum test
statistic
1
T
?
149. Referring to Scenario 12-15, what is the value of the Z test statistic?
150. Referring to Scenario 12-15, what is(are) the critical value(s) using a 5% level of significance?
151. Referring to Scenario 12-15, what is the p-value of the test statistic?
152. Referring to Scenario 12-15, what is your decision on the test using a 5% level of significance?
153. Referring to Scenario 12-15, what is your conclusion on the test using a 5% level of
significance?
a) There is not enough evidence of a difference in median gas mileage.
b) There is evidence of a difference in median gas mileage.
c) There is not enough evidence of a difference in mean gas mileage.
d) There is evidence of a difference in mean gas mileage.
12-38 Chi-Square and Nonparametric Tests
154. If the assumptions of the one-way ANOVA F test are not met, which of the following tests
could be used?
a)
2
test for difference among more than two proportions
b) Kruskal-Wallis test
c) Marascuilo procedure
d) None of the above
155. The Kruskal-Wallis test is an extension of which of the following for two independent
samples?
a) Pooled-variance t test
b) Paired-sample t test
c) Wilcoxon rank sum test
d) McNemar test
156. True or False: If the sample sizes in each group is larger than 5, the Kruskal-Wallis rank test
statistic can be approximated by a standardized normal distribution.
157. True or False: If the sample sizes in each group is larger than 5, the Kruskal-Wallis rank test
statistic can be approximated by a chi-square distribution.
158. True or False: When the parametric assumption on the distribution is met, a parametric test is
usually more powerful than a nonparametric test.
Chi-Square and Nonparametric Tests 12-39
159. Suppose there is interest in comparing the median response time for three independent groups
learning a specific task. The appropriate nonparametric procedure is
a) Wilcoxon Rank Sums Test.
b)
2
test for the different among more than two proportions.
c) Kruskal-Wallis Rank Test.
d)
2
test for independence.
160. The Kruskal-Wallis Rank Test for differences in more than two medians is a nonparametric
alternative to
a) ANOVA F test for completely randomized experiments.
b) Student’s t test for related samples.
c) Student’s t test for independent samples.
d) Wilcoxon’s Rank Sum Test for differences in two medians.
161. The Journal of Business Venturing reported on the activities of entrepreneurs during the
organization creation process. As part of a designed study, a total of 71 entrepreneurs were
interviewed and divided into 3 groups: those that were successful in founding a new firm (n1 =
34), those still actively trying to establish a firm (n2 = 21), and those who tried to start a new firm
but eventually gave up (n3 = 16). The total number of activities undertaken (e.g., developed a
business plan, sought funding, looked for facilities) by each group over a specified time period
during organization creation was measured. The objective is to compare the mean number of
activities of the 3 groups of entrepreneurs. Because of concerns over necessary assumption of the
parametric analysis, it was decided to use a nonparametric analysis. Identify the nonparametric
method that would be used to analyze the data.
a) Wilcoxon Rank Sum Test
b)
2
test for independence
c) Kruskal-Wallis Rank Test
d) One-way ANOVA F test
12-40 Chi-Square and Nonparametric Tests
SCENARIO 12-16
As part of an evaluation program, a sporting goods retailer wanted to compare the downhill coasting
speeds of 4 brands of bicycles. She took 3 of each brand and determined their maximum downhill
speeds. The results are presented in miles per hour in the table below.
Trial Barth Tornado Reiser Shaw
1 43 37 41 43
2 46 38 45 45
3 43 39 42 46
162. Referring to Scenario 12-16, the sporting goods retailer decided to perform a Kruskal-Wallis
test even though the sample size in each of the 4 groups is not larger than 5. The null hypothesis
of the test is ________.
163. Referring to Scenario 12-16, the alternative hypothesis of the Kruskal-Wallis test is that
________.
164. Referring to Scenario 12-16, to use the chi-square critical value for the Kruskal-Wallis test, the
sample size in each group has to be greater than _____.
165. Referring to Scenario 12-16, the decision rule for a level of significance of 0.05 using the
Kruskal-Wallis test is to reject the null hypothesis if the test statistic H is ________ assuming
that the sample sizes were large enough to use a chi-square approximation.
Chi-Square and Nonparametric Tests 12-41
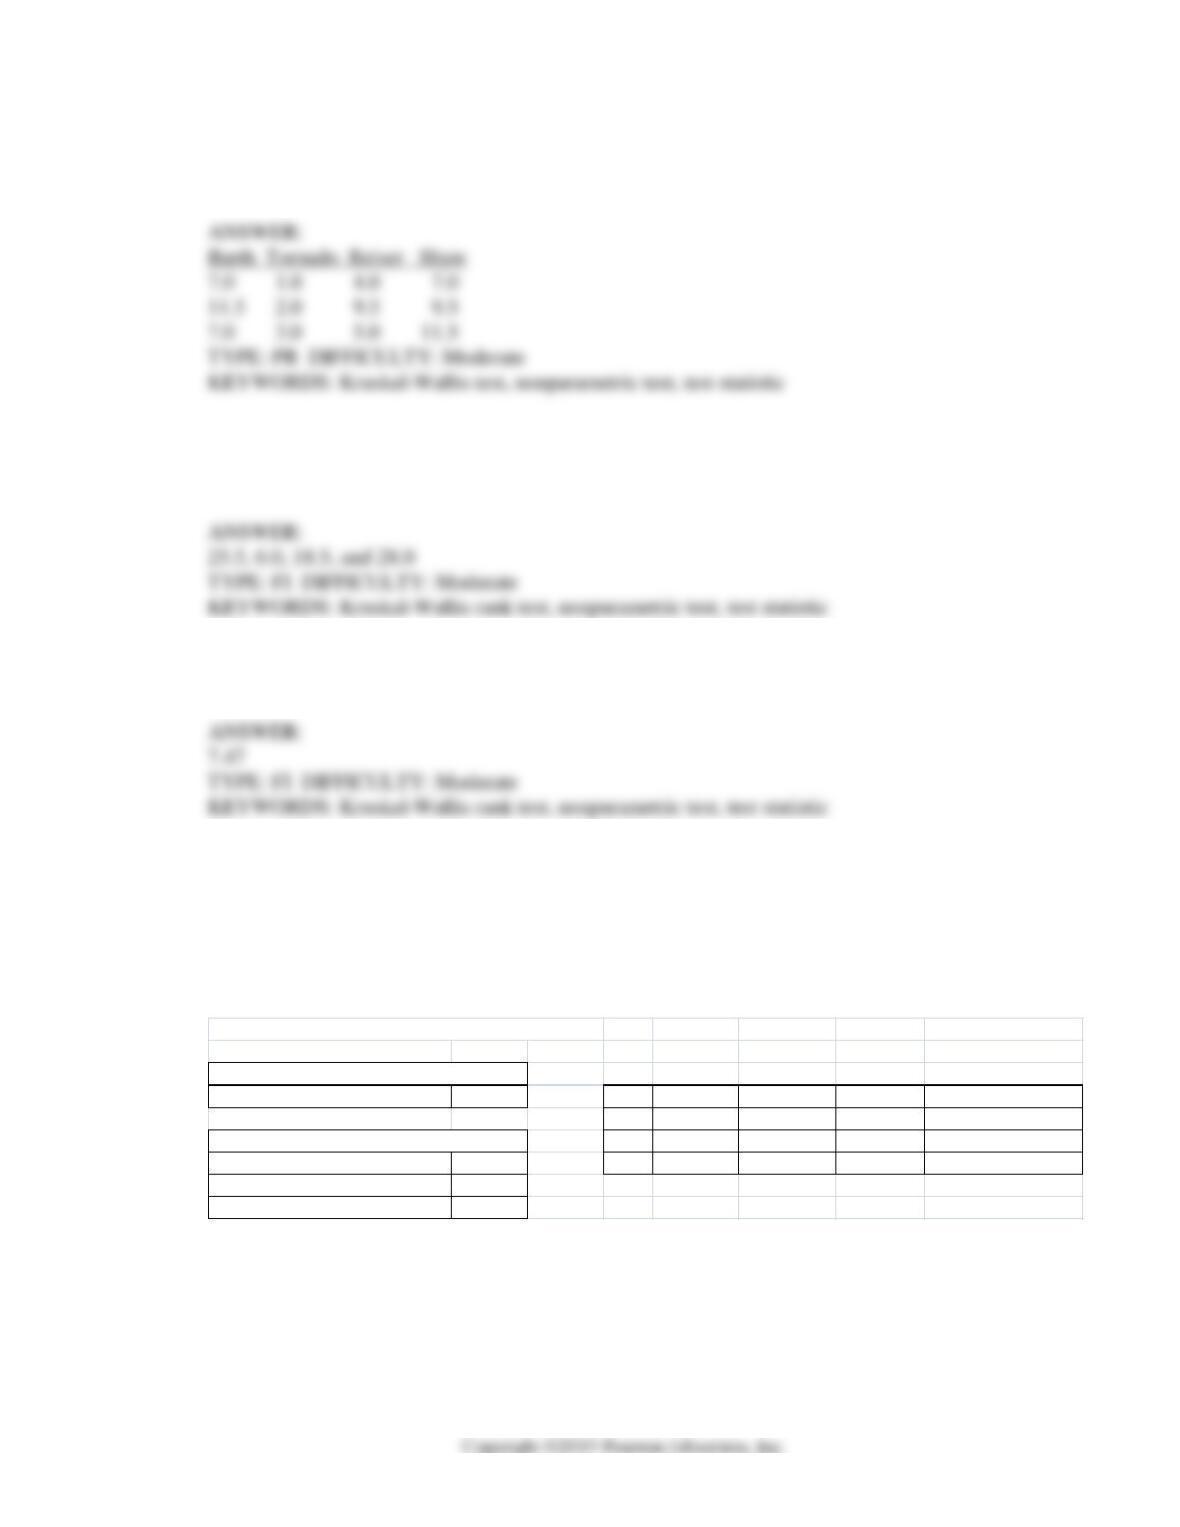
166. Referring to Scenario 12-16, the calculation of the Kruskal-Wallis test statistic H involves
ranking the observations. Construct a table containing these ranks.
ANSWER:
167. Referring to Scenario 12-16, the calculation of the Kruskal-Wallis test statistic H involves
obtaining the total of the ranks for each sample. These totals are ________, ________,
________, and ________.
168. Referring to Scenario 12-16, the calculated value of the Kruskal-Wallis test statistic H is
________.
ANSWER:
SCENARIO 12-17
Three new different models of compact SUVs have just arrived at the market. You are interested in
comparing the gas mileage performance of all three models to see if they are the same. A partial
computer output for twelve compact SUVs of each model is given below:
Kruskal-Wallis Rank Test for Differences in Medians
Level of Significance 0.05 Group Sample Size Sum of Ranks Mean Ranks Square of sum of ranks
112 185.5 15.458333 34410.25
212 114.5 9.5416667 13110.25
Sum of Squared Ranks/Sample Size 15123.04 3 12 366 30.5 133956
Sum of Sample Sizes 36
Number of Groups 3
Data
Intermediate Calculations
You are told that the gas mileage population distributions for all three models are not normally
distributed.
12-42 Chi-Square and Nonparametric Tests
169. Referring to Scenario 12-17, what should be the null and alternative hypotheses of the test?
a)
0 1 2 3
:H M M M
vs.
1 1 2 3
:H M M M
b)
0 1 2 3
:H M M M
vs.
1 1 2 3
:H M M M
c)
0 1 2 3
:H M M M
vs.
1 1 2 3
:H M M M
d)
0 1 2 3
:H M M M
vs.
1:H
Not all
j
M
are equal (where j = 1, 2, 3)
170. Referring to Scenario 12-17, what is the value of the Kruskal-Wallis test statistic?
171. Referring to Scenario 12-17, what are the degrees of freedom of the Kruskal-Wallis test
statistic?
172. Referring to Scenario 12-17, what is the critical value of the Kruskal-Wallis test statistic?
173. Referring to Scenario 12-17, what is the p-value of the Kruskal-Wallis test statistic?
174. Referring to Scenario 12-17, what is your decision on the test using a 5% level of significance?

Chi-Square and Nonparametric Tests 12-43
175. Referring to Scenario 12-17, what is your conclusion on the test using a 5% level of
significance?
a) There is not enough evidence of a difference in median gas mileage.
b) There is evidence of a difference in median gas mileage.
c) There is not enough evidence of a difference in mean gas mileage.
d) There is evidence of a difference in mean gas mileage.