
Business Analytics 17-1
CHAPTER 17: BUSINESS ANALYTICS
1. Which of the following disciplines is typically NOT involved in business analytics?
a) Economics
b) Statistics
c) Information system
d) Management science
2. Which of the following is NOT among the three broad categories of analytic methods?
a) Predictive analytics
b) Prescriptive analytics
c) Productive analytics
d) Descriptive analytics
3. Which of the following finds relationships in data that may not be readily apparent?
a) Predictive analytics
b) Prescriptive analytics
c) Productive analytics
d) Descriptive analytics
4. Which of the following investigates what should occur and suggest the best course of action
for the future?
a) Predictive analytics
b) Prescriptive analytics
c) Productive analytics
d) Descriptive analytics

17-2 Business Analytics
5. Which of the following explores business activities that have occurred or are occurring in the
present moment?
a) Predictive analytics
b) Prescriptive analytics
c) Productive analytics
d) Descriptive analytics
6. Dashboards may contain all but which of the following?
a) Contingency table
b) Sparklines
c) Gauges
d) Bullet graphs
7. Dashboards may contain all but which of the following?
a) Treemaps
b) Gauges
c) Contingency table
d) Bullet graphs
8. True or False: Most information design specialists prefer bullet graphs over gauges because bullet
graphs foster the direct comparison of each measurement.
9. True or False: Treemaps that use color to represent the value of a second variable, thereby
increasing the data density of the displays, is an example of chartjunk.

Business Analytics 17-3
10. True or False: Bullet graphs that use color to represent the value of a second variable, thereby
increasing the data density of the displays, is an example of chartjunk.
11. True or False: Some consider bullet graphs little more than examples of chartjunk, even as many
decision makers request them due to their visual appeal, due to the amount of the space they
consumes.
12. True or False: Some consider gauges little more than examples of chartjunk, even as many decision
makers request them due to their visual appeal, due to the amount of the space it consumes.
13. True or False: Double-clicking a cell in a PivotTable causes Excel to drill down and display the
underlying data in a new worksheet.
14. True or False: You can compute any of the numerical descriptive statistics for the variables of the
new worksheet that a drill-down in a PivotTable creates.
15. True or False: Some business analytics are performed by adding variables to see if unforeseen
relationships are uncovered.

17-4 Business Analytics
16. True or False: Some business analytics involve starting with many variables, followed by filtering
the data by exploring specific combinations of categorical values or numerical range.
17. True or False: Some business analytics involve starting with many variables, followed by filtering
the data by exploring specific combinations of categorical values or numerical range. In Excel, this
approach is mimicked by using a drill-down.
18. True or False: Some business analytics involve starting with many variables, followed by filtering
the data by exploring specific combinations of categorical values or numerical range. In Excel, this
approach is mimicked by using a slicer.
19. True or False: Some business analytics involve starting with many variables, followed by filtering
the data by exploring specific combinations of categorical values or numerical range. In Excel, this
approach is mimicked by using gauges.
20. True or False: In real-world business analytics, filtering is typically performed on large data based
on complex conditional relationships.
21. True or False: There is no significant difference between filtering performed in a complex real-
world business analytic and filtering performed using the slicers in a PivotTable in Excel.

Business Analytics 17-5
SCENARIO 17-1
The table below contains the sparklines for the rates of return (in percentage) for three different stocks
from 2007 to 2013.
Stock 2007 2008 2009 2010 2011 2012 2013
A15.9 36.9 –41.3 55.9 42.5 -21.1 18
B23.2 11.2 25.1 23.9 10.2 30.8 0.1
C20.5 42.6 –26.9 49.3 83.7 –9.8 21.5
Year
22. Referring to Scenario 17-1, the rates of return of stock ____ have the smallest variation among the
three.
23. Referring to Scenario 17-1, the pattern of the rates of return of stock ____ and stock ____ are similar.
24. True or False: Referring to Scenario 17-1, the sparklines enable you to draw conclusions on the
historical trend of the rates of return of the three stocks.
25. True or False: Referring to Scenario 17-1, the sparklines enable you to conclude that the rates of
return of the stock market in general is volatile from 2007 to 2013.
26. True or False: Referring to Scenario 17-1, the sparklines enable you to predict that the rates of
return of the stock market in 2014 will be higher than in 2013.
17-6 Business Analytics
27. True or False: Referring to Scenario 17-1, the sparklines enable you to predict that the rates of
return of the stock market in 2014 will be about the same as in 2013.
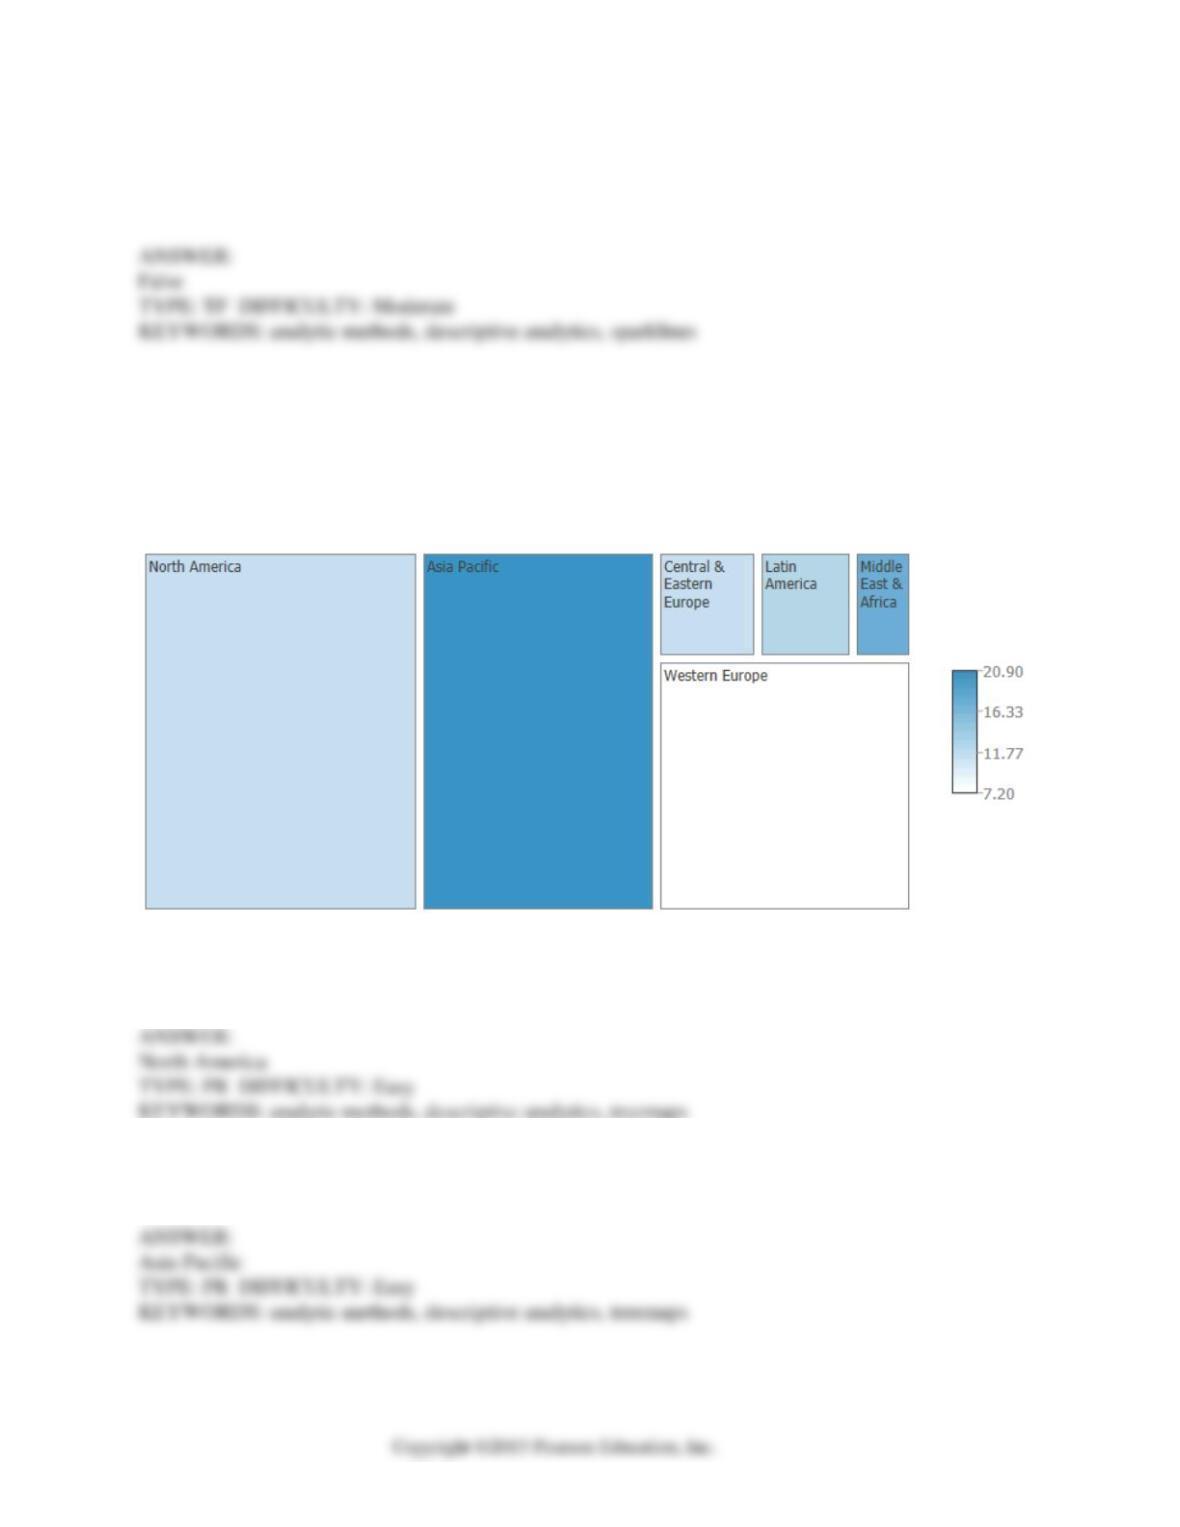
SCENARIO 17-2
The treemap below shows the amounts (size) measured in billions of US dollars and percentage
changes from prior year (color) of business–to–consumer ecommerce sales last year for North
America, Asia Pacific, Western Europe, Central & Eastern Europe, Latin America, and Middle East
& Africa.
28. Referring to Scenario 17-2, which region has the largest amount of business–to–consumer
ecommerce sales last year?
29. Referring to Scenario 17-2, which region has the fastest growth in business–to–consumer
ecommerce sales last year?

Business Analytics 17-7
30. Referring to Scenario 17-2, which region has the smallest amount of business–to–consumer
ecommerce sales last year?
31. Referring to Scenario 17-2, which region has the slowest growth in business-to-consumer
ecommerce sales last year?
32. True or False: Referring to Scenario 17-2, the Asia Pacific region has the largest amount of
business-to–consumer ecommerce sales last year.
33. True or False: Referring to Scenario 17-2, the Western Europe region has the largest amount of
business-to–consumer ecommerce sales last year.
34. True or False: Referring to Scenario 17-2, the Middle East & Africa region has the slowest
growth in business-to–consumer ecommerce sales last year.
35. True or False: Referring to Scenario 17-2, the North America region has the fastest growth in
business-to–consumer ecommerce sales last year.

17-8 Business Analytics
36. Which of the following is NOT one of the categories of predictive analytics methods?
a) Clustering
b) Recommendation
c) Association
d) Prediction
37. Which of the following is NOT one of the categories of predictive analytics methods?
a) Classification
b) Clustering
c) Association
d) Description
38. Which of the following is NOT among the predictive analytics methods covered in the book?
a) Principle component analysis
b) Neural networks
c) Cluster analysis
d) Multidimensional scaling
39. Which of the following is NOT among the predictive analytics methods covered in the book?
a) Neural networks
b) Simple component analysis
c) Cluster analysis
d) Multidimensional scaling

Business Analytics 17-9
40. Which of the following is NOT among the predictive analytics methods covered in the book?
a) Neural networks
b) Cluster analysis
c) Factor analysis
d) Multidimensional scaling
41. True or False: Data mining is used mostly in the mining industry.
42. True or False: Data mining uses various techniques to extract useful information from huge
depositories of data.
43. True or False: In a classification tree, the dependent variable is a categorical variable.
44. True or False: In a regression tree, the dependent variable is a categorical variable.
45. True or False: Successful implementation of a classification tree requires rules for splitting the
data at each node based on a dependent variable.

17-10 Business Analytics
46. True or False: Successful implementation of a regression tree requires rules for deciding when
a branch of the tree cannot be split any more.
47. True or False: Successful implementation of a regression tree requires a method to provide
prediction for the target variable at each of the nodes.
48. True or False: Successful use of a regression tree requires a precise description of the
parameters of the tree.
49. True or False: Successful implementation of a classification tree requires rules for splitting the
data at each node based on an independent variable.
50. True or False: Splitting of a node might be followed by pruning if necessary in a classification
tree.
51. True or False: Splitting is always followed by pruning in a classification tree.

Business Analytics 17-11
52. True or False: Classification tree is not sensitive to the distribution of the independent
variables.
53. True or False: The result of the regression tree is affected by the distribution of the
independent variables.
54. True or False: The Akaike information criteria (AIC) or the corrected Akaike information
criteria (AICc) can be used to compare alternative models chosen by the classification tree.
55. True or False: The Akaike information criteria (AIC) or the corrected Akaike information
criteria (AICc) is a measure of the probability that can be attributed to the response that has
occurred.
56. True or False: The LogWorth statistic is used to decide when to split a node of a regression
tree.
57. True or False: The LogWorth statistic is a measure of the probability that can be attributed to
the response that has occurred.
17-12 Business Analytics
58. True or False: The
2
G
statistic is a measure of the probability that can be attributed to the
response that has occurred.
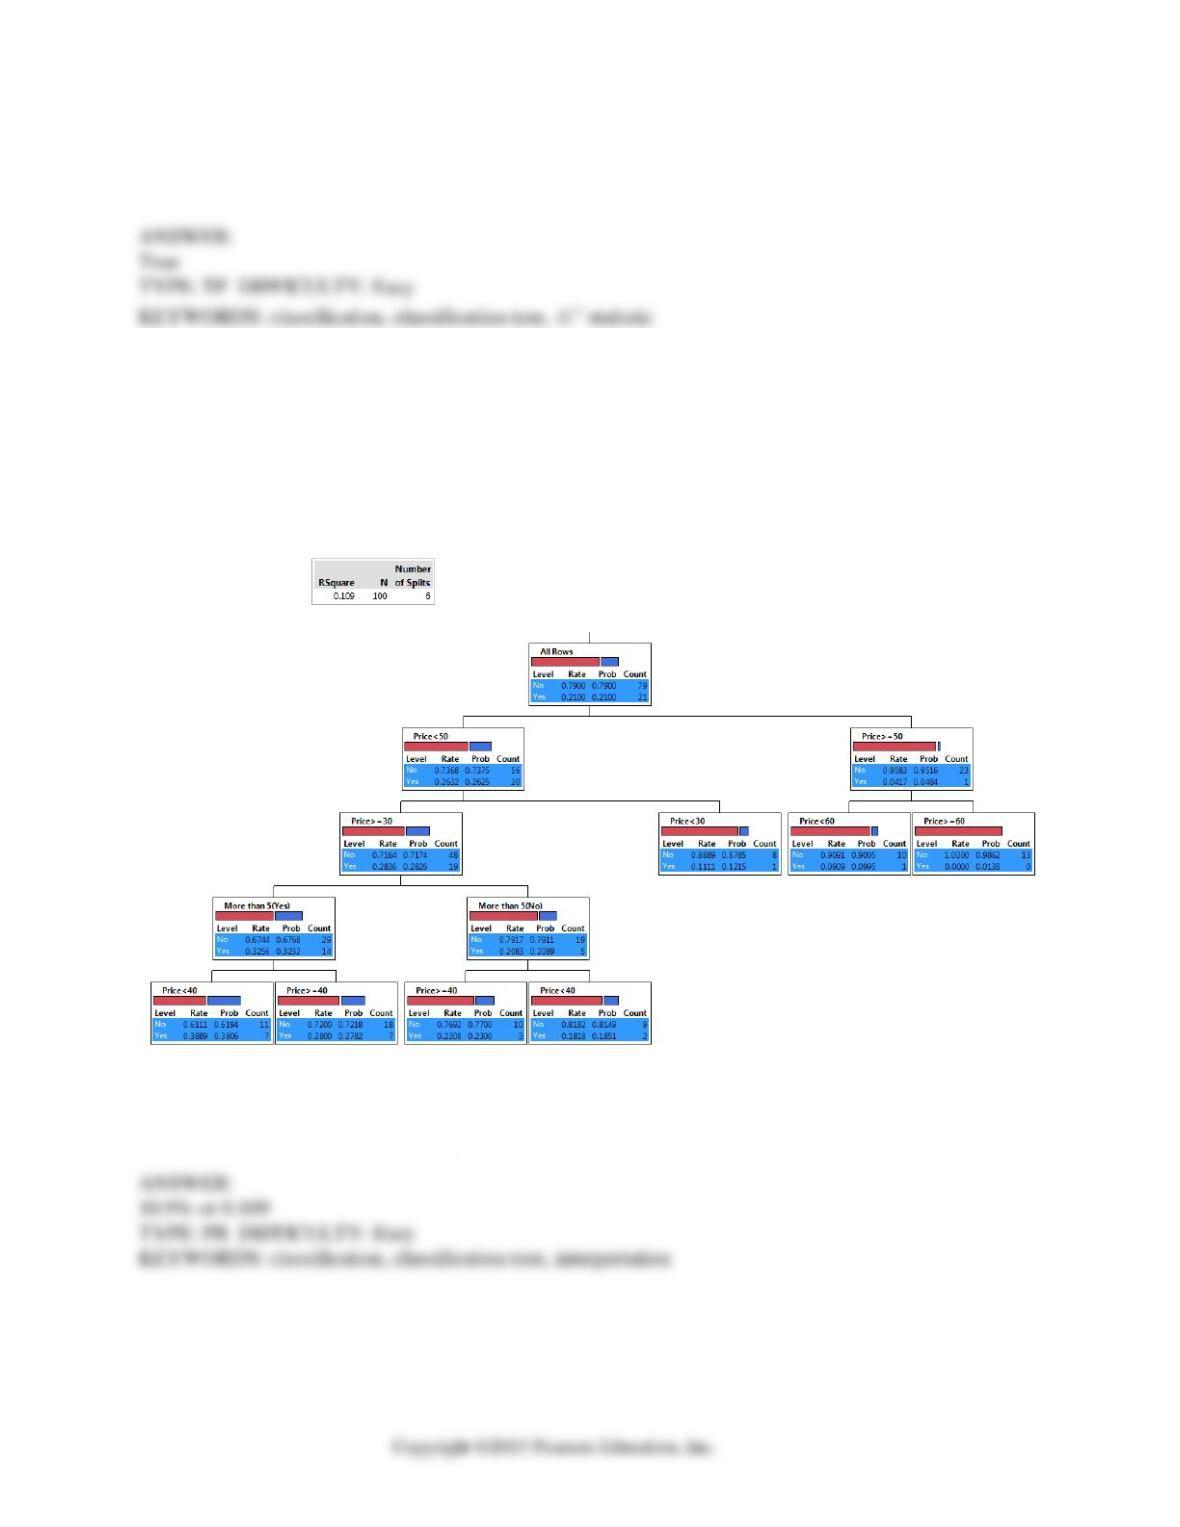
SCENARIO 17-3
The tree diagram below shows the results of the classification tree model that has been constructed to
predict the probability of a cable company’s customers who will switch (“Yes” or “No”) into its
bundled program offering based on the price ($30, $40, $50, $60) and whether the customer spends
more than 5 hours a day watching TV (“Yes” or “No”) using the data set of 100 customers collected
from a survey.
59. Referring to Scenario 17-3, what percentage of the variation in whether a customer will switch
into its bundled program offering can be explained by the price and whether the customer spends
more than 5 hours a day watching TV?

Business Analytics 17-13
60. Referring to Scenario 17-3, the first split occurs at what price?
61. Referring to Scenario 17-3, what is the highest rate of switching into the bundled offering?
62. Referring to Scenario 17-3, what is the lowest rate of switching into the bundled offering?
63. True or False: Referring to Scenario 17-3, the highest probability of switching is predicted to
occur among customers who watch more than 5 hours of TV a day and are offered the bundled
price of higher than $50.
64. True or False: Referring to Scenario 17-3, the highest probability of switching is predicted to
occur among customers who watch more than 5 hours of TV a day and are offered the bundled
price of between $30 and $40.
65. True or False: Referring to Scenario 17-3, the highest probability of switching is predicted to
occur among customers who watch more than 5 hours of TV a day and are offered the bundled
price of lower than $50.

17-14 Business Analytics
66. True or False: Referring to Scenario 17-3, the highest probability of switching is predicted to
occur among customers who watch more than 5 hours of TV a day and are offered the bundled
price of higher than $40.
67. True or False: Referring to Scenario 17-3, the highest probability of switching is predicted to
occur among customers who do not watch more than 5 hours of TV a day and are offered the
bundled price of higher than $50.
68. True or False: Referring to Scenario 17-3, the highest probability of switching is predicted to
occur among customers who do not watch more than 5 hours of TV a day and are offered the
bundled price of lower than $50.
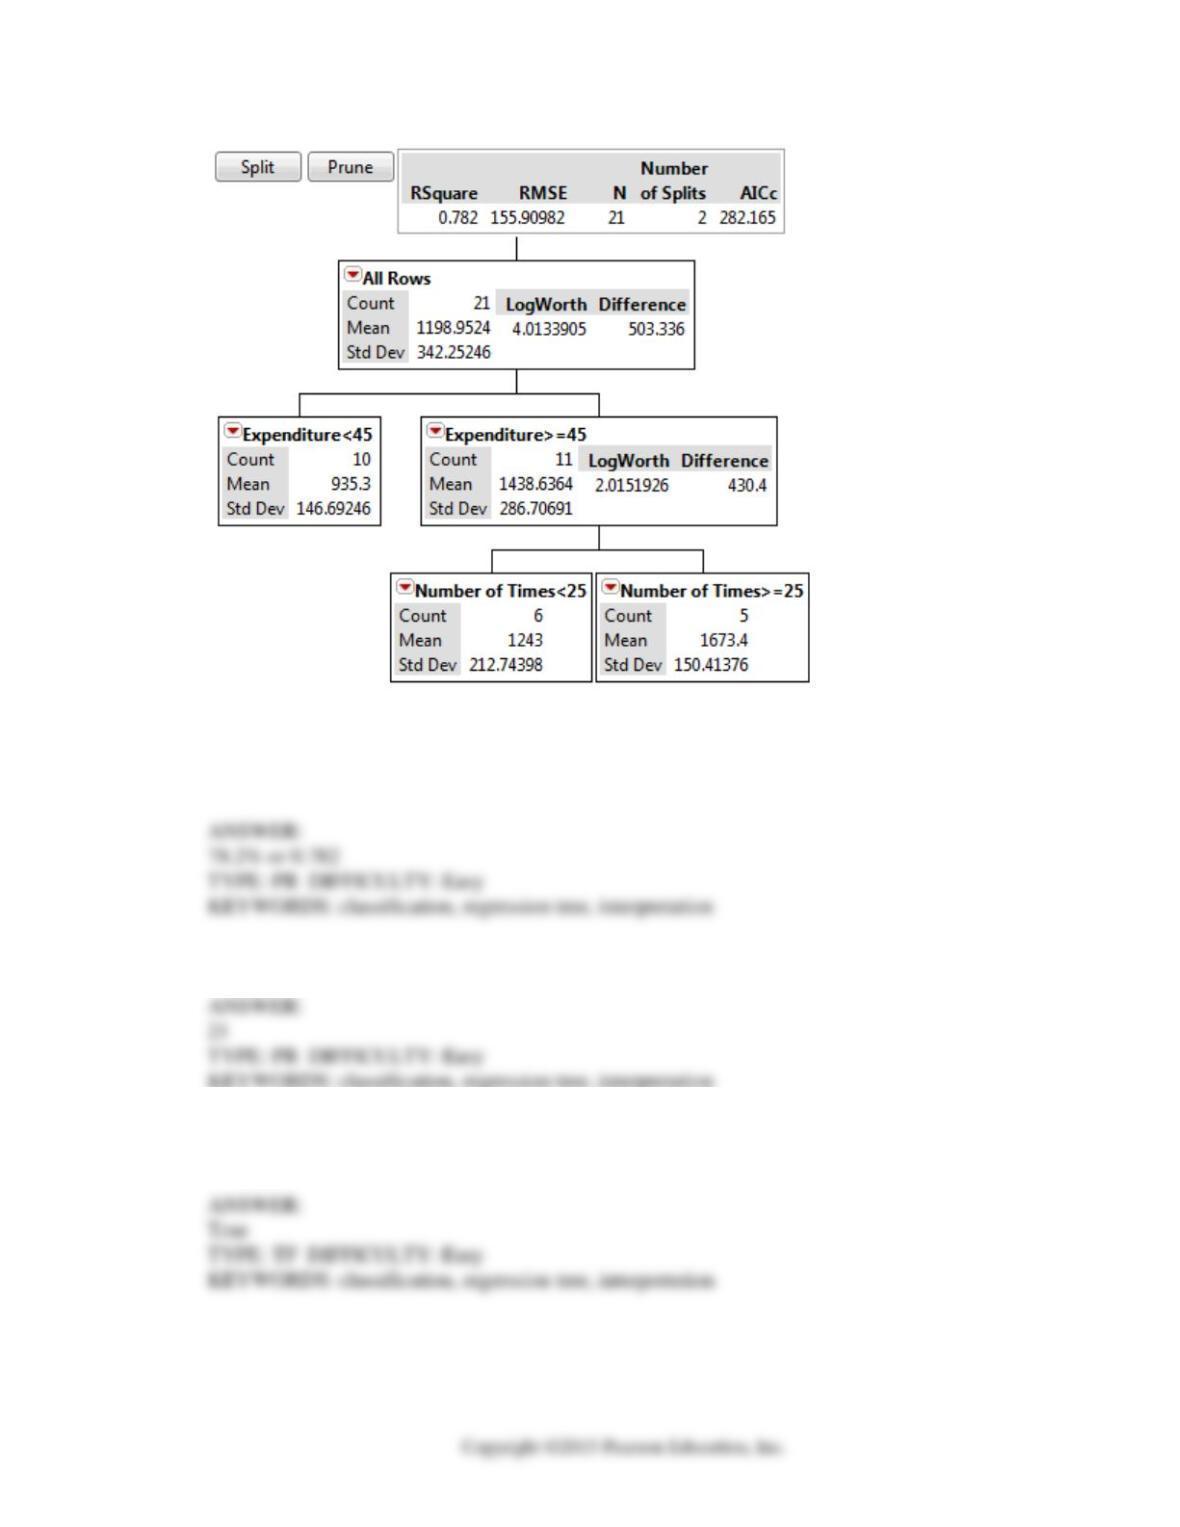
SCENARIO 17-4
The regression tree below was obtained for predicting the weekend box office revenue of a newly
released movie (in thousands of dollars) based on data collected in different cities on the expenditure
(at $25, $30, $35, $40, $45, $50, $55, $60, $65 or $70 thousand) spent on TV advertising and the
number of times (10, 15, 20, 25, 30 or 35) a day the advertisement appear on TV.
Business Analytics 17-15
69. Referring to Scenario 17-4, what percentage of the variation in weekend box office revenue
can be explained by the amount spent on TV advertising and the number of times a day the
advertisement appear on TV?
70. Referring to Scenario 17-4, how many cities were used in generating the regression tree?
71. True or False: Referring to Scenario 17-4, the first split occurs at $45 thousand spent on TV
advertising.

17-16 Business Analytics
72. True or False: Referring to Scenario 17-4, the first split occurs at 25 TV appearances a day of
the advertisement.
73. True or False: Referring to Scenario 17-4, the highest mean weekend box office revenue is
predicted to occur with at least $45 thousand spent on TV advertisement and at least 25
advertisement appearances a day.
74. True or False: Referring to Scenario 17-4, the highest mean weekend box office revenue is
predicted to occur with at least $45 thousand spent on TV advertisement and fewer than 25
advertisement appearances a day.
75. True or False: Referring to Scenario 17-4, the highest mean weekend box office revenue is
predicted to occur with less than $45 thousand spent on TV advertisement and fewer than 25
advertisement appearances a day.
76. True or False: Referring to Scenario 17-4, the highest mean weekend box office revenue is
predicted to occur with $55 thousand spent on TV advertisement and at least 25 advertisement
appearances a day.

77. True or False: Referring to Scenario 17-4, the highest mean weekend box office revenue is
predicted to occur with $30 thousand spent on TV advertisement and 30 advertisement
appearances a day.
78. True or False: Referring to Scenario 17-4, the highest mean weekend box office revenue is
predicted to occur with $55 thousands spent on TV advertisement and 35 advertisement
appearances a day.
79. True or False: Neural networks does not make any a priori assumption about the distribution of
the data and, hence, are nonparametric methods.
80. True or False: Multilayer perceptrons usually contain an input layer, a hidden layer and an
output layer.
81. True or False: The forward-and-backward computation among the three layers of a multilayer
perceptron is repeated until the output layer detects that the difference between the predicted
results and the target values has been minimized or is at an acceptable level.
82. True or False: Neural networks require only training data but not validating data.

17-18 Business Analytics
83. True or False: Neural networks use the validating data to uncover a model and then the training
data to see if the model can make the correct prediction or classification.
84. True or False: Neural networks can suffer from poor quality of data, insufficient data, or
overfitted models.
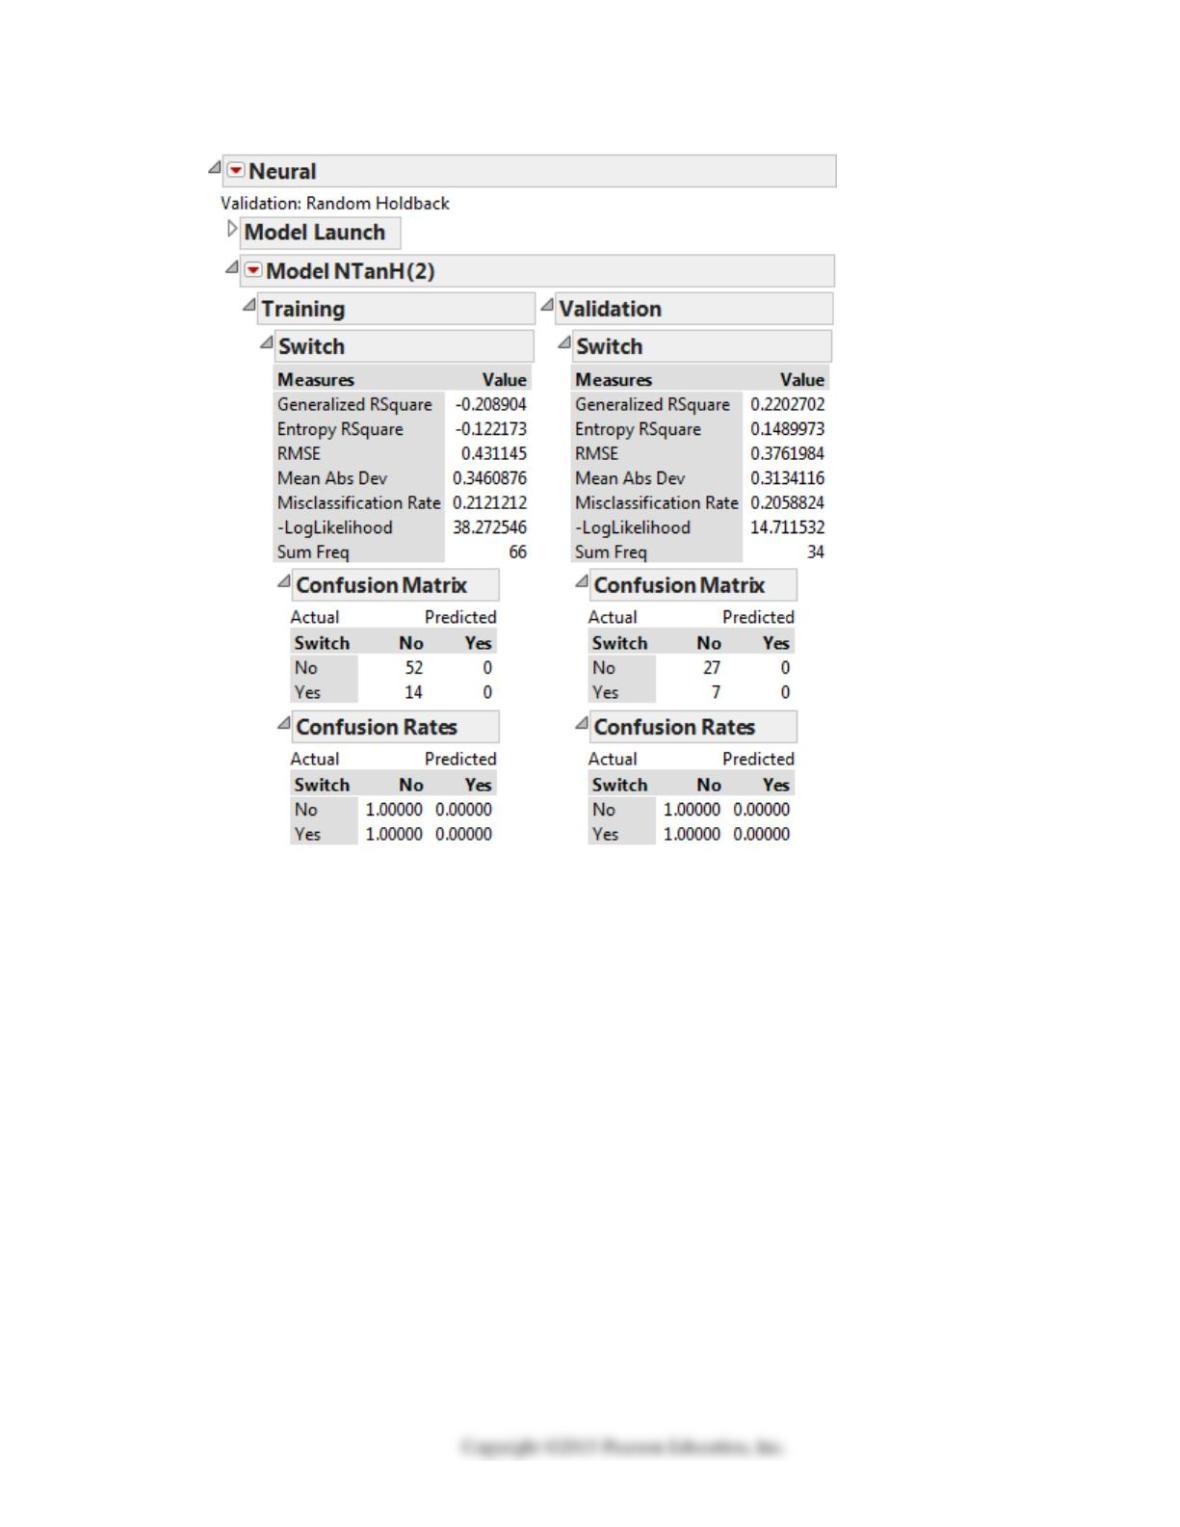
SCENARIO 17-5
The output below shows the results of the neural network model that has been constructed to predict
the probability of a cable company’s customers who will switch (“Yes” or “No”) into its bundled
program offering based on the price ($30, $40, $50, $60) and whether the customer spends more than
5 hours a day watching TV (“Yes” or “No”) using the date set of 100 customers collected from a
survey.
Business Analytics 17-19

17-20 Business Analytics
85. Referring to Scenario 17-5, the misclassification rate of 0.2058824 in the validation data set
means that how many customers in the validation data are incorrectly classified?
86. Referring to Scenario 17-5, out of the 27 customers who did not switch in the validation data
set, how many are correctly classified by the neural network?
87. Referring to Scenario 17-5, out of the 7 customers who did switch in the validation data set,
how many are correctly classified by the neural network?
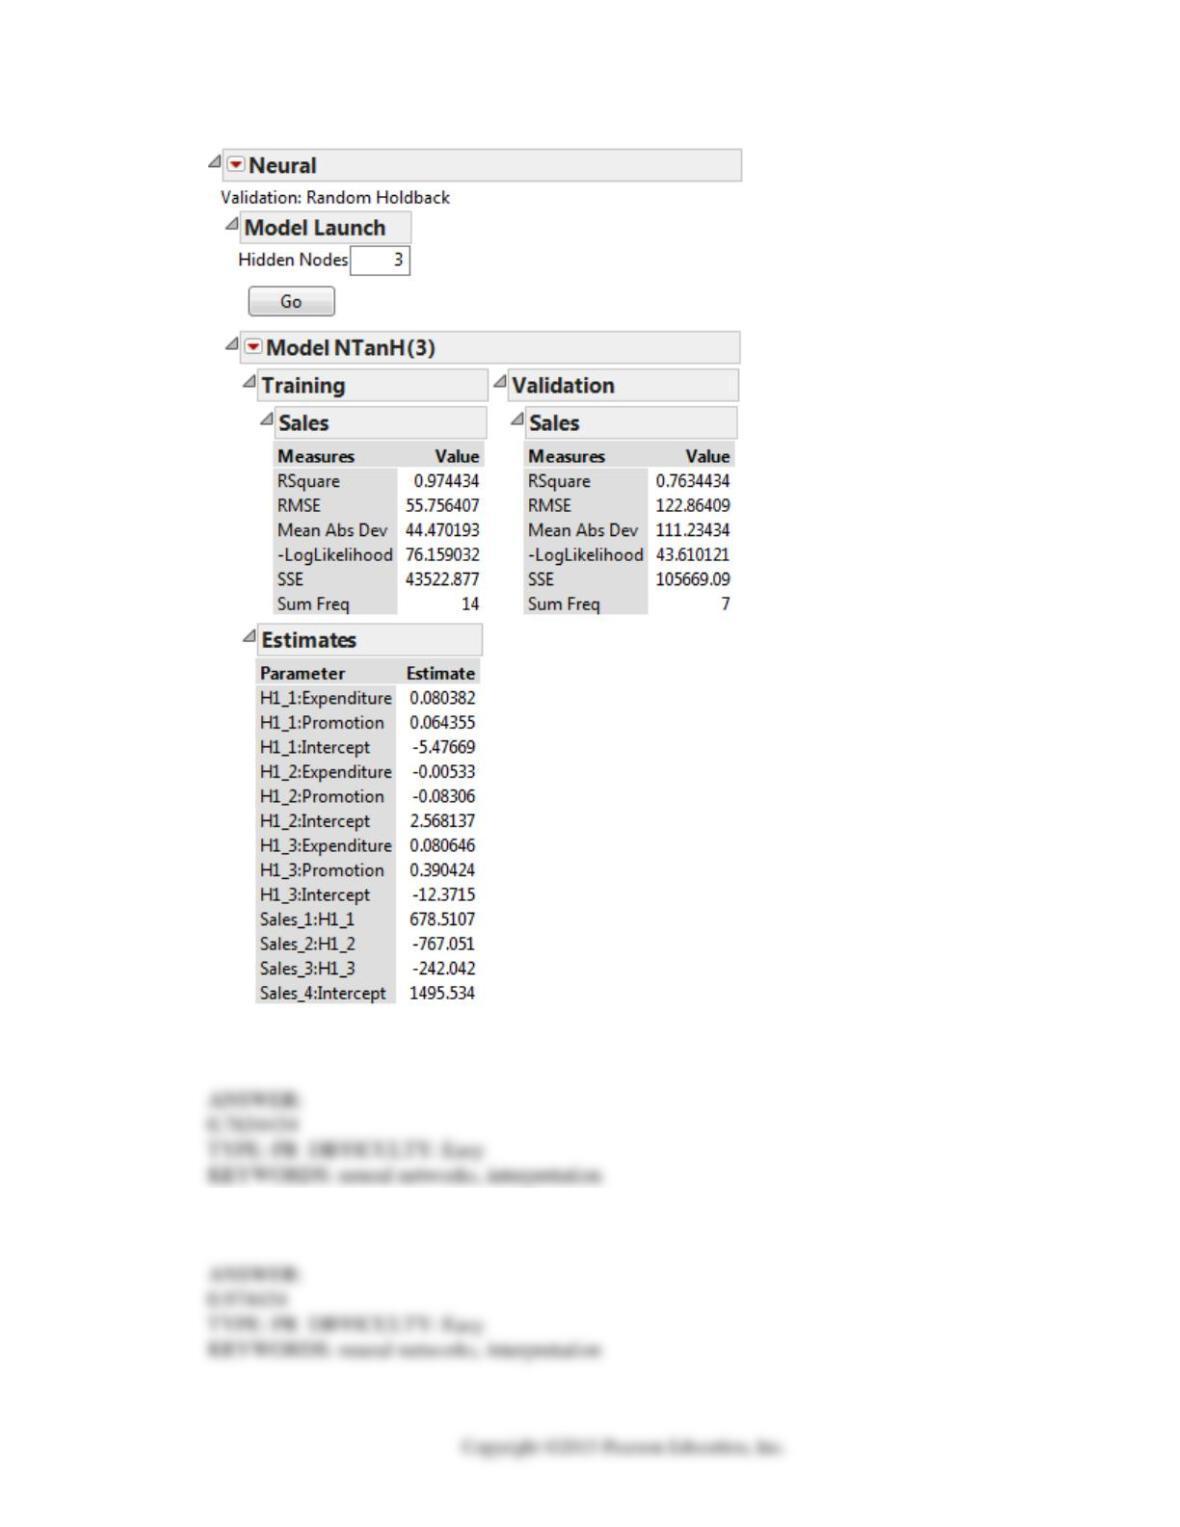
SCENARIO 17-6
The neural network output below was obtained for predicting the weekend box office revenue of a
newly released movie (in thousands of dollars) based on data collected in different cities on the
expenditure (at $25, $30, $35, $40, $45, $50, $55, $60 $65 or $70 thousands) spent on TV
advertising and the number of times (10, 15, 20, 25, 30 or 35) a day the advertisement appear on TV.
Business Analytics 17-21
88. Referring to Scenario 17-6, what is the r-square of model for the validating data?
89. Referring to Scenario 17-6, what is the r-square of model for the training data?

17-22 Business Analytics
90. Referring to Scenario 17-6, how many hidden nodes are used in the neural network model?
91. True or False: Each observation is treated as its own cluster at the beginning in hierarchical
clustering.
92. True or False: Each observation is treated as its own cluster at the beginning in k-means
clustering.
93. True or False: In k-means clustering, observations that are assigned to a cluster may never be
reassigned to a different cluster later in the process.
94. True or False: Complete linkage can be used to measure the distance between objects in cluster
analysis.
95. True or False: Euclidean distance can be used to measure the distance between objects in
cluster analysis.

Business Analytics 17-23
96. True or False: Ward’s minimum variance can be used to measure the distance between clusters
in cluster analysis.
97. True or False: Single linkage can be used to measure the distance between objects in cluster
analysis.
98. True or False: Average linkage can be used to measure the distance between clusters in cluster
analysis.
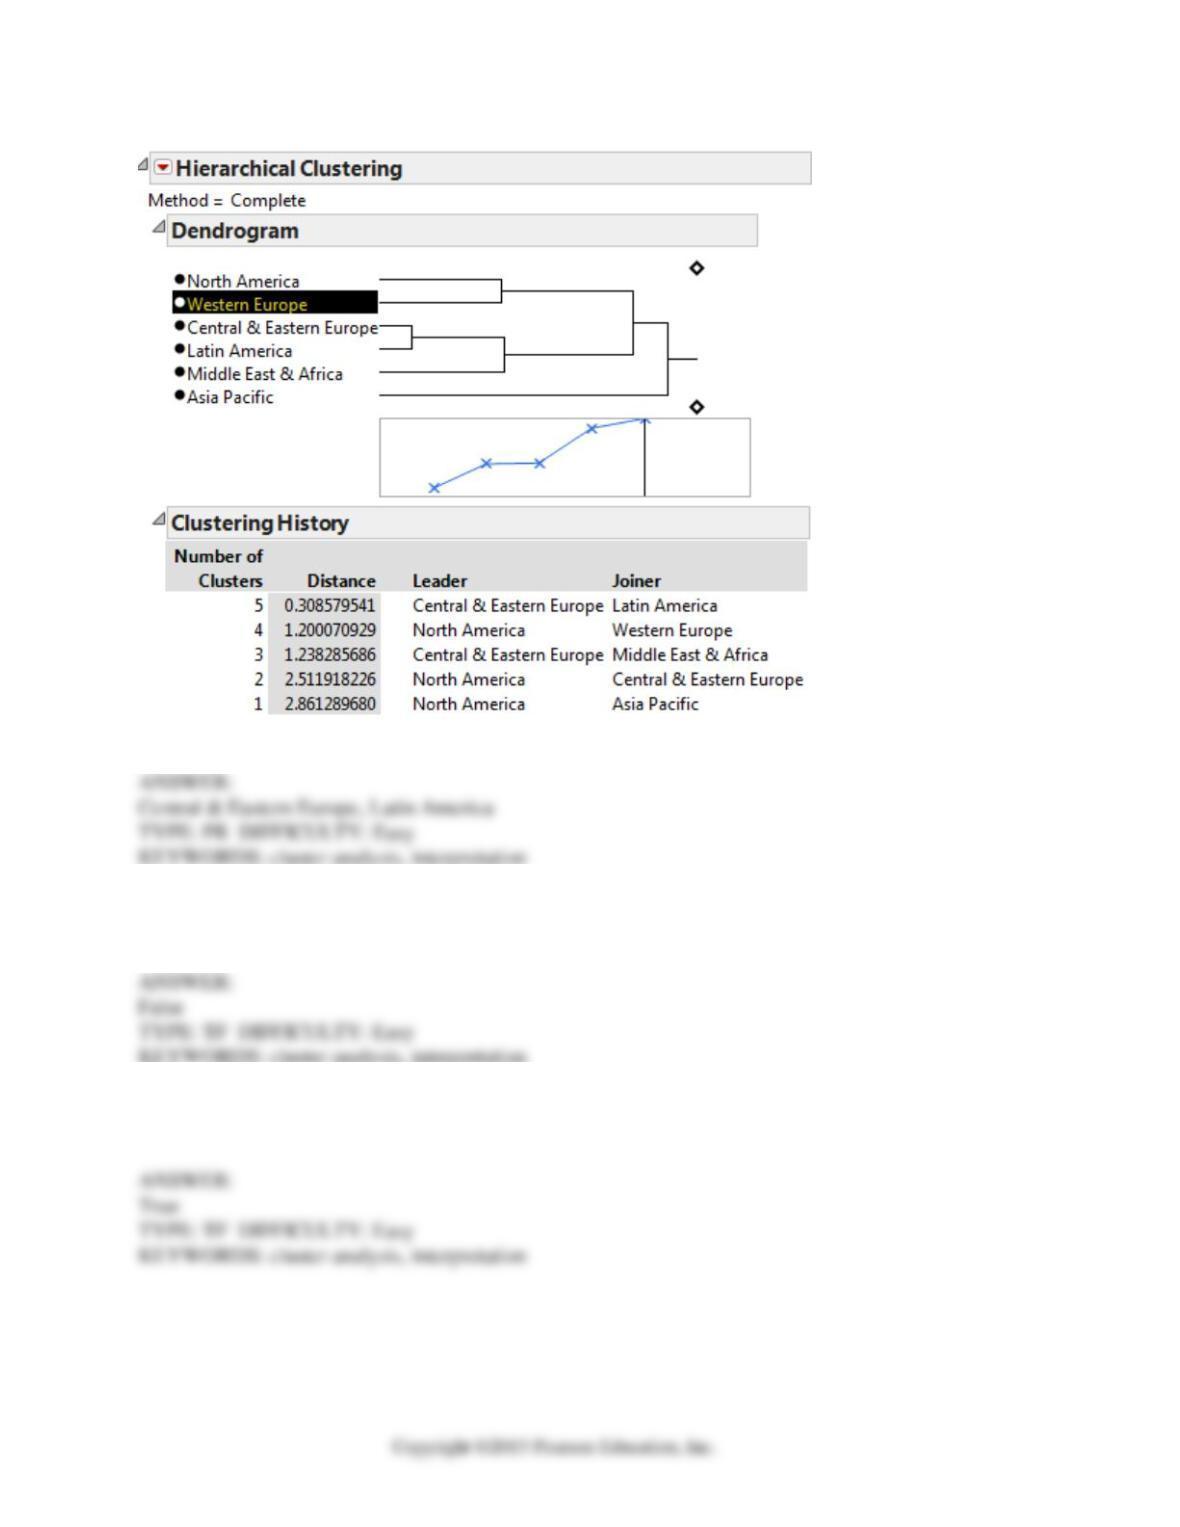
SCENARIO 17-7
The output below shows the results of cluster analysis on the different regions of the world (North
America, Asia Pacific, Western Europe, Central & Eastern Europe, Latin America, and Middle East
& Africa) based on the amounts (in billions of US dollars) and the percentage changes from prior
year of business-to–consumer ecommerce sales last year.
17-24 Business Analytics
99. Referring to Scenario 17-7, what are the first group of countries that cluster together?
100. True or False: Referring to Scenario 17–7, the “complete” method is used to measure the
distance between objects within a cluster.
101. True or False: Referring to Scenario 17–7, the “complete” method is used to measure the
distance between clusters.

Business Analytics 17-25
102. True or False: Referring to Scenario 17-7, North America and Western Europe are the second
groups of countries that cluster together.
103. True or False: Referring to Scenario 17-7, Middle East & Africa is the next region that clusters
with the Central & Eastern Europe and Latin America cluster.
104. True or False: Referring to Scenario 17-7, at the two cluster level, Asia Pacific alone makes up
one of the two clusters.
105. True or False: In metric multidimensional scaling, the distance between objects is ratio scaled.
106. True or False: In nonmetric multidimensional scaling, the distance between objects is ordinal
scaled.
107. True or False: In multidimensional scaling, the stress statistic is used to measure the distance
between objects.

17-26 Business Analytics
108. True or False: In multidimensional scaling, the stress statistic is used to measure the goodness
of fit of the results to the data.
109. True or False: In multidimensional scaling, the general rule is to increase the number of
dimensions as long as the stress statistic decreases substantially.
110. True or False: In multidimensional scaling, the general rule in to increase the number of
dimensions as long as the stress statistic increases substantially.
111. True or False: In multidimensional scaling, the larger the stress statistic, the better is the fit.
112. True or False: In multidimensional scaling, the Euclidean distance is most commonly used to
measure the distance between objects.