Statistical Applications in Quality Management 19-1
ONLINE CHAPTER 19: STATISTICAL APPLICATIONS IN
QUALITY MANAGEMENT
1. The control chart
a) focuses on the time dimension of a system.
b) captures the natural variability in the system.
c) can be used for categorical, discrete, or continuous variables.
d) All of the above.
2. Variation signaled by individual fluctuations or patterns in the data is called
a) special or assignable causes.
b) common or chance causes.
c) explained variation.
d) the standard deviation.
3. Variation due to the inherent variability in a system of operation is called
a) special or assignable causes.
b) common or chance causes.
c) explained variation.
d) the standard deviation.
4. The principal focus of the control chart is the attempt to separate special or assignable causes of
variation from common causes of variation. Which causes of variation can be reduced only by
changing the system?
a) Special or assignable causes
b) Common causes
c) Total causes
d) None of the above
19-2 Statistical Applications in Quality Management
5. Once the control limits are set for a control chart, one attempts to
a) discern patterns that might exist in values over time.
b) determine whether any points fall outside the control limits.
c) Both of the above.
d) None of the above.
6. Which of the following situations suggests a process that appears to be operating in a state of
statistical control?
a) A control chart with a series of consecutive points that are above the center line and a
series of consecutive points that are below the center line.
b) A control chart in which no points fall outside either the upper control limit or the lower
control limit and no patterns are present.
c) A control chart in which several points fall outside the upper control limit.
d) All of the above.
7. Which of the following situations suggests a process that appears to be operating out of statistical
control?
a) A control chart with a series of consecutive points that are above the center line and a
series of consecutive points that are below the center line.
b) A control chart in which points fall outside the lower control limit.
c) A control chart in which several points fall outside the upper control limit.
d) All of the above.
8. A process is said to be out of control if
a) a point falls above the upper or below the lower control lines.
b) eight or more consecutive points fall above the center line or eight or more consecutive
points fall below the center line.
c) Either of the above.
d) None of the above.
Statistical Applications in Quality Management 19-3
9. One of the morals of the red bead experiment is:
a) variation is part of the process.
b) only management can change the system.
c) it is the system that primarily determines performance.
d) All of the above.
SCENARIO 19-1
A local newspaper has 10 delivery boys who each deliver the morning paper to 50 customers every
day. The owner decides to record the number of papers delivered on time for a 10-day period for one
of the delivery boys and construct a p chart to see whether the percentage is too erratic.
Number of Papers
Day Delivered on Time
1 46
2 45
3 46
4 45
5 43
6 48
7 46
8 49
9 48
10 47
10. Referring to Scenario 19-1, what is the numerical value of the center line for the p chart?
a) 0.926
b) 0.911
c) 0.885
d) 0.500
11. Referring to Scenario 19-1, what is the numerical value of the lower control limit for the p chart?
a) 0.920
b) 0.911
c) 0.815
d) 0.798
19-4 Statistical Applications in Quality Management
12. Referring to Scenario 19-1, what is the numerical value of the upper control limit for the p chart?
a) 0.926
b) 0.961
c) 0.979
d) 1.037
13. Referring to Scenario 19-1, which expression best characterizes the p chart?
a) Cycles
b) Increasing trend
c) In-control
d) Individual outliers
SCENARIO 19-2
A political pollster randomly selects a sample of 100 voters each day for 8 successive days and asks
how many will vote for the incumbent. The pollster wishes to construct a p chart to see if the
percentage favoring the incumbent candidate is too erratic.
Sample Number Favoring
(Day) Incumbent Candidate
1 57
2 57
3 53
4 51
5 55
6 60
7 56
8 59
14. Referring to Scenario 19-2, what is the numerical value of the center line for the p chart?
a) 0.53
b) 0.56
c) 0.63
d) 0.66
Statistical Applications in Quality Management 19-5
15. Referring to Scenario 19-2, what is the numerical value of the lower control limit for the p chart?
a) 0.37
b) 0.41
c) 0.50
d) 0.71
16. Referring to Scenario 19-2, what is the numerical value of the upper control limit for the p chart?
a) 0.92
b) 0.89
c) 0.71
d) 0.62
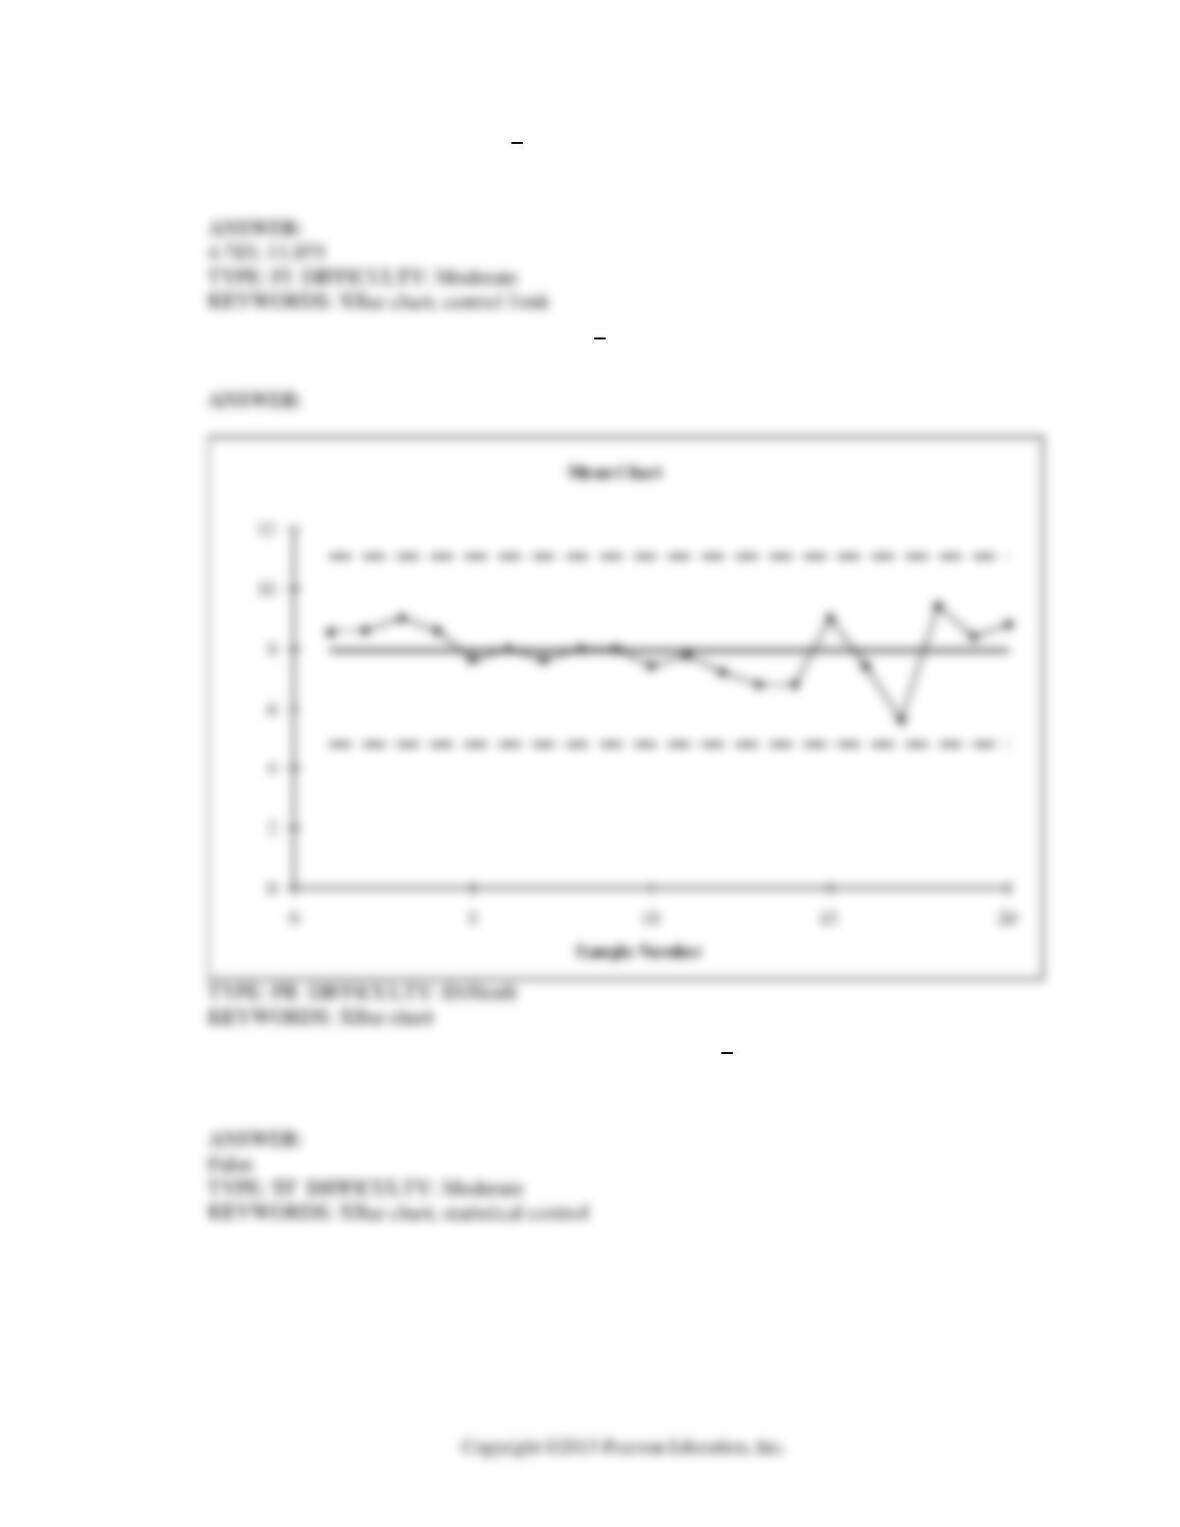
17. Referring to Scenario 19-2, which expression best characterizes the p chart?
a) In-control
b) Increasing trend
c) Decreasing trend
d) Individual outliers
19-6 Statistical Applications in Quality Management
SCENARIO 19-3
A quality control analyst for a light bulb manufacturer is concerned that the time it takes to produce a
batch of light bulbs is too erratic. Accordingly, the analyst randomly surveys 10 production periods
each day for 14 days and records the sample mean and range for each day.
Day
X
(in minutes) R
1 58.5 5.1
2 47.6 7.8
3 64.3 6.1
4 60.6 5.7
5 63.7 6.2
6 57.5 6.0
7 55.0 5.4
8 54.9 6.1
9 55.0 5.9
10 62.7 5.0
11 61.9 7.1
12 60.0 6.5
13 58.3 5.9
14 52.0 5.2
18. Referring to Scenario 19-3, suppose the analyst constructs an R chart to see if the variability in
production times is in-control. What is the center line of this R chart?
a) 4.8
b) 6.0
c) 6.9
d) 7.1
19. Referring to Scenario 19-3, suppose the analyst constructs an R chart to see if the variability in
production times is in-control. What is the lower control limit for this R chart?
a) 4.84
b) 3.37
c) 2.98
d) 1.34
Statistical Applications in Quality Management 19-7
20. Referring to Scenario 19-3, suppose the analyst constructs an R chart to see if the variability in
production times is in-control. What is the upper control limit for this R chart?
a) 10.66
b) 9.37
c) 7.98
d) 6.34
21. Referring to Scenario 19-3, suppose the analyst constructs an R chart to see if the variability in
production times is in-control. The R chart is characterized by which of the following?
a) Increasing trend
b) Decreasing trend
c) In-control
d) Points outside the control limits
22. Referring to Scenario 19-3, suppose the sample mean and range data were based on 11
observations per day instead of 10. How would this change affect the lower and upper control
limits of the R chart?
a) LCL would increase; UCL would decrease.
b) LCL would remain the same; UCL would decrease.
c) Both LCL and UCL would remain the same.
d) LCL would decrease; UCL would increase.
23. Referring to Scenario 19-3, suppose the analyst constructs an
X
chart to see if the production
process is in-control. What is the center line for this chart?
a) 64.3
b) 59.5
c) 58.0
d) 57.1
19-8 Statistical Applications in Quality Management
24. Referring to Scenario 19-3, suppose the analyst constructs an
X
chart to see if the production
process is in-control. What is the lower control limit (LCL) for this chart?
a) 47.60
b) 56.15
c) 57.15
d) 58.05
25. Referring to Scenario 19-3, suppose the analyst constructs an
X
chart to see if the production
process is in-control. What is the upper control limit (UCL) for this chart?
a) 62.15
b) 60.95
c) 59.85
d) 58.75
26. Referring to Scenario 19-3, suppose the analyst constructs an
X
chart to see if the production
process is in-control. Which expression best describes this chart?
a) In-control
b) Increasing trend
c) Decreasing trend
d) Individual outliers
Statistical Applications in Quality Management 19-9
SCENARIO 19-4
A factory supervisor is concerned that the time it takes workers to complete an important production
task (measured in seconds) is too erratic and adversely affects expected profits. The supervisor
proceeds by randomly sampling 5 individuals per hour for a period of 10 hours. The sample mean and
range for each hour are listed below.
Hour
X
R
1 18.4 25
2 16.9 27
3 23.0 30
4 21.2 23
5 21.0 24
6 24.0 25
7 19.3 12
8 15.8 14
9 20.0 13
10 23.0 11
She also decides that lower and upper specification limit for the critical-to–quality variable should be
10 and 30 seconds, respectively.
27. Referring to Scenario 19-4, suppose the supervisor constructs an R chart to see if the variability in
collection times is in-control. What is the center line of this R chart?
a) 20.00
b) 20.56
c) 20.40
d) 24.00
28. Referring to Scenario 19-4, suppose the supervisor constructs an R chart to see if the variability in
collection times is in-control. What are the lower and upper control limits for this R chart?
a) – 2.33, 43.13
b) – 2.28, 42.28
c) 0, 42.28
d) 0, 43.13
19-10 Statistical Applications in Quality Management
29. Referring to Scenario 19-4, suppose the supervisor constructs an R chart to see if the variability in
collection times is in-control. This R chart is characterized by which of the following?
a) Decreasing trend
b) Increasing trend
c) In-control
d) Individual outliers
30. Referring to Scenario 19-4, suppose the sample mean and range data were based on 6
observations per hour instead of 5. How would this change affect the lower and upper control
limits of an R chart?
a) LCL would increase; UCL would decrease.
b) LCL would remain the same; UCL would decrease.
c) Both LCL and UCL would remain the same.
d) LCL would decrease; UCL would increase.
31. Referring to Scenario 19-4, suppose the supervisor constructs an
X
chart to see if the process is
in–control. What is the center line of the chart?
a) 20.00
b) 20.26
c) 21.00
d) 24.26
32. Referring to Scenario 19-4, suppose the supervisor constructs an
X
chart to see if the process is
in–control. What are the lower and upper control limits of this chart?
a) 10.00, 30.00
b) 8.49, 32.03
c) 5.39, 35.13
d) 4.96, 35.56
Statistical Applications in Quality Management 19-11
33. Referring to Scenario 19-4, suppose the supervisor constructs an
X
chart to see if the process is
in-control. Which expression best describes this chart?
a) Decreasing trend
b) In-control
c) Increasing trend
d) Individual outliers
34. Referring to Scenario 19-4, what is the value of
2
d
factor?
35. Referring to Scenario 19-4, what percentage of the time it takes workers to complete an important
production task will fall inside the specification limits?
36. Referring to Scenario 19-4, what is the value of the
p
C
index?
37. Referring to Scenario 19-4, what is the value of the CPL index?
38. Referring to Scenario 19-4, what is the value of the CPU index?
19-12 Statistical Applications in Quality Management
39. Referring to Scenario 19-4, what is the value of the
pk
C
index?
40. True or False: The control limits are based on the standard deviation of the process.
41. True or False: The purpose of a control chart is to eliminate common cause variation.
42. True or False: Special or assignable causes of variation are signaled by individual fluctuations or
patterns in the data.
43. True or False: Common causes of variation represent variation due to the inherent variability in
the system.
44. True or False: Common causes of variation are correctable without modifying the system.
Statistical Applications in Quality Management 19-13
45. True or False: Changes in the system to reduce common cause variation are the responsibility of
management.
46. True or False: One of the morals of the red bead experiment is that variation is part of any
process.
47. True or False: In the United States, the control limits on a control chart are placed so that they are
3 standard deviations above and below a central line.
48. True or False: The p chart is a control chart used for monitoring the proportion of items that meet
given specifications.
49. True or False: The R chart is a control chart used to monitor a process mean.
50. True or False: It is not possible for the
X
chart to be out-of-control when the R chart is in control.
19-14 Statistical Applications in Quality Management
51. The cause of variation that can be reduced only by changing the system is ______ cause
variation.
52. _______ causes of variation are correctable without modifying the system.
SCENARIO 19-5
A manufacturer of computer disks took samples of 240 disks on 15 consecutive days. The number of
disks with bad sectors was determined for each of these samples. The results are in the table that
follows.
Day Bad % Bad
1 9 0.037500
2 7 0.029167
3 4 0.016667
4 6 0.025000
5 8 0.033333
6 3 0.012500
7 6 0.025000
8 10 0.041667
9 16 0.066667
10 24 0.100000
11 15 0.062500
12 9 0.037500
13 4 0.016667
14 8 0.033333
15 6 0.025000
53. Referring to Scenario 19-5, the best estimate of the mean proportion of disks with bad sectors is
__________.
Statistical Applications in Quality Management 19-15
54. Referring to Scenario 19-5, a p control chart is to be made for these data. The center line of the
control chart is __________.
55. Referring to Scenario 19-5, a p control chart is to be made for these data. The estimate of the
standard error of the proportion of disks with bad sectors is __________.
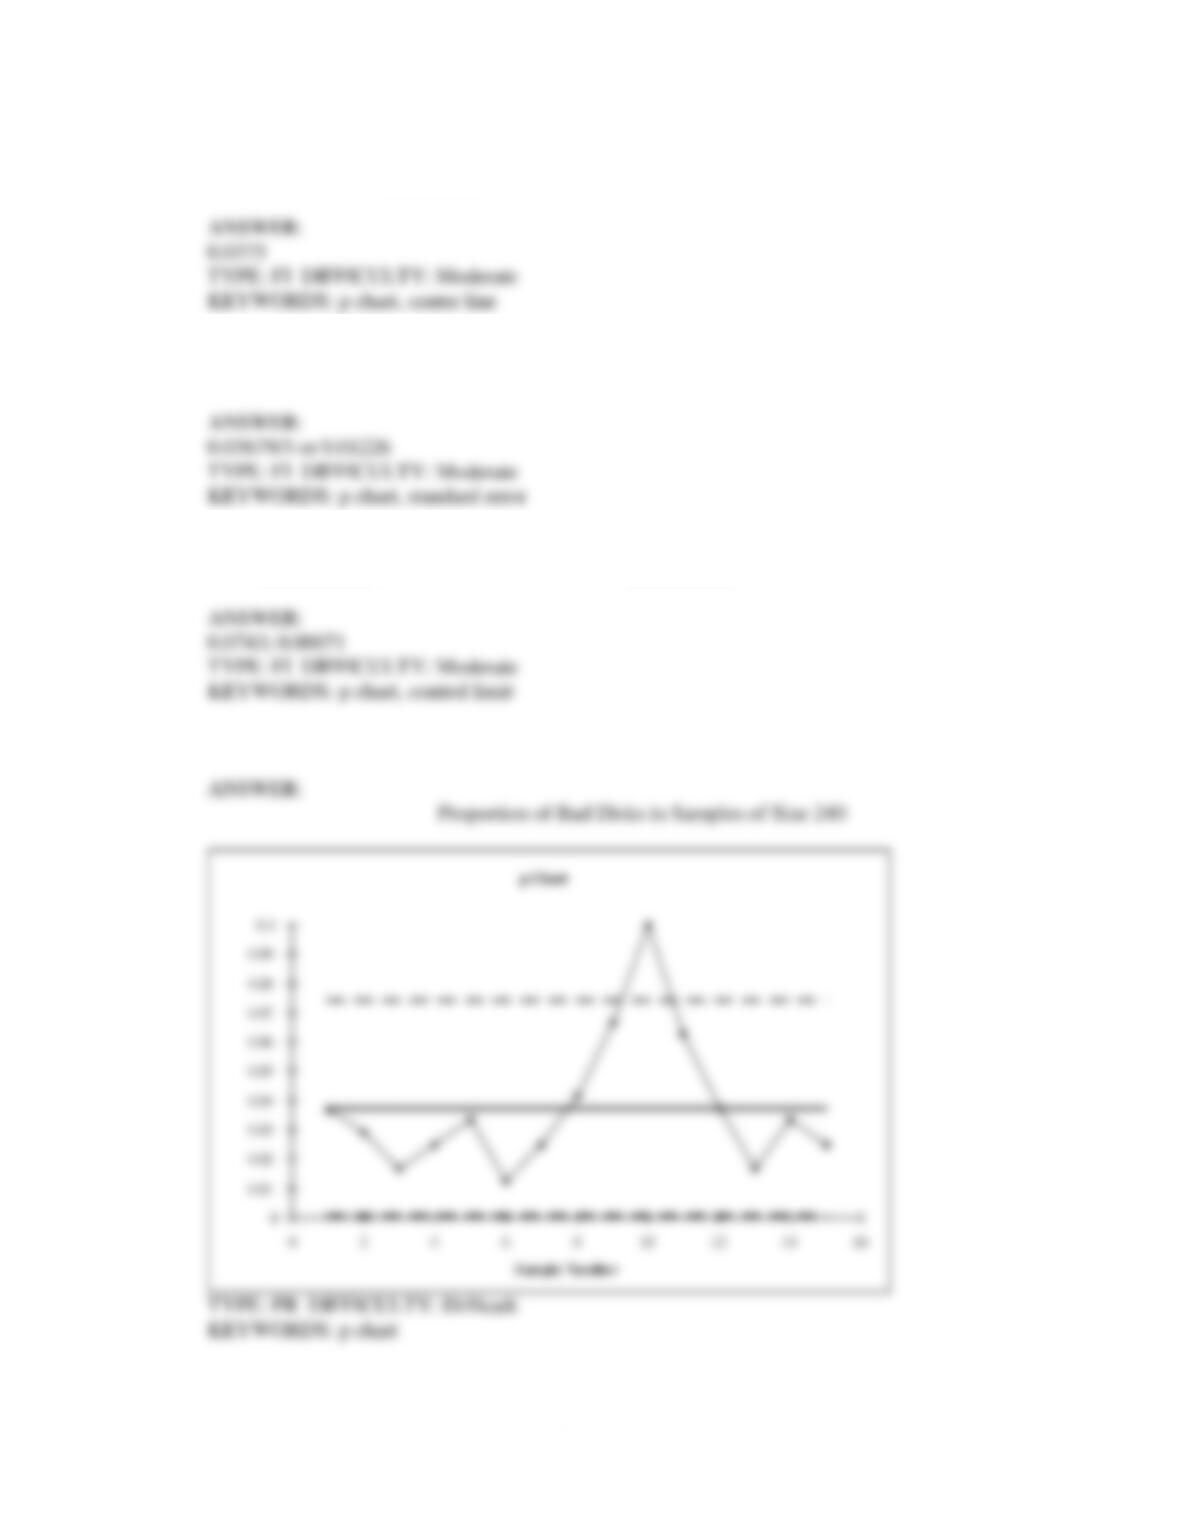
56. Referring to Scenario 19-5, a p control chart is to be made for these data. The upper control limit
is __________, and the lower control limit is __________.
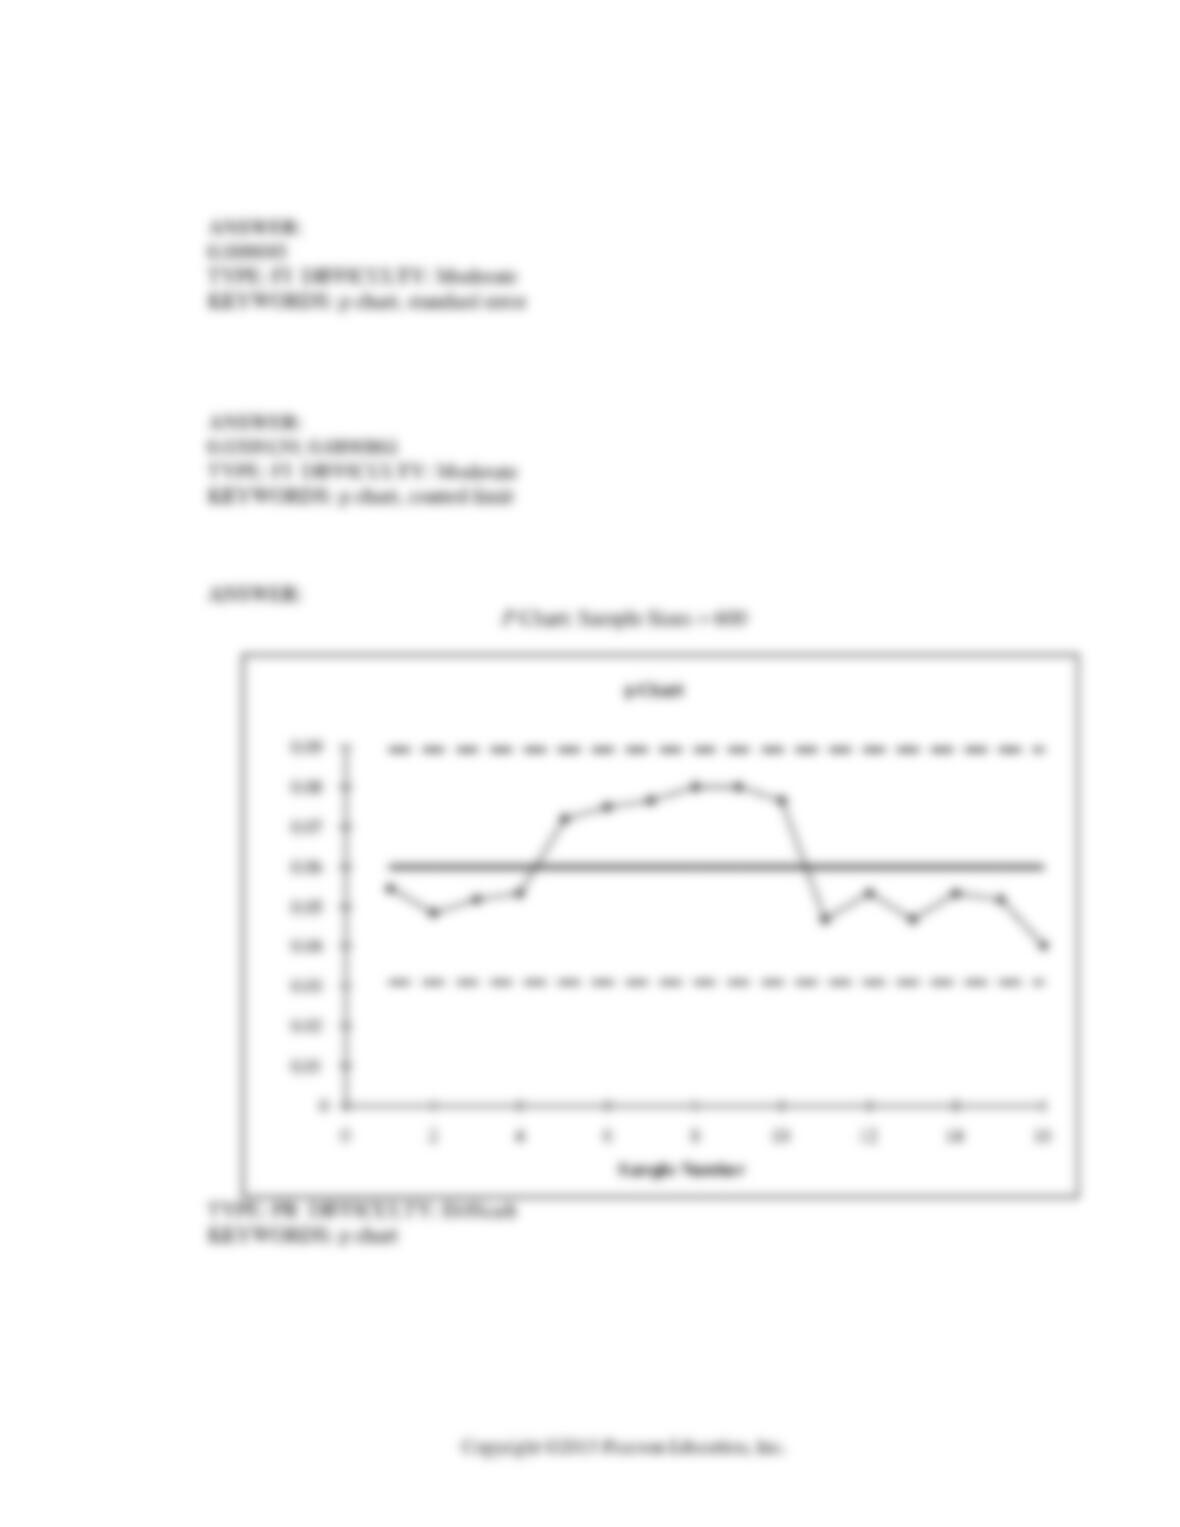
57. Referring to Scenario 19-5, construct a p control chart for these data.
19-16 Statistical Applications in Quality Management
58. True or False: Referring to Scenario 19-5, the process seems to be in control.
SCENARIO 19-6
The maker of a packaged candy wants to evaluate the quality of her production process. On each of
16 consecutive days, she samples 600 bags of candy and determines the number in each day’s sample
that she considers to be of poor quality. The data that she developed follow.
Number Proportion
Day Poor Poor
1 33 0.0550000
2 29 0.0483333
3 31 0.0516667
4 32 0.0533333
5 43 0.0716667
6 45 0.0750000
7 46 0.0766667
8 48 0.0800000
9 48 0.0800000
10 46 0.0766667
11 28 0.0466667
12 32 0.0533333
13 28 0.0466667
14 32 0.0533333
15 31 0.0516667
16 24 0.0400000
59. Referring to Scenario 19-6, the estimate of the proportion of poor quality bags of candy is
__________.
60. Referring to Scenario 19-6, a p control chart is to be constructed for these data. The center line
for the chart should be located at __________.
ANSWER:
Statistical Applications in Quality Management 19-17
61. Referring to Scenario 19-6, a p control chart is to be constructed for these data. The estimate of
the standard error of the sample proportion is __________.
62. Referring to Scenario 19-6, a p control chart is to be constructed for these data. The lower control
limit is __________, while the upper control limit is __________.
63. Referring to Scenario 19-6, construct a p control chart for these data.
19-18 Statistical Applications in Quality Management
64. True or False: Referring to Scenario 19-6, the process seems to be in control.
SCENARIO 19-7
A supplier of silicone sheets for producers of computer chips wants to evaluate her manufacturing
process. She takes samples of size 5 from each day’s output and counts the number of blemishes on
each silicone sheet. The results from 20 days of such evaluations are presented below.
Sheet
Day 1 2 3 4 5 Mean Range
1 8 10 14 6 5 8.6 9
2 8 13 6 6 10 8.6 7
3 10 12 7 7 9 9.0 5
4 5 9 12 7 10 8.6 7
5 8 3 8 9 10 7.6 7
6 9 7 9 6 9 8.0 3
7 10 10 5 7 6 7.6 5
8 10 9 10 6 5 8.0 5
9 6 10 6 9 9 8.0 4
10 6 9 8 6 8 7.4 3
11 8 5 6 10 10 7.8 5
12 6 4 7 7 12 7.2 8
13 7 5 7 6 9 6.8 4
14 5 8 8 7 6 6.8 3
15 7 12 10 6 10 9.0 6
16 7 11 4 7 8 7.4 7
17 8 4 5 4 7 5.6 4
18 11 4 11 11 10 9.4 7
19 6 10 6 10 10 8.4 4
20 6 12 12 6 8 8.8 6
She also decides that the upper specification limit is 10 blemishes.
65. Referring to Scenario 19-7, an R chart is to be constructed for the number of blemishes. The
center line of this R chart is located at __________.
Statistical Applications in Quality Management 19-19
66. Referring to Scenario 19-7, an R chart is to be constructed for the number of blemishes. One way
to create the lower control limit involves multiplying the mean of the sample ranges by D3. For
this data set, the value of D3 is ________.
67. Referring to Scenario 19-7, an R chart is to be constructed for the number of blemishes. One way
to create the upper control limit involves multiplying the mean of the sample ranges by D4. For
this data set, the value of D4 is ________.
68. Referring to Scenario 19-7, an R chart is to be constructed for the number of blemishes. The
lower control limit for this data set is ________.
69. Referring to Scenario 19-7, an R chart is to be constructed for the number of blemishes. The
upper control limit for this data set is ________.
19-20 Statistical Applications in Quality Management
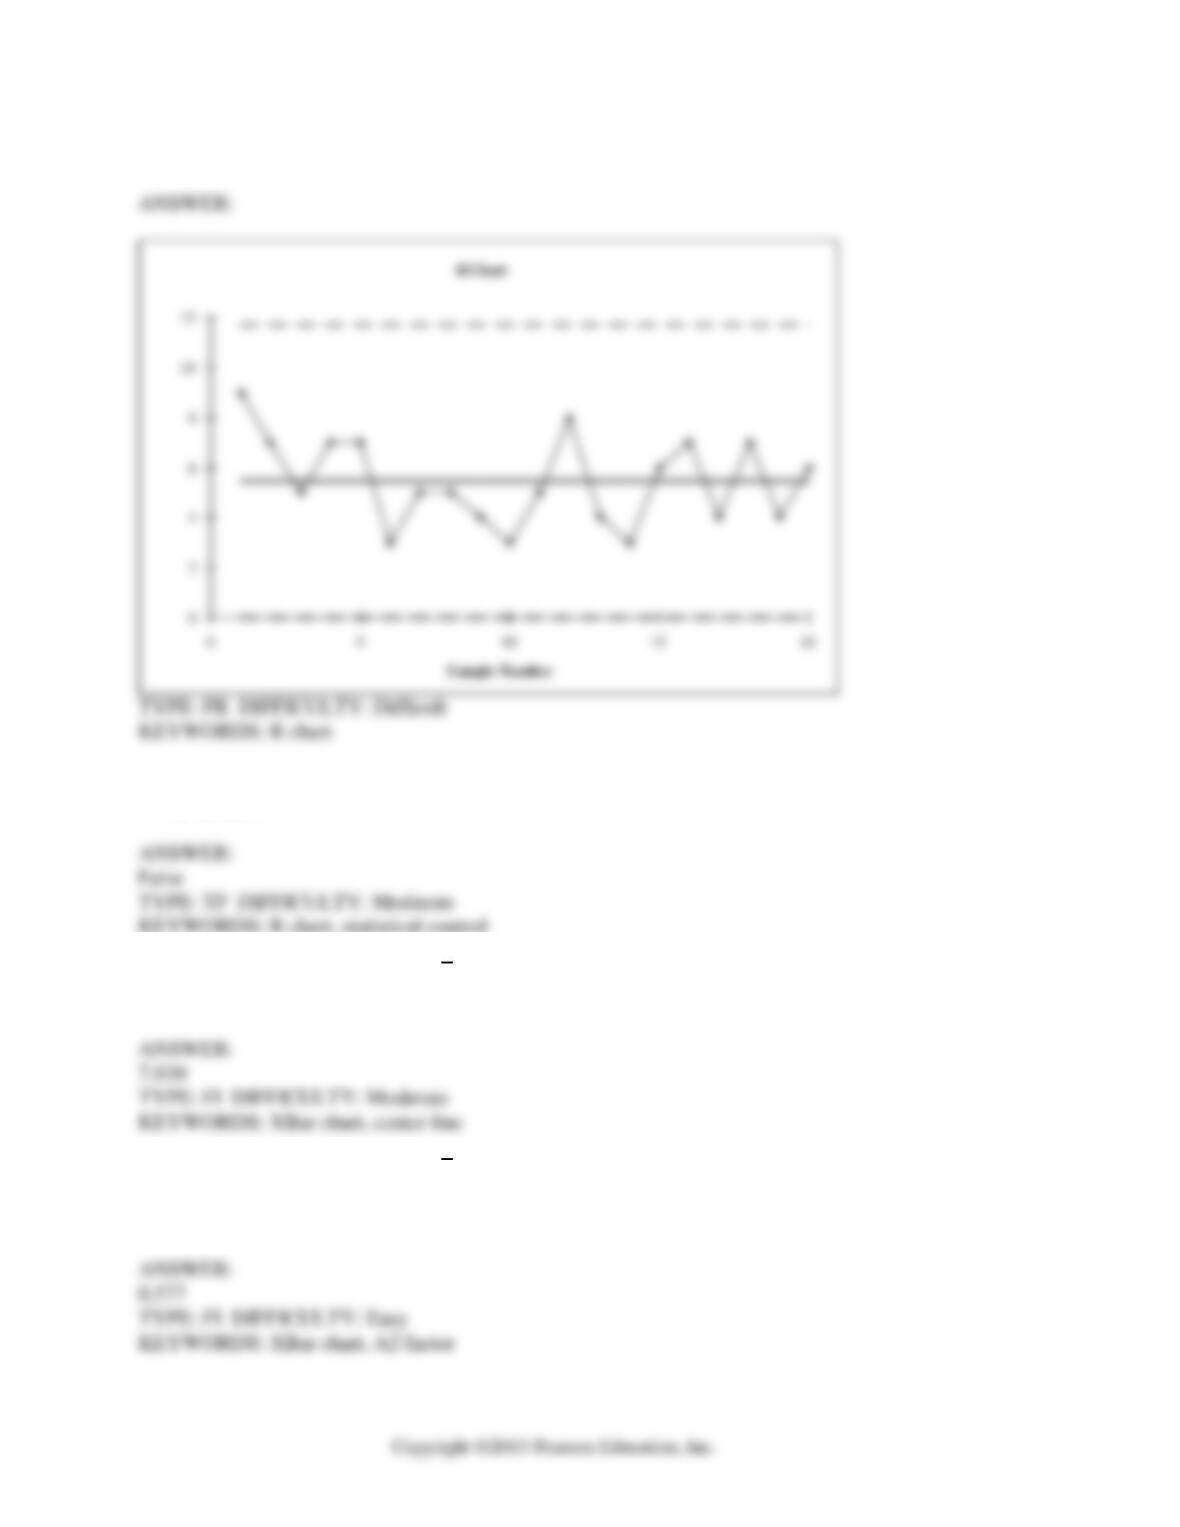
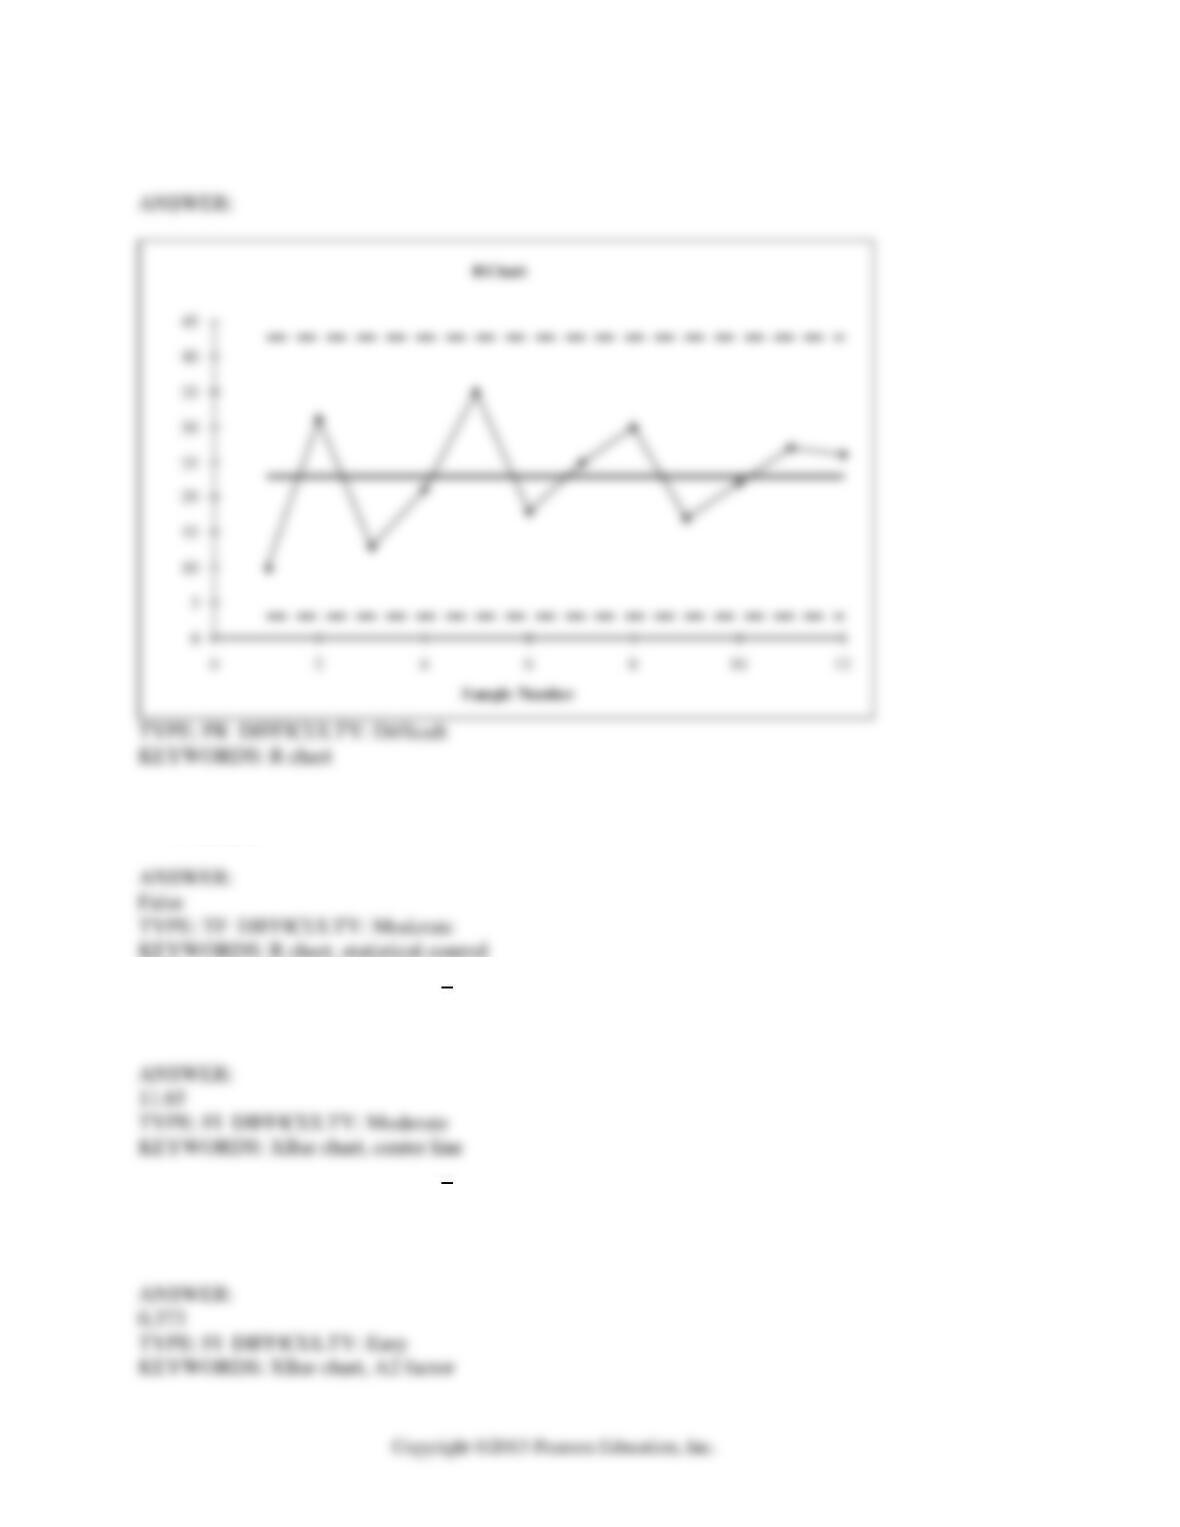
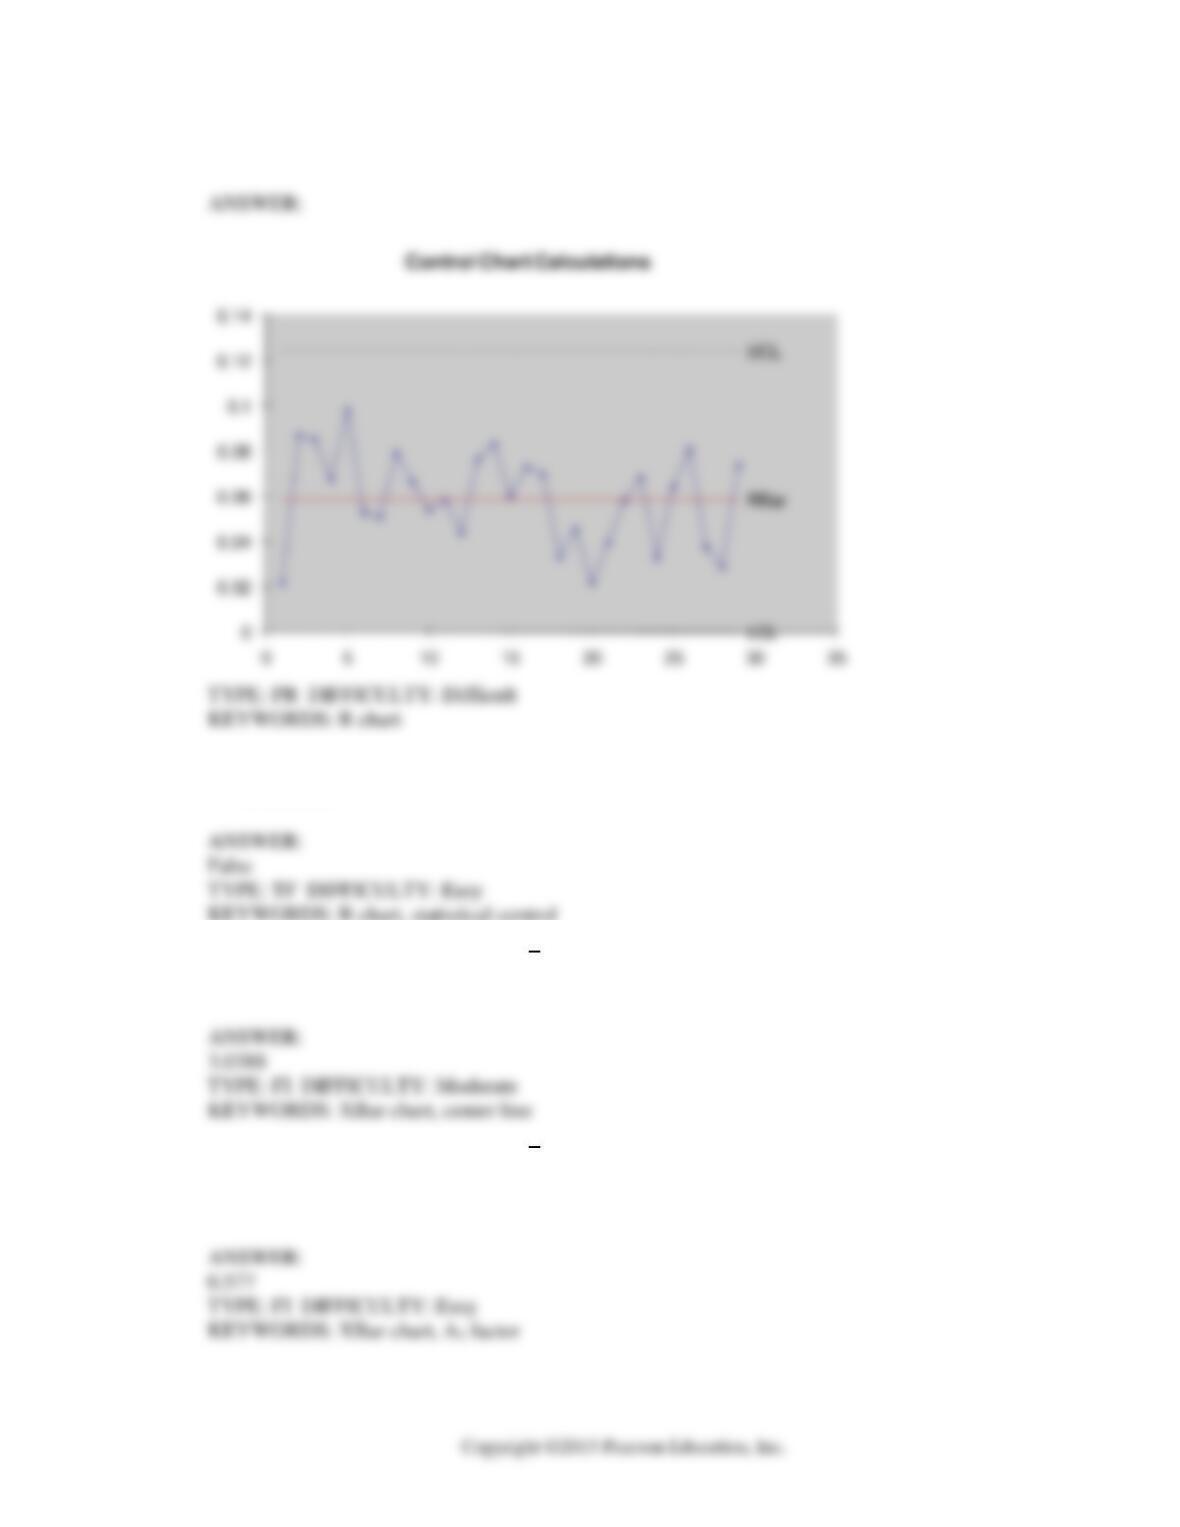
70. Referring to Scenario 19-7, construct an R chart for the number of blemishes.
71. True or False: Referring to Scenario 19-7, based on the R chart, it appears that the process is out
of control.
72. Referring to Scenario 19-7, an
X
chart is to be used for the number of blemishes. The center line
of this chart is located at __________.
73. Referring to Scenario 19-7, an
X
chart is to be used for the number of blemishes. One way to
obtain the control limits is to take the grand mean and add and subtract the product of A2 times
the mean of the sample ranges. For this data set, the value of A2 is ________.
ANSWER:
Statistical Applications in Quality Management 19-21
74. Referring to Scenario 19-7, an
X
chart is to be used for the number of blemishes. The lower
control limit for this data set is ________, while the upper control limit is ________.
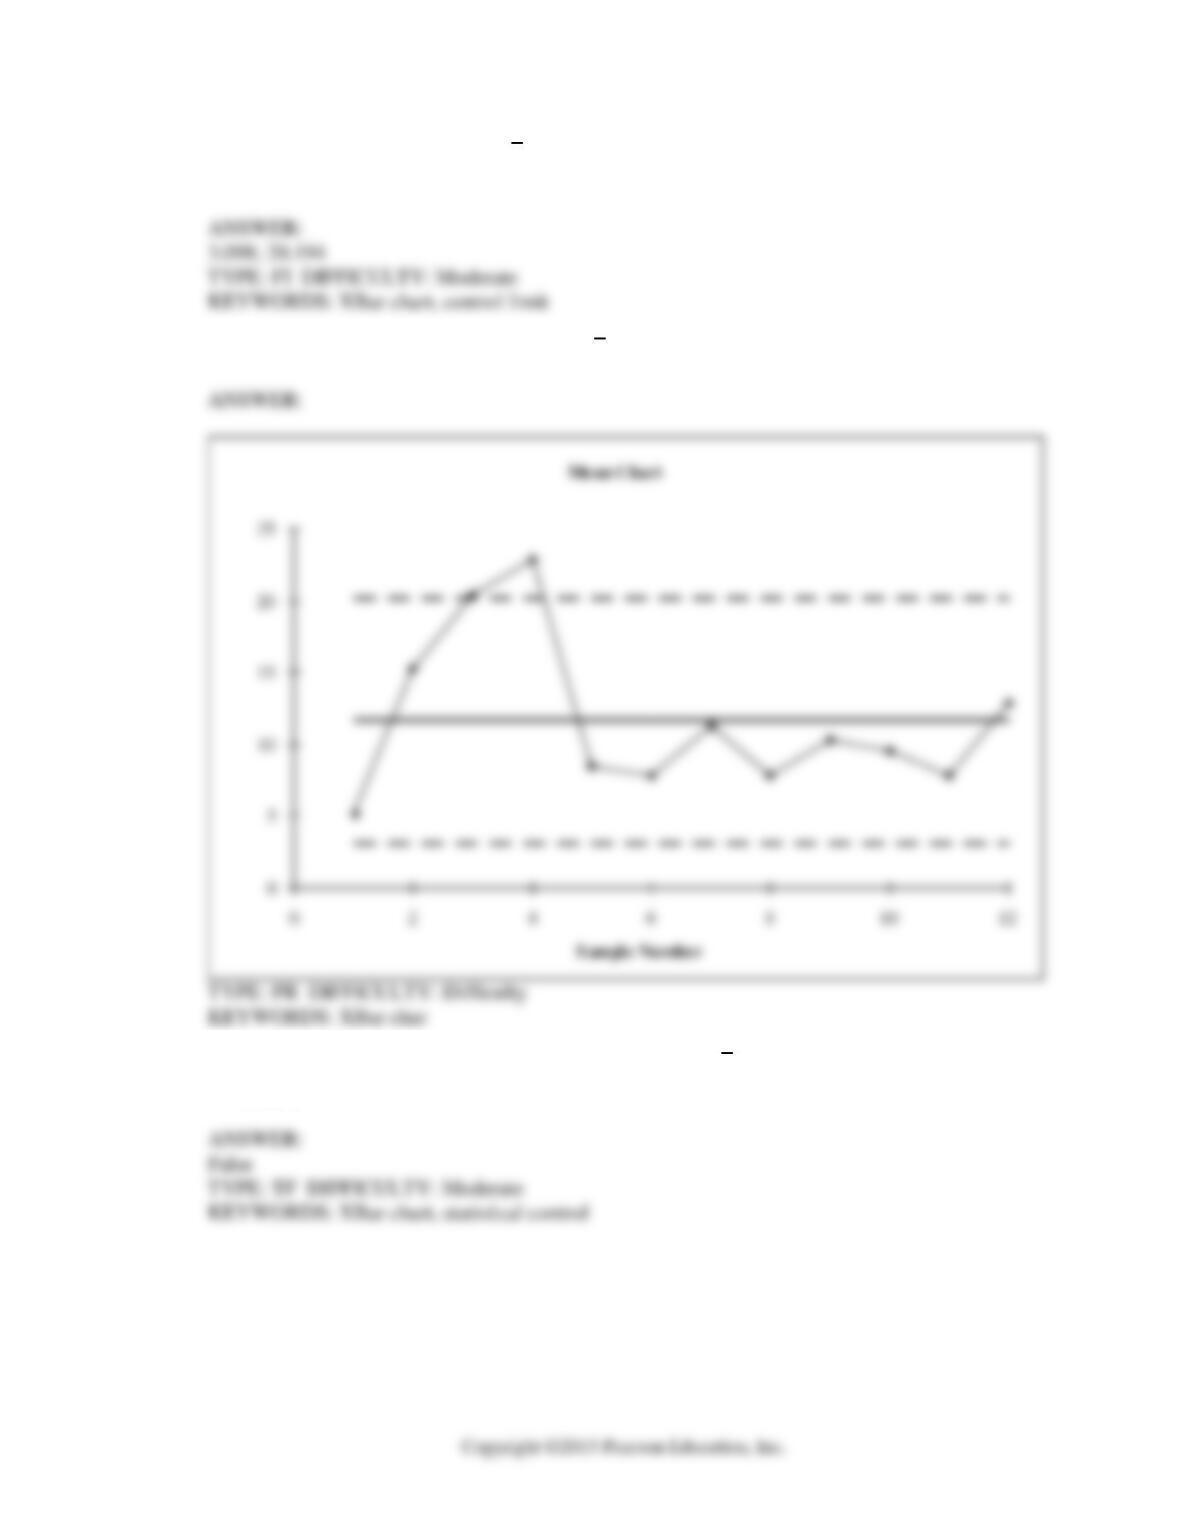
75. Referring to Scenario 19-7, construct an
X
chart for the number of blemishes.
76. True or False: Referring to Scenario 19-7, based on the
X
chart for the number of blemishes, it
appears that the process is out of control.
19-22 Statistical Applications in Quality Management
77. Referring to Scenario 19-7, what is the value of
2
d
factor?
78. Referring to Scenario 19-7, what percentage of the chips will fall below the upper specification
limit?
79. Referring to Scenario 19-7, what is the value of the CPU index?
SCENARIO 19-8
Recently, a university switched to a new type of computer-based registration. The registrar is
concerned with the amount of time students are spending on the computer registering under the new
system. She decides to randomly select 8 students on each of the 12 days of the registration and
determine the time each spends on the computer registering. The range, mean, and standard deviation
of the times required to register are in the table that follows.
Day Range Mean Std.Dev.
1 10 5.250 3.4949
2 31 15.250 10.3060
3 13 20.375 4.9262
4 21 22.875 8.3911
5 35 8.500 11.3767
6 18 7.875 6.9372
7 25 11.250 8.5815
8 30 7.875 9.5235
9 17 10.250 6.3640
10 22 9.500 7.8740
11 27 7.875 8.7086
12 26 12.875 9.3723
80. Referring to Scenario 19-8, an R chart is to be constructed for the time required to register. The
center line of this R chart is located at __________.
Statistical Applications in Quality Management 19-23
81. Referring to Scenario 19-8, an R chart is to be constructed for the time required to register. One
way to create the lower control limit involves multiplying the mean of the sample ranges by D3.
For this data set, the value of D3 is ________.
82. Referring to Scenario 19-8, an R chart is to be constructed for the time required to register. One
way to create the upper control limit involves multiplying the mean of the sample ranges by D4.
For this data set, the value of D4 is ________.
83. Referring to Scenario 19-8, an R chart is to be constructed for the time required to register. The
lower control limit for this data set is ________.
84. Referring to Scenario 19-8, an R chart is to be constructed for the time required to register. The
upper control limit for this data set is ________.
19-24 Statistical Applications in Quality Management
85. Referring to Scenario 19-8, construct an R chart for the time required to register.
86. True or False: Referring to Scenario 19-8, based on the R chart, it appears that the process is out
of control.
87. Referring to Scenario 19-8, an
X
chart is to be used for the time required to register. The center
line of this chart is located at __________.
88. Referring to Scenario 19-8, an
X
chart is to be used for the time required to register. One way to
obtain the control limits is to take the grand mean and add and subtract the product of A2 times
the mean of the sample ranges. For this data set, the value of A2 is ________.
Statistical Applications in Quality Management 19-25
89. Referring to Scenario 19-8, an
X
chart is to be used for the time required to register. The lower
control limit for this data set is ________, while the upper control limit is ________.
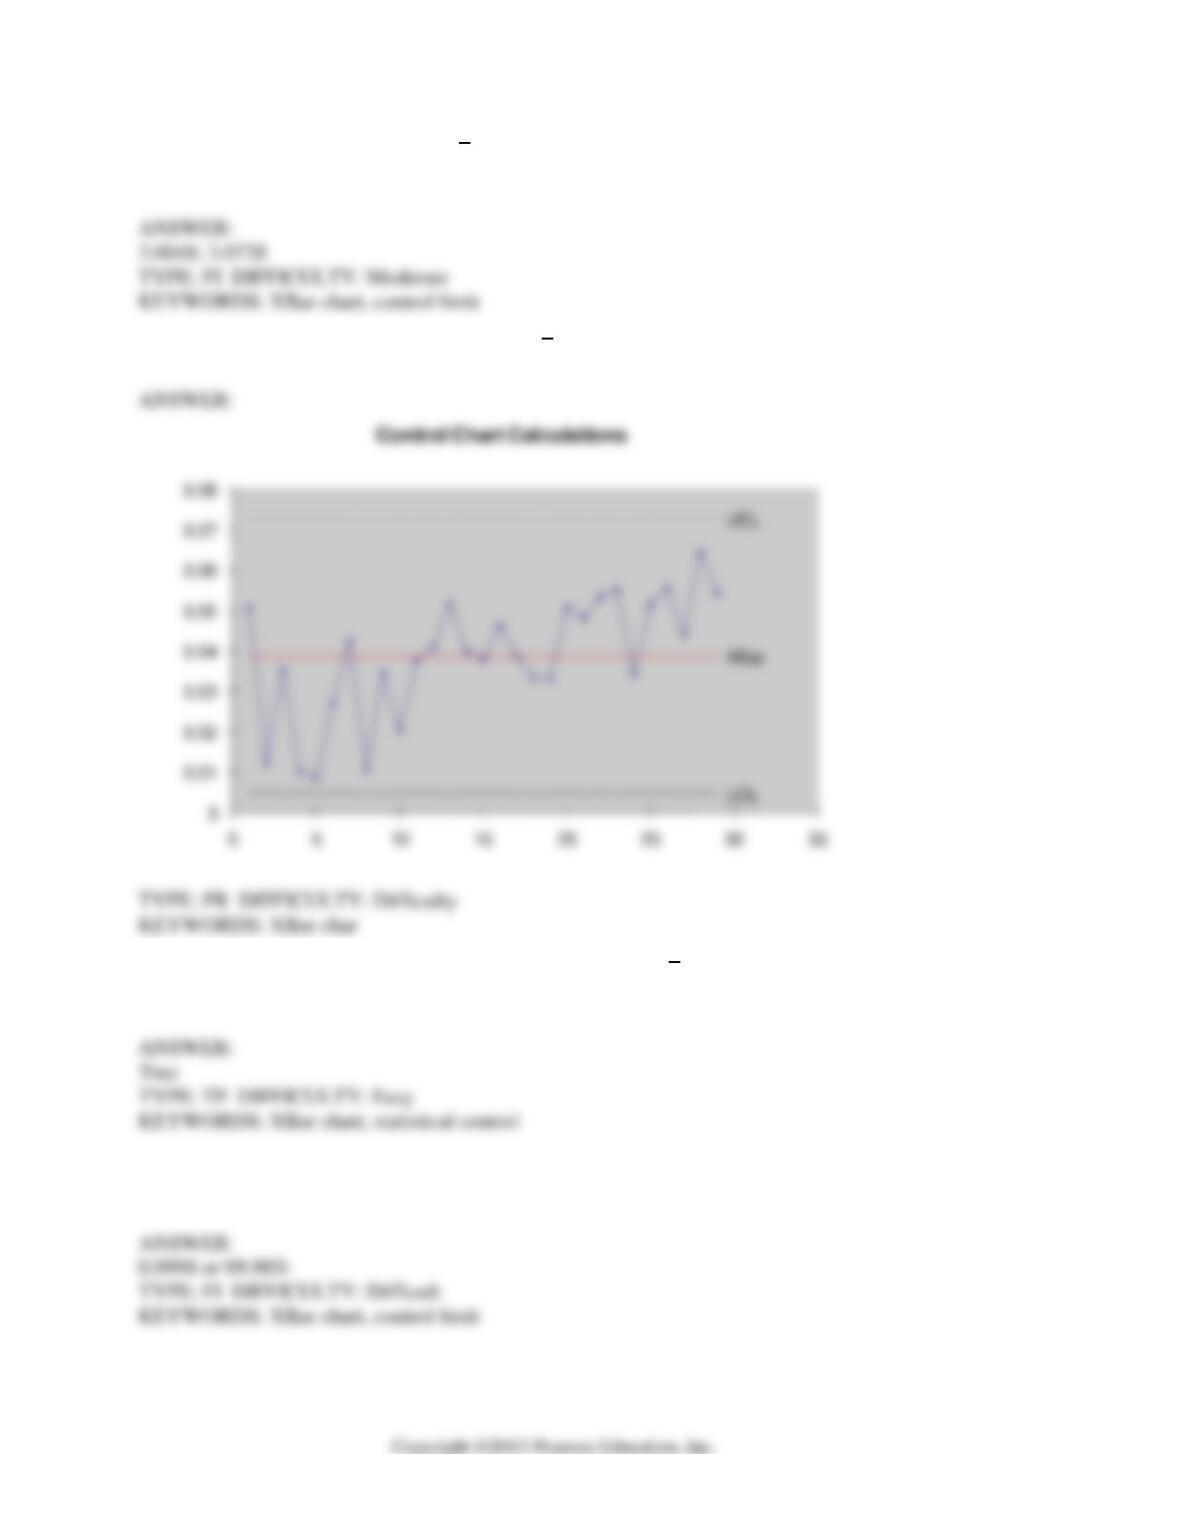
90. Referring to Scenario 19-8, construct an
X
chart for the time required to register.
91. True or False: Referring to Scenario 19-8, based on the
X
chart, it appears that the process is in
control.
19-26 Statistical Applications in Quality Management
92. Which of the following is a method for breaking process into a series of steps in order to
eliminate defects and produce near perfect results?
a) Deming’s 14 points management.
b) Six Sigma management.
c) Shewhart-Deming cycle.
d) R chart and
X
chart.
93. Which of the following is not part of the DMAIC process in Six Sigma management?
a) Define
b) Do
c) Analyze
d) Control
94. Developing operational definitions for each critical-to-quality characteristic involves which part
of the DMAIC process?
a) Define
b) Measure
c) Analyze
d) Improve
e) Control
95. Determining the root causes of why defects can occur along with the variables in the process
that cause these defects to occur involves which part of the DMAIC process?
a) Define
b) Measure
c) Analyze
d) Improve
e) Control
Statistical Applications in Quality Management 19-27
96. Maintaining the gains that have been made with a revised process in the long term by avoiding
potential problems that can occur when a process is changed involves which part of the DMAIC
process?
a) Define
b) Measure
c) Analyze
d) Improve
e) Control
97. True or False: The focus of Lean Six Sigma is on removing non-value added steps and waste
which can exist in any part of an organization.
98. True or False: SS method is among the tools of Lean Six Sigma.
99. True or False: Total Production Maintenance is among the tools of Lean Six Sigma.
100. True or False: Quick Changeover Techniques is among the tools of Lean Six Sigma.
101. True or False: Poke-Yoke devices is among the tools of Lean Six Sigma.
19-28 Statistical Applications in Quality Management
102. True or False: Champions is among the tools of Lean Six Sigma.
103. True or False: A master black belt is among the tools of Lean Six Sigma.
104. True or False: The SS method involves methods that enable participants to reduce setup time
for equipment and resources and materials needed for changeover.
105. True or False: Quick Changeover Techniques involve methods that enable participants to
reduce setup time for equipment and resources and materials needed for changeover.
106. True or False: Total Productive Maintenance focuses on methods that enable participants to
reduce setup time for equipment and resources and materials needed for changeover.
107. True or False: Mistake Proofing devices focus on methods that enable participants to reduce
setup time for equipment and resources and materials needed for changeover.
Statistical Applications in Quality Management 19-29
108. True or False: Mistake Proofing (Poke-Yoke) devices focus on preventing the causes of defects.
109. True or False: SS method focuses on preventing the causes of defects.
110. True or False: Total Productive Maintenance focuses on preventing the causes of defects.
111. True or False: SMED focuses on preventing the causes of defects.
112. True or False: The SS method establishes ways to organize necessary housekeeping aspects of a
work environment.
113. True or False: The SS method establishes ways to clean and maintain the necessary
housekeeping aspects of a work environment.
19-30 Statistical Applications in Quality Management
114. True or False: The SS method establishes ways to eliminate unnecessary housekeeping aspects
of a work environment.
115. True or False: Quick Changeover Techniques establish ways to clean and maintain the
necessary housekeeping aspects of a work environment.
116. True or False: Quick Changeover Techniques establish ways to eliminate unnecessary
housekeeping aspects of a work environment.
117. True or False: Poke-Yoke devices establish ways to clean and maintain the necessary
housekeeping aspects of a work environment.
118. True or False: Poke-Yoke devices establish ways to eliminate unnecessary housekeeping
aspects of a work environment.
119. True or False: TPM establishes ways to clean and maintain the necessary housekeeping aspects
of a work environment.
Statistical Applications in Quality Management 19-31
120. True or False: TPM establishes ways to eliminate unnecessary housekeeping aspects of a work
environment.
121. True or False: SMED establishes ways to clean and maintain the necessary housekeeping
aspects of a work environment.
122. True or False: SMED establishes ways to eliminate unnecessary housekeeping aspects of a
work environment.
123. Which of the following best measures the ability of a process to consistently meet specified
customer-driven requirement?
a) Process capability.
b) Specification limits
c) Upper control limit
d) Lower control limit
124. True or False: An in-control process must be achieved before being able to estimate process
capability.
125. True or False: A process capability is estimated by the percentage of product or service that fall
outside the specification limits.
19-32 Statistical Applications in Quality Management
126. True or False: The smaller the capability index, the more capable a process is of meeting
customer requirements.
127. True or False: The Cp index measures the potential of a process, not its actual performance.
128. True or False:
p
C
>1 indicates that if the process average can be centered, then more than
99.73% of the observations will fall inside the specification limits.
129. True or False: The CPL and CPU indexes are used to measure process’ actual performance
rather than its potential.
130. True or False: The Cpk is a one-sided specification limit.
131. True or False: CPL >1 implies that the process mean is more than 3 standard deviation away
from the lower specification limit.
Statistical Applications in Quality Management 19-33
132. True or False:
pk
C
> 1 indicates that the process average is exactly 3 standard deviations away
from the closest specification limit.
133. True or False: Larger
pk
C
indicates larger capability of meeting the requirements.
SCENARIO 19-9
The manufacturer of canned food constructed control charts and analyzed several quality
characteristics. One characteristic of interest is the weight of the filled cans. The lower specification
limit for weight is 2.95 pounds. The table below provides the range and mean of the weights of five
cans tested every fifteen minutes during a day’s production.
Number
XBar
Range
Number
XBar
Range
1
3.05072
0.0215
16
3.04646
0.073
2
3.01228
0.087
17
3.03868
0.0696
3
3.03558
0.0851
18
3.03338
0.0329
4
3.01014
0.0674
19
3.03322
0.0455
5
3.00858
0.0983
20
3.05078
0.0215
6
3.02704
0.0527
21
3.04808
0.0396
7
3.04268
0.0508
22
3.05348
0.0581
8
3.01052
0.0791
23
3.05516
0.0682
9
3.03464
0.0663
24
3.03426
0.0325
10
3.02034
0.0538
25
3.0516
0.0641
11
3.03764
0.0584
26
3.05562
0.0809
12
3.0409
0.0434
27
3.04402
0.0374
13
3.0519
0.0762
28
3.06458
0.0284
14
3.03994
0.0833
29
3.0544
0.0738
15
3.03788
0.0601
134. Referring to Scenario 19-9, an R chart is to be constructed for the weight. The center line of this
R chart is located at __________.
19-34 Statistical Applications in Quality Management
135. Referring to Scenario 19-9, an R chart is to be constructed for the weight. One way to create the
lower control limit involves multiplying the mean of the sample ranges by D3. For this data set,
the value of D3 is ________.
136. Referring to Scenario 19-9, an R chart is to be constructed for the weight. One way to create the
upper control limit involves multiplying the mean of the sample ranges by D4. For this data set,
the value of D4 is ________.
137. Referring to Scenario 19-9, an R chart is to be constructed for the weight. The lower control
limit for this data set is ________.
138. Referring to Scenario 19-9, an R chart is to be constructed for the weight. The upper control
limit for this data set is ________.
Statistical Applications in Quality Management 19-35
139. Referring to Scenario 19-9, construct an R chart for the time required to register.
140. True or False: Referring to Scenario 19-9, based on the R chart, it appears that the process is out
of control.
141. Referring to Scenario 19-9, an
X
chart is to be used for the weight. The center line of this
chart is located at __________.
142. Referring to Scenario 19-9, an
X
chart is to be used for the weight. One way to obtain the
control limits is to take the grand mean and add and subtract the product of A2 times the mean of
the sample ranges. For this data set, the value of A2 is ________.
19-36 Statistical Applications in Quality Management
143. Referring to Scenario 19-9, an
X
chart is to be used for the weight. The lower control limit for
this data set is ________, while the upper control limit is ________.
144. Referring to Scenario 19-9, construct an
X
chart for the weight.
145. True or False: Referring to Scenario 19-9, based on the
X
chart, it appears that the process is in
control.
146. Referring to Scenario 19-9, estimate the percentage of the cans whose weight is inside the
specification limit.
ANSWER:
Statistical Applications in Quality Management 19-37
SCENARIO 19-10
Below is the number of defective items from a production line over twenty consecutive morning
shifts.
Da y Nonconform a nce s Da y Non con form a nce s
126 11 22
227 12 26
323 13 21
421 14 22
526 15 19
620 16 17
735 17 21
830 18 18
921 19 16
10 25 20 17
147. Referring to Scenario 19-10, a c chart is to be constructed for the number of defective items.
The center line of this c chart is located at __________.
148. Referring to Scenario 19-10, a c chart is to be constructed for the number of defective items.
The lower control limits is ________.
149. Referring to Scenario 19-10, a c chart is to be constructed for the number of defective items.
The upper control limits is ________.
19-38 Statistical Applications in Quality Management
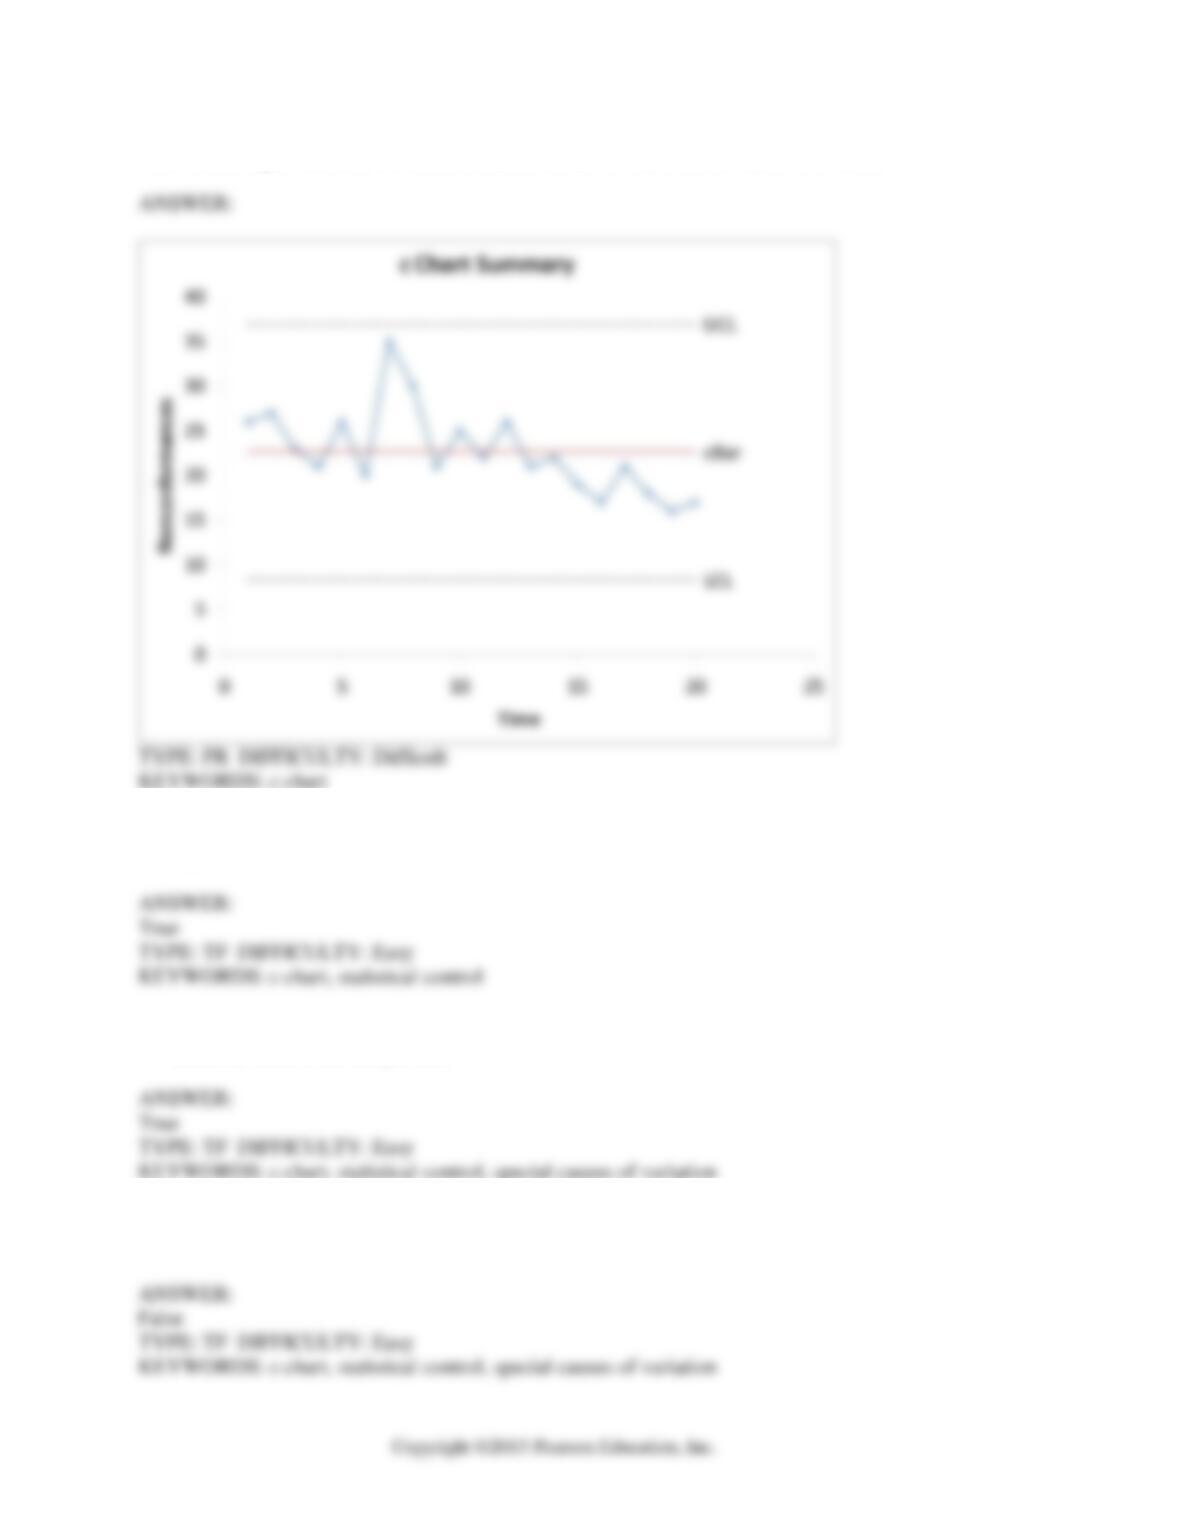
150. Referring to Scenario 19-10, construct a c chart for the number of defective items.
151. True or False: Referring to Scenario 19-10, based on the c chart, it appears that the process is
out of control.
152. True or False: Referring to Scenario 19-10, based on the c chart, there appears to be a special
cause of variation in the process.
153. True or False: Referring to Scenario 19-10, based on the c chart, no opportunity appears to be
present to render an improvement in the process.
Statistical Applications in Quality Management 19-39
154. True or False: Referring to Scenario 19-10, the c chart suggests that the special cause of
variation must be incorporated into the process to become part of the permanent ongoing process.
155. Which of the following is not one of Deming’s 14 points?
a) Belief in mass inspection.
b) Create constancy of purpose for improvement of product or service.
c) Adopt and institute leadership.
d) Drive out fear.
156. Which of the following is not one of Deming’s 14 points?
a) Create constancy of purpose for improvement of product or service.
b) Award business on the basis of price tag alone.
c) Break down barriers between staff areas.
d) Drive out fear.
157. Which of the following is not part of the Shewhart-Deming cycle?
a) Plan
b) Do
c) React
d) Act
19-40 Statistical Applications in Quality Management
158. The Shewhart-Deming cycle plays an important role in which of the following Deming’s 14
points for management?
a) Adopt the new philosophy.
b) Break down barriers between staff areas.
c) Create constancy of purpose for improvement of product and services.
d) Eliminate slogans, exhortation, and targets for the workforce.
159. Which famous statistician developed the 14 Points of Quality?
a) Shewhart
b) Deming
c) Chebyshev
d) Taguchi