Archives
BUS 102 Midterm 2
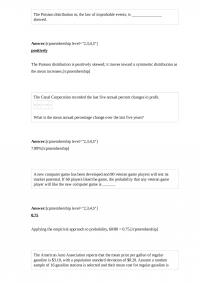
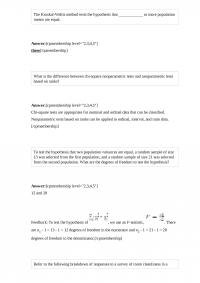
The Poisson distribution or, the law of improbable events, is _______________ skewed. The Canal Corporation recorded the last five annual percent changes in profit. What is the mean annual percentage change over the last five years? Answer: 7.89% A new […]
BUS 133 Test
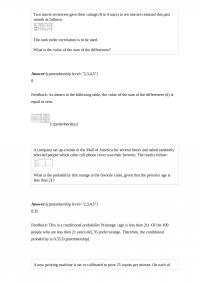
Two movie reviewers gave their ratings (0 to 4 stars) to ten movies released this past month as follows: The rank order correlation is to be used. What is the value of the sum of the differences? A company set […]
BUS 185 Test 2
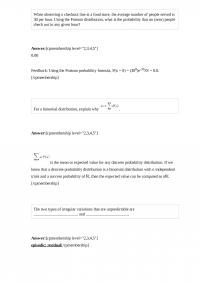
When observing a checkout line at a food store, the average number of people served is 30 per hour. Using the Poisson distribution, what is the probability that no (zero) people check out in any given hour? For a binomial […]
BUS 211
The first three class marks for a frequency distribution of “weights of college men” recorded to the nearest pound are 105, 115, and 125. What is the upper limit for the third class? The center line of a mean chart […]
BUS 225
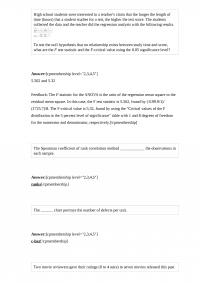
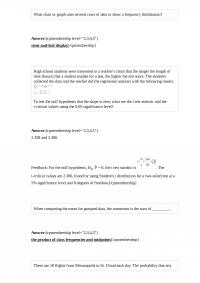
High school students were interested in a teacher’s claim that the longer the length of time (hours) that a student studies for a test, the higher the test score. The students collected the data and the teacher did the regression […]
BUS 237 Quiz 2
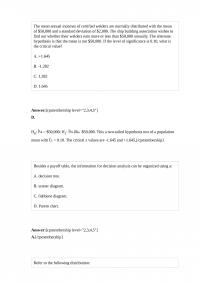
The mean annual incomes of certified welders are normally distributed with the mean of $50,000 and a standard deviation of $2,000. The ship building association wishes to find out whether their welders earn more or less than $50,000 annually. The […]
BUS 240 Test The manager of Pauls
The manager of Paul’s fruit and vegetable store is considering the purchase of a new seedless watermelon from a wholesale distributor. Since this seedless watermelon costs $4, will sell for $7, and is highly perishable, he only expects to sell […]
Bus 343 A study of 200 computer
A study of 200 computer service firms revealed these incomes after taxes: What is the probability that a particular firm selected has $1 million or more in income after taxes? A. 0.00 B. 0.25 C. 0.49 D. 0.51 What is […]
BUS 357 Quiz 3
The hypothesis to test the slope of a regression equation is H0: α = 0. A survey of 25 grocery stores revealed that the mean price of a gallon of milk was $2.98, with a standard error of $0.10. What […]
BUS 381
A total of _______ different samples of size 3 can be collected from a population of 10 items. The Nile Superstore is conducting a survey of consumer preferences for a new wireless e-book reader. A sample of 160 people reveals […]
BUS 435 Midterm 1
An airline is investigating the causes of lost bags. The following table of data was collected over the last six months. What is the reason with the highest percentage of bags is lost, and what is the percentage? The F […]
BUS 442 Quiz 1
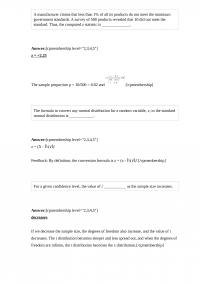
A manufacturer claims that less than 1% of all its products do not meet the minimum government standards. A survey of 500 products revealed that 10 did not meet the standard. If the computed z-statistic is -1.960 and the level […]
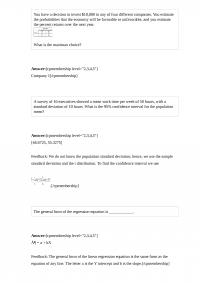
BUS 468 Test You have a decision to
You have a decision to invest $10,000 in any of four different companies. You estimate the probabilities that the economy will be favorable or unfavorable, and you estimate the percent returns over the next year. What is the maximax choice? […]
BUS 479 Midterm
The coefficient of skewness is the standard deviation divided by the mean. A cumulative frequency distribution is used when we want to determine how many observations lie above or below certain values. Answer: TRUE An example of a weighted index […]

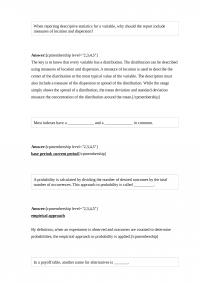
BUS 489 A random sample of 40
A random sample of 40 companies with assets over $10 million was surveyed and asked to indicate their industry and annual computer technology expense. The ANOVA comparing the average computer technology expense among three industries rejected the null hypothesis. The […]
BUS 494 Quiz 1
A researcher is studying the relationship between 10 different variables and a critical measure of business performance. What method can be used to select the best set of variables to predict performance? A. Stepwise regression B. ANOVA C. Simple linear […]
BUS 512
What can we conclude if the global test of regression rejects the null hypothesis? A. Strong correlations exist among the variables. B. No relationship exists between the dependent variable and any of the independent variables. C. At least one of […]
BUS 583
Assuming that the larger of two variances is in the numerator of an F-statistic, the rejection region to test a null hypothesis is in the _________ tail of the F distribution. A _________ sign test should be applied, if H0: […]
BUS 595 Midterm 2
A manufacturer of golf club shafts inspects 50 shafts every day. Over the last ten days, the number of defective shafts has been reported to be the following. What is the mean proportion of defective shafts? Ages (rounded to the […]
BUS 614 Quiz 2
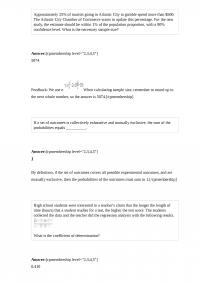
Equipment failure would be an example of ____________ variation. A. chance B. external C. assignable D. standard The result of a particular experiment is called a(n) ___________. A. Observation B. Conditional probability C. Event D. Outcome Answer: D. By definition, […]
BUS 638 Midterm 1
Two movie reviewers gave their ratings (0 to 4 stars) to seven movies released this past month as follows: The Wilcoxon signed-rank test of difference is to be used. What is your decision at the 5% level of significance? A […]
BUS 657 Final
A data set consists of 40 observations. For a quantitative variable, how many classes would you recommend for the frequency distribution? A silkscreen printing company purchases t-shirts. To ensure the quality of the shipment, 300 t-shirts are randomly selected. Fifteen […]
BUS 843 Records on a fleet of trucks
Records on a fleet of trucks reveal that the average life of a set of spark plugs is normally distributed with a mean of 22,100 miles. The fleet owner purchased 18 sets and found that the sample average life was […]
BUS 873 Final
If a trend equation is Ŷ = 15 + 75t, the periodic increase in the forecast is _____. As the sample size (n) increases, the spread or dispersion of the distribution of the sample means __________. Answer: decreases The dispersion […]
Business 167 Test
A _____ chart is useful for displaying a frequency distribution for a nominal variable. The null hypothesis for an ANOVA comparing three population means is ___________________. Answer: Feedback: We let refer to the respective population means. The null hypothesis is […]
Business 172
The “in control” region of a control chart is called the ____________________. A person is trying to decide if they should buy a lottery ticket. The ticket costs $1.00. If the ticket is a winner, the prize would be $10,000. […]
Business 179
In a survey of employee satisfaction, the following table summarizes the results in terms of employee satisfaction and gender. What is the probability that an employee is female and dissatisfied? The minimum and maximum values of the coefficient of determination […]
Business 215
High school students were interested in a teacher’s claim that the longer the length of time (hours) that a student studies for a test, the higher the test score. The students collected the data and the teacher did the regression […]
Business 263 Midterm
The minimum and maximum of values of an F statistic are _______ and ______. A ________ decision-making strategy maximizes the maximum gain. Answer: maximax LongLast Inc. produces car batteries. The mean life of these batteries is 60 months. The distribution […]
Business 292 Midterm
Which of the following is NOT one of the six steps in the hypothesis testing procedure? A. Formulate a decision rule B. State the null and alternate hypotheses C. Select a level for β D. Identify the test statistic Bones […]
Business 308
For a population that is not normally distributed, the distribution of the sample means will ________. A. Be negatively skewed B. Approach a normal distribution C. Be positively skewed D. Take the same shape as the population The following graph […]
Business 323 Midterm 1
Some normal probability distributions are positively skewed. When the payoffs are profits, the maximin strategy selects the alternative or act with the maximum gain. Answer: FALSE An interval estimate is a single value used to estimate a population parameter. Answer: […]
Business 323 Test
The interquartile range is the distance between ___________. To compute a confidence interval for a population proportion, a __________ statistic is used. Answer: z We use the z statistic or the standard normal distribution to create a confidence interval for […]
Business 394 Midterm 2
Bayes’ theorem is used to calculate a subjective probability. A population is a collection of all individuals, objects, or measurements of interest. Answer: TRUE The alternate hypothesis states that the correlation between two populations is greater than zero. The test […]
Business 434
A resort hotel performed a quarterly time series analysis for demands over the last five years (periods 1 through 20). The analysis resulted in the following trend equation and seasonal indexes: Ŷ = 1000 + 150t Based on the seasonal […]
Business 453
The trend forecast equation is Ŷ = 120 + 100t. The next forecast is for period 11. The typical seasonal index for period 11 is 0.82. What are the forecast sales for period 11? A. 1,100 B. 1,220 C. 1,000 […]
Business 455
The American Auto Association reports that the mean price per gallon of regular gasoline is $3.10, with a population standard deviation of $0.20. Assume a random sample of 16 gasoline stations is selected and their mean cost for regular gasoline […]
Business 495 Test 1
The annual dividend rates for a random sample of 16 companies in three different industries, utilities, banking, and insurance were recorded. The ANOVA comparing the mean annual dividend rate among three industries rejected the null hypothesis that the dividend rates […]
Business 496 Final
The ___________ sampling method is best to use if the population can be divided into two or more homogeneous subgroups. When we make an estimate or prediction, we use _______________. Answer: inferential statistics Inferential statistics are the methods used to […]
Business 518 Final
In a finance class, the final grade is based on three tests. Historically, the instructor tells the class that the joint probability of scoring “A”‘s on the first two tests is 0.5. A student assigns a probability of 0.9 that […]
Business 533 Quiz 2
A study by a bank compared the average savings of customers who were depositors for three years or less with those who had been depositors for more than three years. The results of a sample are: To test that the […]
Business 555
In a multiple regression equation with three independent variables, X1, X2, and X3, the interaction term is expressed as (Y)(X1). The TRUE sampling error is usually not known because ________. A. is unknown B. is a random variable C. σ2 […]
Business 559 Midterm 1
Another name for the p-bar chart is the ______________. A _________ chart portrays the number of defects per unit of production. Answer: c-bar The population correlation coefficient is represented by ____. Answer: Ï Feedback: The population correlation coefficient is represented […]
Business 593 Test 2
Over the last six months, the following numbers of absences have been reported: 6, 0, 10, 14, 8, and 0. What is the median number of monthly absences? A. 6 B. 7 C. 8 D. 3 A binomial distribution has […]
Business 607
A sample of 25 is selected from a known population of 100 elements. What is the finite population correction factor? A. 8.66 B. 75 C. 0.87 D. Cannot be determined Data for selected fruits purchased at wholesale prices for 2005 […]
Business 612
The mean of a binomial distribution is the product of n and Ï€. The variance of a binomial distribution is found by nÏ€(1 – Ï€). Answer: TRUE The “box” in a box plot shows the interquartile range. Answer: TRUE If […]
Business 723 Midterm
Data show that the weight of an offensive linesman may be any weight between 200 and 350 pounds. The distribution of weight is based on a ______________. A. continuous random variable B. discrete random variable C. qualitative variable D. All […]
Business 834
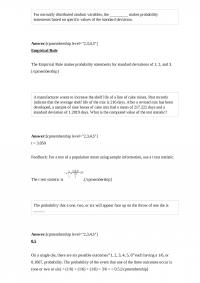
A new extended-life light bulb has an average life of 750 hours, with a standard deviation of 50 hours. If the life of these light bulbs approximates a normal distribution, about what percent of the distribution will be between 600 […]

Business 882 Quiz 1
A company’s human resources department was interested in the average number of years that a person works before retiring. The sample of size 11 follows: Based on the values of the arithmetic mean, median, and mode, what is the most […]
GP 108
A manufacturer claims that less than 1% of all its products do not meet the minimum government standards. A survey of 500 products revealed that 10 did not meet the standard. If the level of significance is 2%, the critical […]
GP 139
Two movie reviewers gave their ratings (0 to 4 stars) to seven movies released this past month as follows: The Wilcoxon signed-rank test of difference is to be used. What is the larger sum of the ranks? For the following […]
GP 166 Quiz 2
A survey item asked students to indicate their class in college: freshman, sophomore, junior, or senior. Which measure(s) of central location would be appropriate for the data generated by that questionnaire item? A. Mean and median B. Mean and mode […]
GP 403 Quiz 3
Describe the normal distribution. In a study of protein breakfast bars, five bars from each of three brands were tested to see if the mean amount of protein per bar differs among the brands. To select a critical F-statistic, the […]
GP 426 Quiz 1
One card will be randomly selected from a standard 52-card deck. The probability that it will be the jack of hearts is ____. The measurement of color is a(n) _____________. Answer: attribute A person is trying to decide if they […]
GP 448
You have four different strategic business plans you can select to implement against your competitors. You estimate that the probability that the competitors are aware of your strategies is 0.3, and 0.7 that they are unaware. The payoffs estimated for […]
GP 454
When H0: is rejected in ANOVA, we compute ____________ to identify pairs of means that differ. The human resources department of a software company encourages their employees to participate in a wellness program. They sampled 16 employees, 2 males and […]
GP 456
The college of business was interested in comparing the interaction of academic status and class time on class attendance. Three different classes were sampled for each cell in the table. The means for each cell follow. What are the error […]
GP 500
A p-value is a probability. If the computed value of F is 0.99 and the F critical value is 89, we would not reject the null hypothesis. Answer: TRUE In testing the difference between two population proportions, we pool the […]
GP 511 Midterm 1
If the alternate hypothesis states that ≠4,000, where is the rejection region for the hypothesis test? A. In both tails B. In the lower or left tail C. In the upper or right tail D. In the center A […]
GP 576 Final
In decision making, if there are one or more unknown factors, then the decision is made under conditions of uncertainty. When estimating the specific seasonals for a monthly time series, the sum of the 12 modified means should theoretically be […]
GP 589
Approximately 25% of tourists going to Atlantic City to gamble spend more than $500. The Atlantic City Chamber of Commerce wants to update this percentage. For the new study, the estimate should be within 1% of the population proportion, with […]
GP 614 Quiz
If a data set of 10 observations is used in a multiple regression analysis with 10 independent variables, then ____________. A. R2 will be equal to 1.0 B. The multiple standard error of the estimate will be 1.0 C. The […]
GP 668 Final
Product sales since 2001 are: The least squares trend equation is given as: Ŷ = 100 + 28t, where t is set equal to 1 for 2001. What were the predicted sales in 2006? A geometric mean is useful to […]
GP 709 Test 1
A study conducted by a local tennis center revealed that 25 percent of its new members have novice level tennis skills. A membership drive in a metropolitan area resulted in 500 new members. What is the probability that 110 or […]
GP 826 Quiz 1
The least squares technique minimizes the sum of the squares of the vertical distances between the actual Y values and the predicted values of Y. If 95% and 98% confidence intervals were developed to estimate the Answer: TRUE cost of […]
GP 893 Homework
For a normal distribution, what is the likelihood (expressed as a percentage) that a random variable is within plus and minus two standard deviations of the mean? A. 68.26% B. 99.74% C. 34.13% D. 95.44% The following partial ANOVA table […]
GSM 121 Quiz
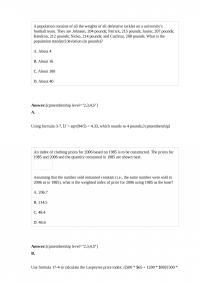
A population consists of all the weights of all defensive tackles on a university’s football team. They are Johnson, 204 pounds; Patrick, 215 pounds; Junior, 207 pounds; Kendron, 212 pounds; Nicko, 214 pounds; and Cochran, 208 pounds. What is the […]
GSM 128 Quiz 2
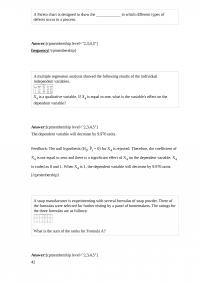
A Pareto chart is designed to show the ____________ in which different types of defects occur in a process. A multiple regression analysis showed the following results of the individual independent variables. X4 is a qualitative variable. If X4 is […]
GSM 255
To verify that an observed frequency distribution is normally distributed, a ________ statistic is used to test the hypothesis that the sample data is normally distributed. The test statistic used to compare two variances is the ___________ statistic. Answer: F-statistic […]
GSM 269 Test 2
We are interested in knowing if the following frequency distribution is normally distributed. The population mean and standard deviation of the data are 600 and 160, respectively. If the distribution was normally distributed, what is the probability that an observation […]
GSM 289 Midterm
A manufacturer of automobile transmissions uses three different processes. Management ordered a study of the production costs to see if there is a difference among the three processes. A summary of the findings is shown next. In an ANOVA table, […]
GSM 300 Test 2
The binomial probability distribution is always negatively skewed. An example of a dummy variable is “time to product’s first repair” in years. Answer: FALSE A dummy variable is most commonly a nominal variable such as gender (male or female). A […]
GSM 337 Test 1
A useful method for eliminating fluctuations in a time series is computing a ______. From past history, the scores on a statistics test are normally distributed with a mean score of 70 and a standard deviation of 5. To earn […]
GSM 440 Quiz 2
The F distribution is a ______________ distribution. The following is an example of a ___________________________. Answer: contingency table A contingency table summarizes the relationship between two nominal-level variables. Perfect correlation means that the scatter diagram will appear as a _____________. […]
GSM 496 Final
One function of the CPI is to allow consumers to determine the degree to which their purchasing power is being eroded by price increases. A student scored in the 85th percentile on a standardized test. This means that the student […]
GSM 522 Quiz
When doing research, knowing the population mean and other population parameters is essential. The 50th percentile of a distribution is the same as the distribution mean. Answer: FALSE The 50th percentile is the same as the median. As a general […]
GSM 525 Quiz 2
If the variance of the “number of daily parking tickets issued is 100, the standard deviation is defined as the _____________. A. “Number of daily parking tickets” B. “Number of daily parking tickets” squared C. Absolute value of the variance […]
GSM 605
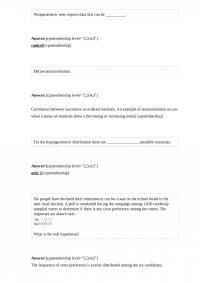
The proportion of explained variation is called the _______________. Six people have declared their intentions to run for a seat on the school board in the next local election. A poll is conducted during the campaign among 1,020 randomly sampled […]
GSM 615 Midterm 1
A marketing research agency was hired to test a new DVD player. Consumers rated it outstanding, very good, fair, or poor. The level of measurement for this experiment is ordinal. For any distribution, there are an equal number of values […]
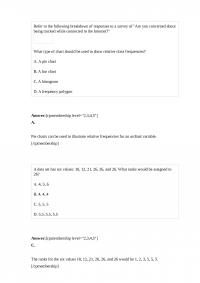
GSM 623 Test 2
Refer to the following breakdown of responses to a survey of “Are you concerned about being tracked while connected to the Internet?” What type of chart should be used to show relative class frequencies? A. A pie chart B. A […]
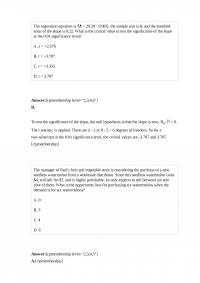
GSM 643
The regression equation is Ŷ = 29.29 – 0.96X, the sample size is 8, and the standard error of the slope is 0.22. What is the critical value to test the significance of the slope at the 0.01 significance level? […]
GSM 644 Quiz
A scatter diagram of sales versus production is labeled with sales on the Y-axis and production on the X-axis. There are two general types of causes of variations in manufacturing and service processes: chance and assignable causes. Answer: TRUE A […]
GSM 712 Midterm
When observing a checkout line at a food store, the average number of people served is 30 per hour. Using the Poisson distribution, what is the standard deviation of the number of people served in an hour? One of the […]
GSM 762 Test 1
A fishbone diagram starts with the definition of a problem and explores its possible ________. Sampling from a population may be preferred, because studying all the items in a population may be too ____________. Answer: cost/time consuming Collecting data is […]
GSM 826
A confidence interval becomes narrower when the sample size _________. In multiple regression analysis, a correlation matrix is used to check for ___________. Answer: multicollinearity Multicollinearity exists when independent variables are correlated. You can check for multicollinearity by computing all […]
GSM 842 Midterm
The Laspeyres method uses the amounts consumed in the base period, q0, as weights to determine a price index. A scatter diagram of sales versus production may be constructed by plotting the minimum, first quartile, median, third quartile, and maximum […]
GSM 869 Midterm 1
A manufacturer claims that less than 1% of all its products do not meet the minimum government standards. A survey of 500 products revealed that 10 did not meet the standard. Thus, the computed z statistic is ______________. The formula […]
GSM 874 Test 1
How can you describe the moving average method? A. A method that smoothes out a time series. B. A method to deseasonalize a time series. C. A technique that results in a trend line equation. D. A method for computing […]
MG 131 Test 2
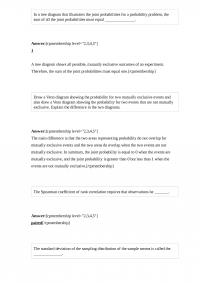
In a tree diagram that illustrates the joint probabilities for a probability problem, the sum of all the joint probabilities must equal _______________. Draw a Venn diagram showing the probability for two mutually exclusive events and also draw a Venn […]
MG 165 Midterm
The multiple coefficient of determination, R2, reports the proportion of the variation in Y that is not explained by the variation in the set of independent variables. The alternative hypothesis used in ANOVA is H1: All population means are equal. […]
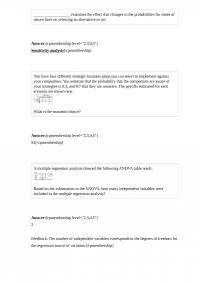
MG 309 Midterm
__________________ examines the effect that changes in the probabilities for states of nature have on selecting an alternative or act. You have four different strategic business plans you can select to implement against your competitors. You estimate that the probability […]
MG 330 Quiz 2
When reporting descriptive statistics for a variable, why should the report include measures of location and dispersion? Most indexes have a _____________ and a ______________ in common. Answer: base period; current period A probability is calculated by dividing the number […]
MG 385
For the sampling distribution of sample means, sampling error will decrease as sample size increases. The arithmetic mean is the sum of the quantitative observations divided by the total number of observations. Answer: TRUE The Laspeyres method computes a weighted […]
MG 385 Test
A company’s human resources department was interested in the average number of years that a person works before retiring. The sample of size 11 follows: What is the mode? A company wants to study the effect of an employee’s length […]
MG 391
The Kruskal-Wallis method tests the hypothesis that ____________ or more population means are equal. What is the difference between chi-square nonparametric tests and nonparametric tests based on ranks? Answer: Chi-square tests are appropriate for nominal and ordinal data that can […]
MG 483 Quiz 1
What chart or graph uses several rows of data to show a frequency distribution? High school students were interested in a teacher’s claim that the longer the length of time (hours) that a student studies for a test, the higher […]
MG 567
For normally distributed random variables, the _________ makes probability statements based on specific values of the standard deviation. A manufacturer wants to increase the shelf life of a line of cake mixes. Past records indicate that the average shelf life […]
MG 679 Midterm
Nonparametric tests require data that can be __________. Define autocorrelation. Answer: Correlation between successive or ordered residuals. An example of autocorrelation occurs when a series of residuals show a decreasing or increasing trend. For the hypergeometric distribution there are ________________ […]
MG 695 Test 2
For a frequency distribution of qualitative data, if the observations can be assigned to only one class, the classes are __________________________. The _____________ method is useful in smoothing out a time series. Answer: moving average An ANOVA comparing the waiting […]
MG 741
Two movie reviewers gave their ratings (0 to 4 stars) to seven movies released this past month as follows: The Wilcoxon signed-rank test of differences is used. What is the null hypothesis? A New York newspaper reported the average gasoline […]
MG 787
Which probability distribution is used to develop a percent defective chart? A. Normal distribution B. Chi-square distribution C. Poisson distribution D. Binomial distribution Based on the Nielsen ratings, the local CBS affiliate claims its 11 p.m. newscast reaches 41% of […]
MG 860 Quiz 1
Two business major students, in different sections of an economics class, were comparing test scores. The following shows the sections’ mean and standard deviation. The student in section 1 scored 84. The student’s z score would be _________. About ______% […]
MOB 157 Quiz 2
Which of the following statements about causes of variation are TRUE? I. Assignable variation is random in nature and cannot be eliminated or reduced. II. Chance variation cannot be completely eliminated unless there are significant methods, techniques, or equipment used […]
MOB 179
Assume a student received the following grades for the semester: History, B; Statistics, A; Spanish, C; and English, C. History and English are 5 credit-hour courses, Statistics a 4 credit-hour course, and Spanish is a 3 credit-hour course. If 4 […]
MOB 241 Quiz 1
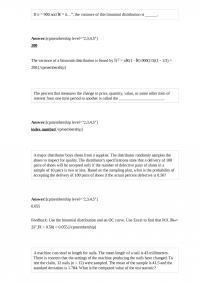
If n = 900 and Ï€ = â…“, the variance of this binomial distribution is ______. The percent that measures the change in price, quantity, value, or some other item of interest from one time period to another is called […]
MOB 246 Test 1
The Kruskal-Wallis one-way analysis of variance by ranks is especially appropriate to test whether three or more population means are equal if the data is measured with an ordinal scale and/or the populations are not normal. A point estimate is […]
MOB 282 Final
If the binomial distribution is used to develop an operating characteristic curve for an acceptance sampling plan, then the trials must be ________________. A bottle cap manufacturer with four machines and six operators wants to see if variation in production […]
MOB 346 Quiz 3
Suppose you toss a coin four times and get heads four times (no tails). The probability that heads will appear on the next toss of the coin is ____. If the coefficient of determination is 0.81, the coefficient of correlation […]
MOB 357
Using the following regression analysis: What is the F-statistic for the ANOVA? We are interested in knowing if the following frequency distribution is normally distributed. The population mean and standard deviation of the data are 600 and 160, respectively. If […]
MOB 376 Test 2
If the null hypothesis states that there is no difference between the mean net income of retail stores in Chicago and New York City, then the test is two-tailed. To determine the size of a sample, the standard deviation of […]
MOB 401
In a two-way ANOVA, when is an interaction source of variance included? A company wants to estimate next year’s total revenue. Why is an interval estimate preferred to a point estimate? Answer: An interval estimate provides a range of possible […]
MOB 431 Quiz 2
Complete the following analogy: An experiment relates to outcome, as the role of a die relates to _____. A company set up a kiosk in the Mall of America for several hours and asked randomly selected people which color cell […]
MOB 462
When independent samples are used to test for differences in the population means with equal but unknown population standard deviations, we _______ these sample standard deviations. The following stem-and-leaf display reports the number of boats shipped per week by Ottertail […]
MOB 538 Homework
The national sales manager for “I colored this” (ICT) T-shirts provides all salespersons with the payoff table shown next, giving the estimated profit when a retailer purchases from one to four dozen T-shirts. The probability of demand for each state […]
MOB 622
In a market research study involving 11 people, 7 preferred Product X, 3 preferred Product Y, and 1 expressed no preference. A sign test is selected using the 0.05 level of significance. What is the alternate hypothesis? When dependent samples […]
MOB 687 Test
There are 10 AAA batteries in a box and 3 are defective. Two batteries are selected without replacement. What is the probability of selecting a defective battery followed by another defective battery? A. or 0.50 B. or 0.25 C. 1/120 […]
MOB 761 Quiz 2
A survey of property owners’ opinions about a street-widening project was taken to determine if owners’ opinions were related to the distance between their home and the street. A randomly selected sample of 100 property owners was contacted and the […]
MSC 123
Suppose your annual 2005 salary was $95,000 and your 2010 salary was $125,000. Assume the annual CPI rose from 177.1 to 215.9 during this period of time. What was the purchasing power of the dollar in 2010? The _______________ principle […]
MSC 130 Quiz 3
Two movie reviewers gave their ratings (0 to 4 stars) to ten movies released this past month as follows: The rank order correlation is to be used. What is the rank order correlation? A test statistic for a hypothesis, H0: […]
MSC 181 Quiz 1
The standard error of the mean is also called the sampling error. In the numerator of a value index, the price and quantity are both from the current period. Answer: TRUE A survey of 50 retail stores revealed that the […]
MSC 258 Midterm 2
The college of business was interested in comparing the attendance for three different class times for a business statistics class. The data follow. What is the treatment variable? A. Day B. Class time C. Tuesday D. 8:00 a.m. class The […]
MSC 337
The manager of Paul’s fruit and vegetable store is considering the purchase of a new seedless watermelon from a wholesale distributor. Since this seedless watermelon costs $4, will sell for $7, and is highly perishable, he only expects to sell […]
MSC 376
Suppose your annual 2001 salary was $40,000 and your 2006 salary was $52,000. Assume the annual CPI rose from 177.1 to 202.9 during this period of time. What was the purchasing power of the dollar in 2001? When the special […]
MSC 470
A continuous random variable can assume one of a(n) ____________ number of values within a specific range. Draw a negatively or positively skewed distribution and show the relative locations of the mean, median, and mode. Answer: See the text for […]
MSC 473
The shape of the uniform distribution is ___________. The waiting time for patients at a local walk-in health clinic follows a normal distribution with a mean of 15 minutes and a population standard deviation of 5 minutes. The quality-assurance department […]
MSC 485
A __________ analysis is used to develop an equation that predicts an outcome based on two or more independent variables. A study conducted by a local tennis center revealed that 25 percent of its new members have novice level tennis […]
MSC 538
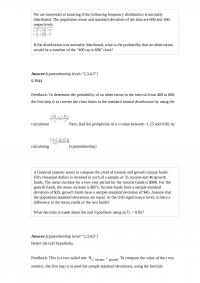
An assumption of linear regression states that for each value of X, there is a group of Y values that are statistically __________________ and normally distributed about the regression line. A soap manufacturer is experimenting with several formulas of soap […]
MSC 550
A test statistic is a value computed from sample information that is used to test the null hypothesis. When sampling is done without replacement and the outcomes are measured as either a success or failure, the hypergeometric distribution should be […]
MSC 559 Test 1
The manager of Paul’s fruit and vegetable store is considering the purchase of a new seedless watermelon from a wholesale distributor. Since this seedless watermelon costs $4, will sell for $7, and is highly perishable, he only expects to sell […]
MSC 586 Test 2
The first three class marks for a frequency distribution of “weights of college men” recorded to the nearest pound are 105, 115, and 125. What is the lower limit for the third class? A company wants to study the effect […]
MSC 604
The Greek letter used to represent the probability of a Type I error is alpha (α). A simple aggregate index compares the sum of values in the current period to the sum of values in a base period. Answer: TRUE […]
MSC 613
For a one-tailed test with a 0.05 level of significance, the critical z statistic is 1.645, but the critical t statistic is 1.96. An expected opportunity loss can only be greater than or equal to zero. Answer: TRUE The probability […]
MSC 673 Test 1
The chi-square test statistic used in a goodness-of-fit test has k – 1 degrees of freedom. Pearson’s coefficient of skewness is a measure of a distribution’s symmetry. Answer: TRUE In a Poisson distribution, the probability of success may vary from […]
MSC 753
What is a normal distribution with a mean of 0 and a standard deviation of 1 called? A. Frequency distribution B. Z-score C. Standard normal distribution D. Binomial probability distribution Which of the following is NOT a characteristic of a […]
MSC 822 Midterm 1
For a given set of 12 ranked data values, the sum of the squared differences is 63.18. What is the test statistic value to test the hypothesis that the rank correlation coefficient is zero? A. 0.221 B. 0.673 C. 0.779 […]