The minimum and maximum of values of an F statistic are _______ and ______.
A ________ decision-making strategy maximizes the maximum gain.
LongLast Inc. produces car batteries. The mean life of these batteries is 60 months. The
distribution of the battery life closely follows the normal probability distribution with a
standard deviation of eight months. As a part of its testing program, LongLast tests a
sample of 25 batteries. What proportion of the samples will have a mean useful life less
than 56 months?
The mean of a normal probability distribution is 60 and the standard deviation is 5. The
percent of observations that are between 50 and 70 is ______.

A bottle cap manufacturer with four machines and six operators wants to see if variation
in production is due to the machines and/or the operators. The ANOVA table follows.
Test the hypothesis that all operators are equally productive. State your decision in
terms of the null hypothesis.
A bottle cap manufacturer with four machines and six operators wants to see if variation
in production is due to the machines and/or the operators. The ANOVA table follows.
What are the degrees of freedom for the errors?
The Dow Jones Industrial Index is a ____________________.
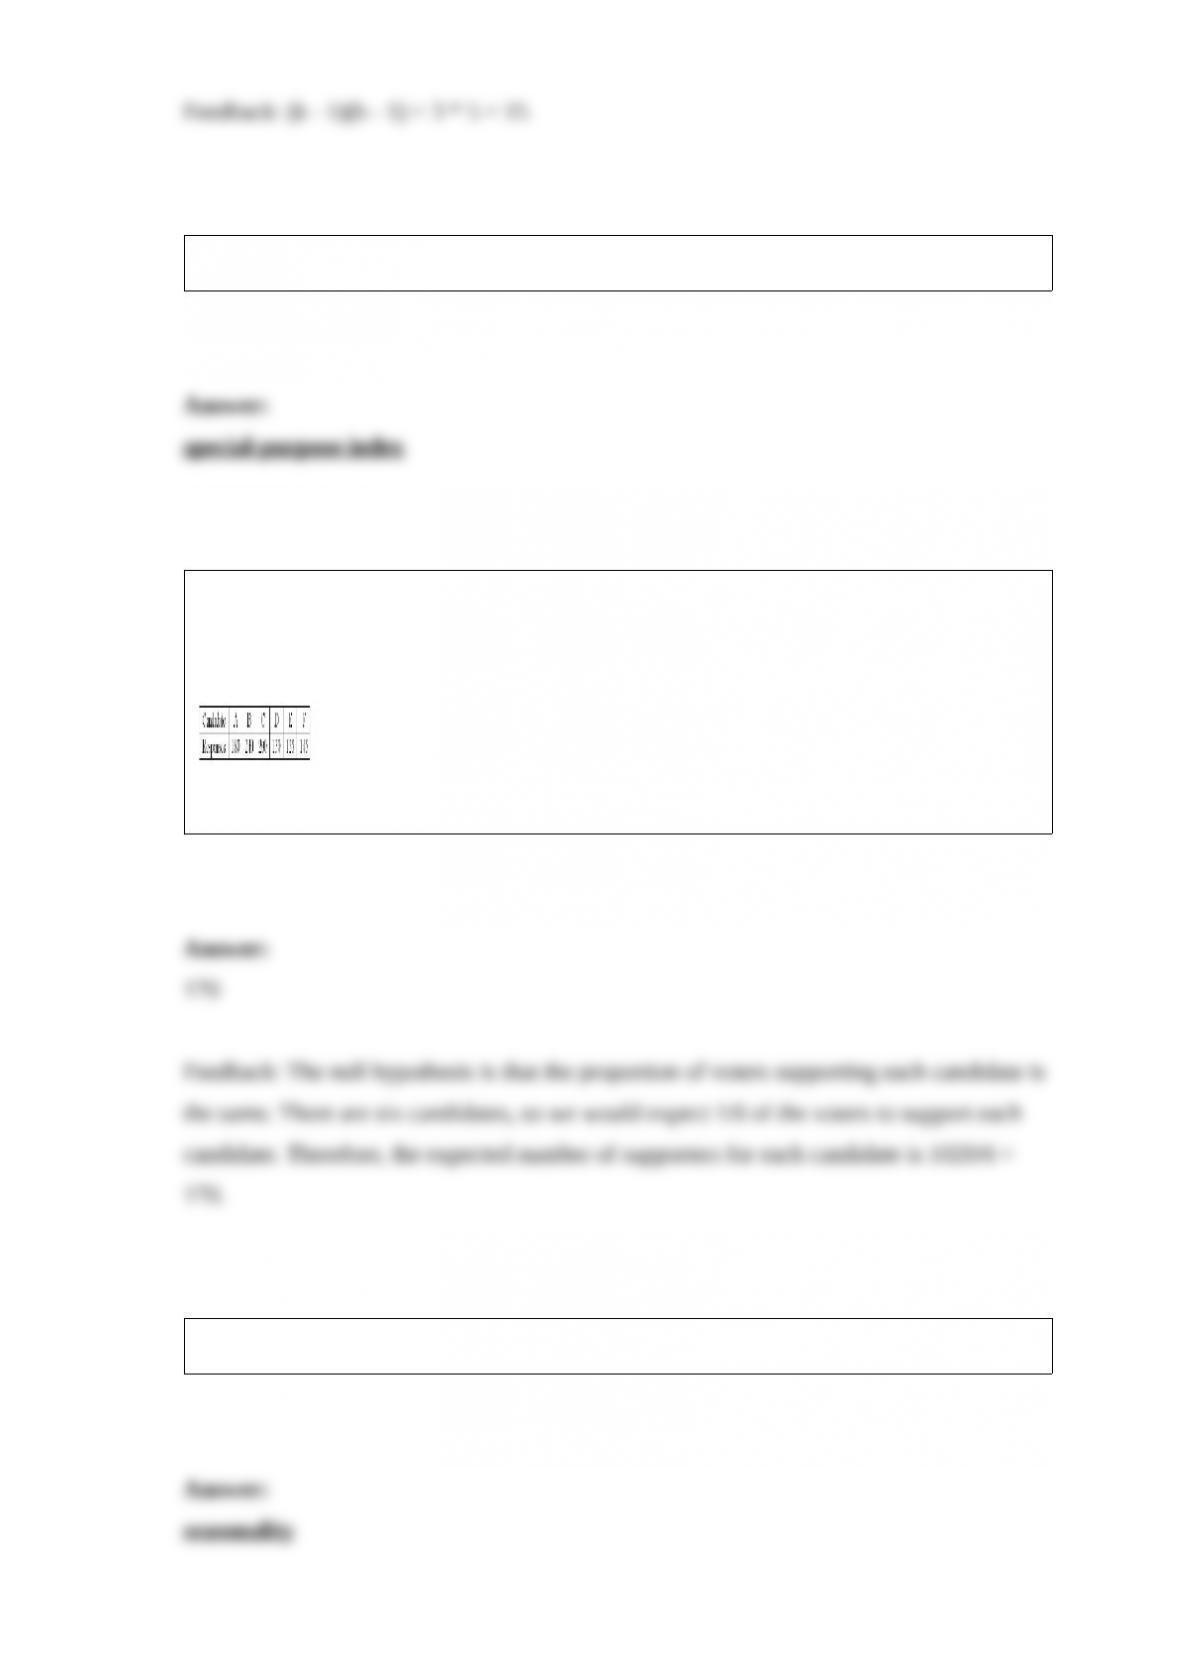
Six people have declared their intentions to run for a trustee seat in the next local
election. A political poll is conducted during the campaign among 1,020 randomly
sampled voters to determine if there is any clear preference among the voters. The
responses are shown next.
What is the expected frequency for each candidate?
A graph of a deseasonalized time series does NOT show ________.

In 2000, an executive earned $100,000. In 2009, the executive earned $125,000. The
CPI in 2000 was 172.2, and the CPI in 2009 was 214.537. Using the CPI base,
1982-1984 = 100, what was the increase in real income from 2000 to 2009?