The “in control” region of a control chart is called the ____________________.
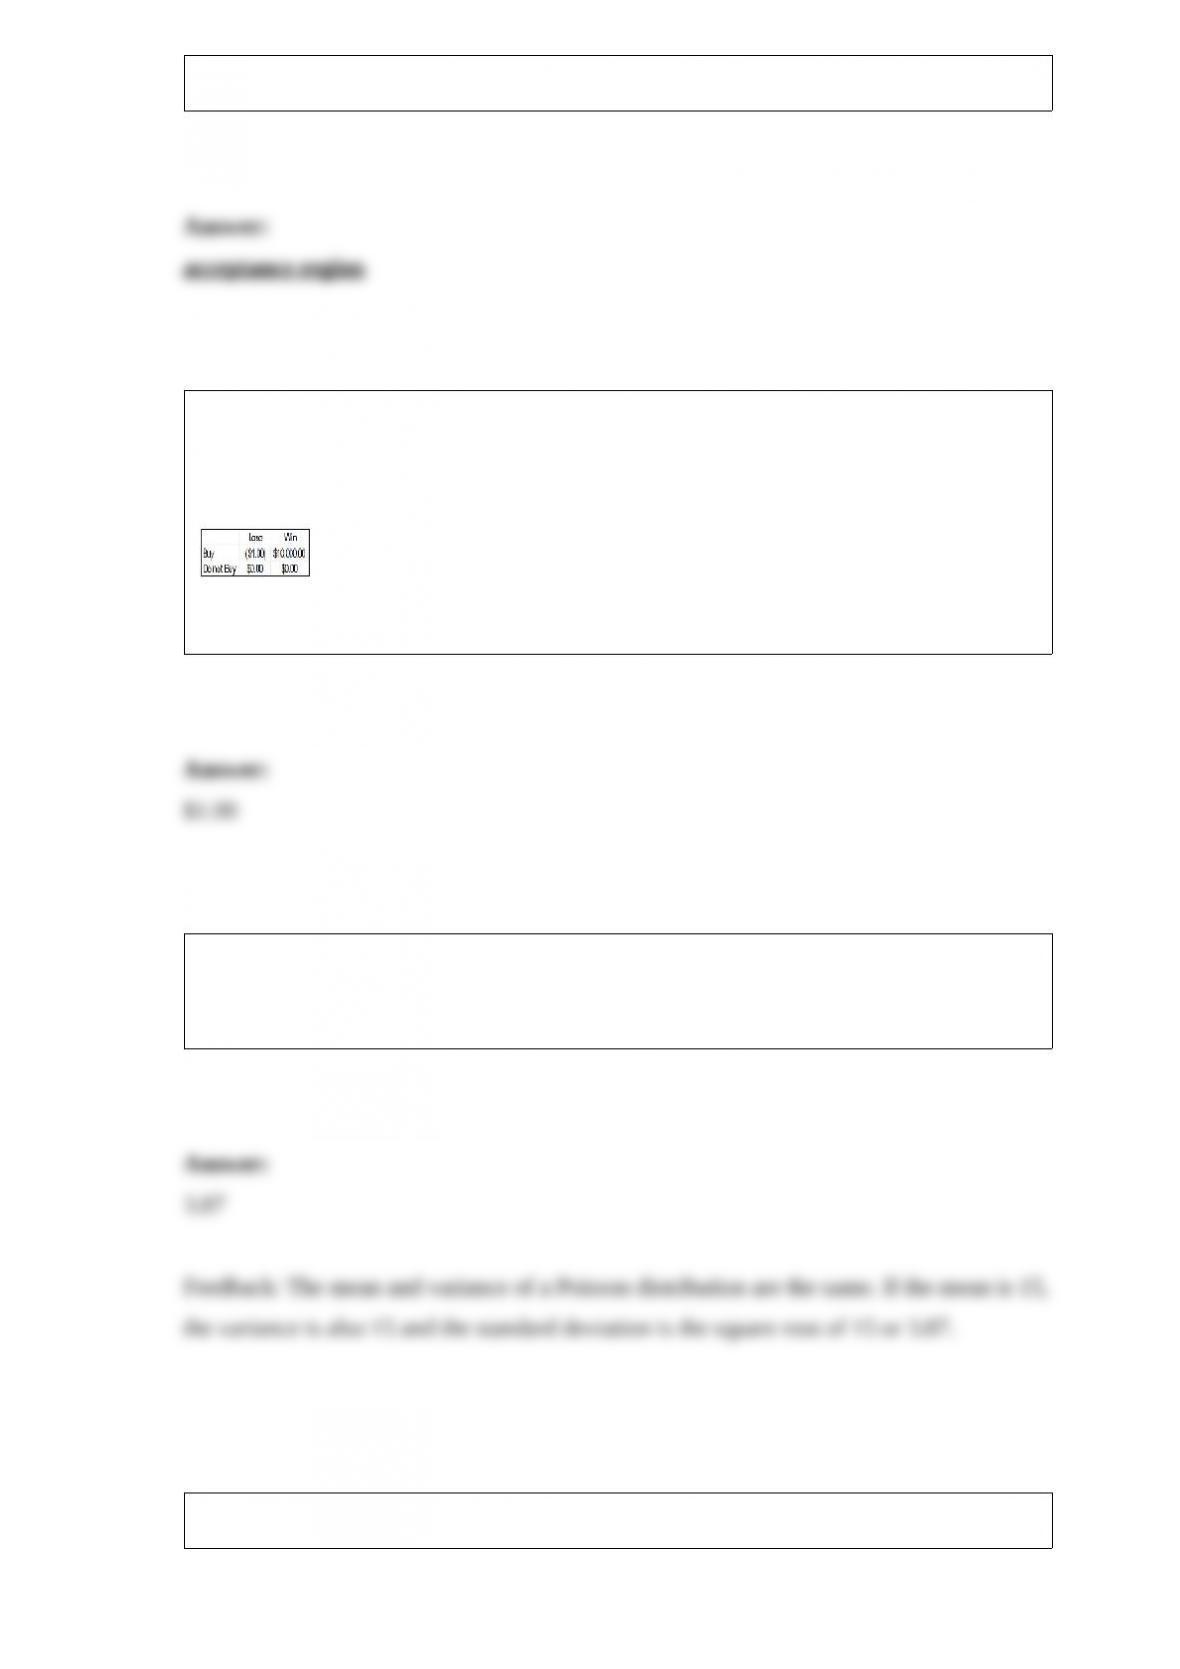
A person is trying to decide if they should buy a lottery ticket. The ticket costs $1.00. If
the ticket is a winner, the prize would be $10,000. Knowing that winning $10,000 is not
a certain outcome (state of nature), the person finds that the probability of winning is
0.0009. Based on this information, the following payoff table can be constructed.
What is the value of perfect information?
When observing a checkout line at a food store, the average number of people served is
15 per hour. Using the Poisson distribution, what is the standard deviation of the
number of people served in an hour?
Ranked data is an example of a(n) ____________ level of measurement.
A statistical quality control chart that is out of control shows what a(n) ___________
variation.