Unlock document.
This document is partially blurred.
Unlock all pages and 1 million more documents.
Get Access
What chart or graph uses several rows of data to show a frequency distribution?
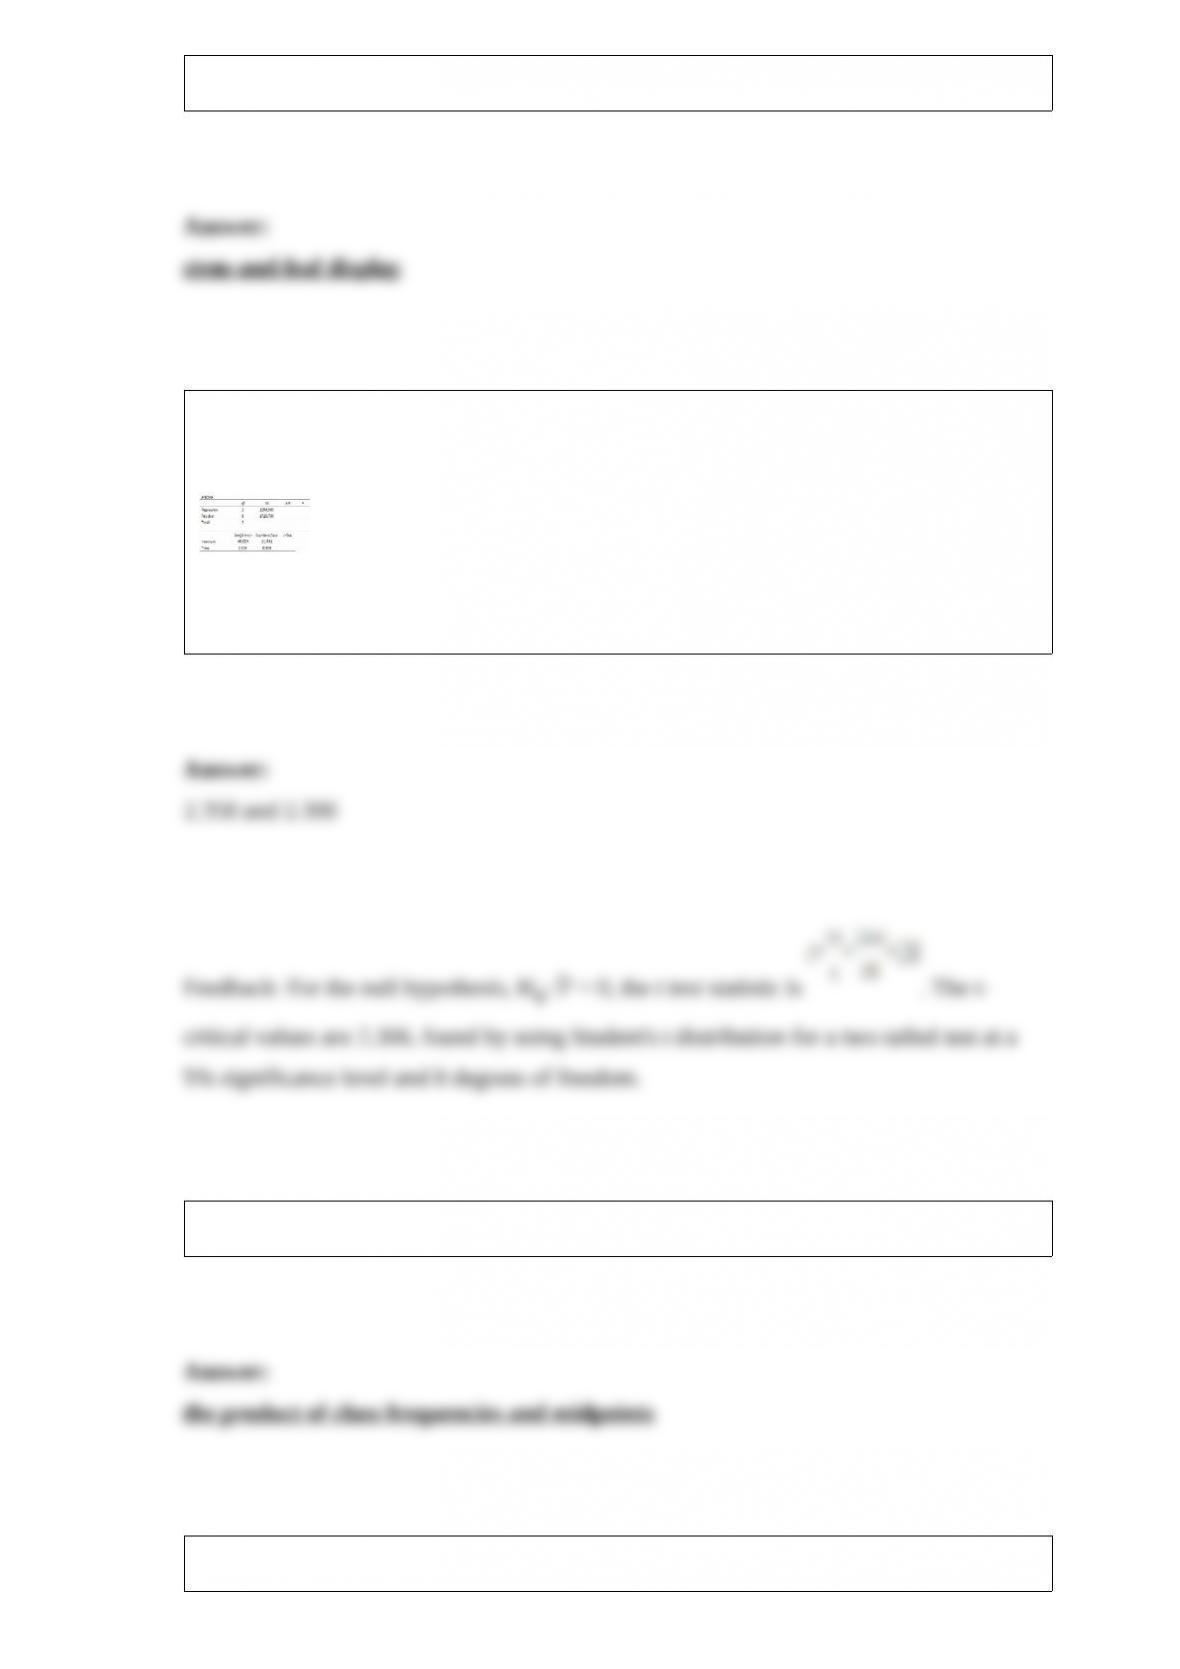
High school students were interested in a teacher's claim that the longer the length of
time (hours) that a student studies for a test, the higher the test score. The students
collected the data and the teacher did the regression analysis with the following results.
To test the null hypothesis that the slope is zero, what are the t test statistic and the
t-critical values using the 0.05 significance level?
When computing the mean for grouped data, the numerator is the sum of _________.
There are 10 flights from Minneapolis to St. Cloud each day. The probability that any
one flight is late is 0.05. Using the binomial probability formula, what is the probability
that none are late?
For a two-tailed hypothesis test, the computed test statistic is z = 1.42. What is the
p-value?
The _____________ of the differences between "before and after" measurements is
evaluated in a Wilcoxon signed-rank test.


