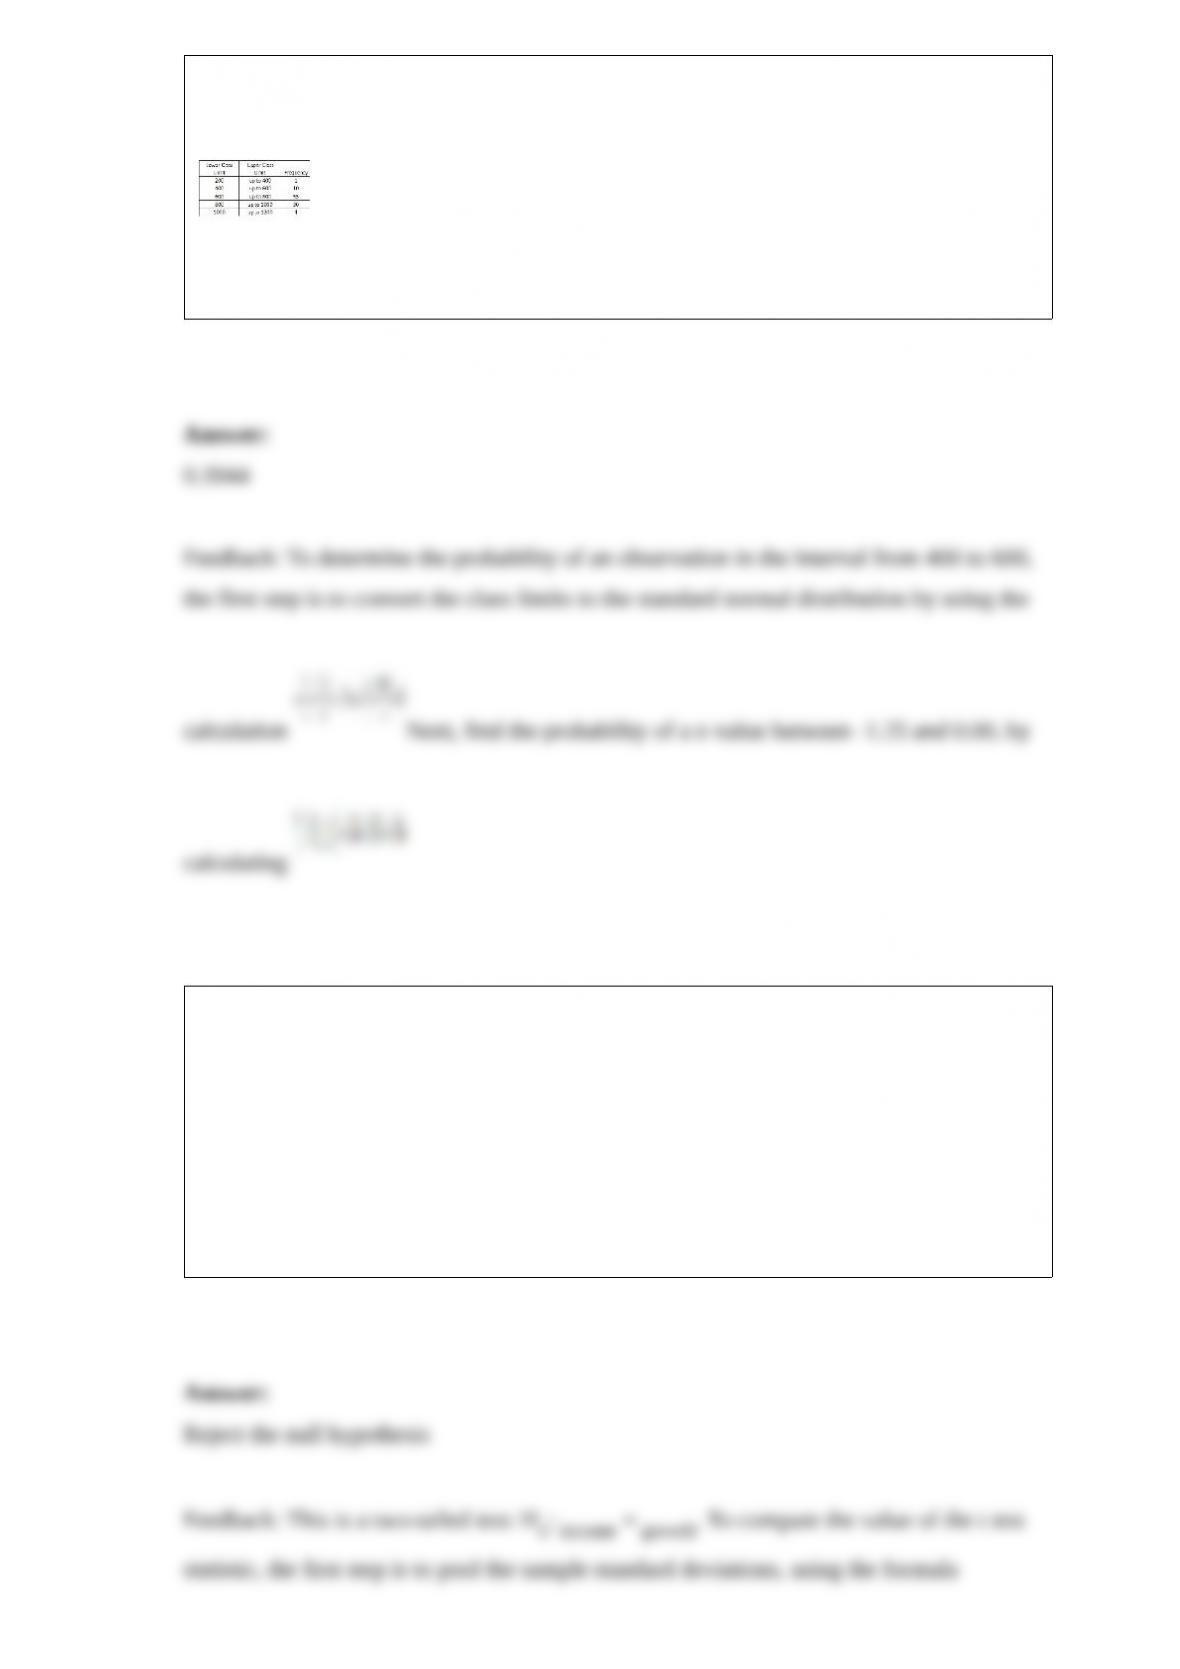
We are interested in knowing if the following frequency distribution is normally
distributed. The population mean and standard deviation of the data are 600 and 160,
respectively.
If the distribution was normally distributed, what is the probability that an observation
would be a member of the “400 up to 600” class?
A financial planner wants to compare the yield of income and growth mutual funds.
Fifty thousand dollars is invested in each of a sample of 35 income and 40 growth
funds. The mean increase for a two-year period for the income funds is $900. For the
growth funds, the mean increase is $875. Income funds have a sample standard
deviation of $35; growth funds have a sample standard deviation of $45. Assume that
the population standard deviations are equal. At the 0.05 significance level, is there a
difference in the mean yields of the two funds?
What decision is made about the null hypothesis using an α = 0.05?
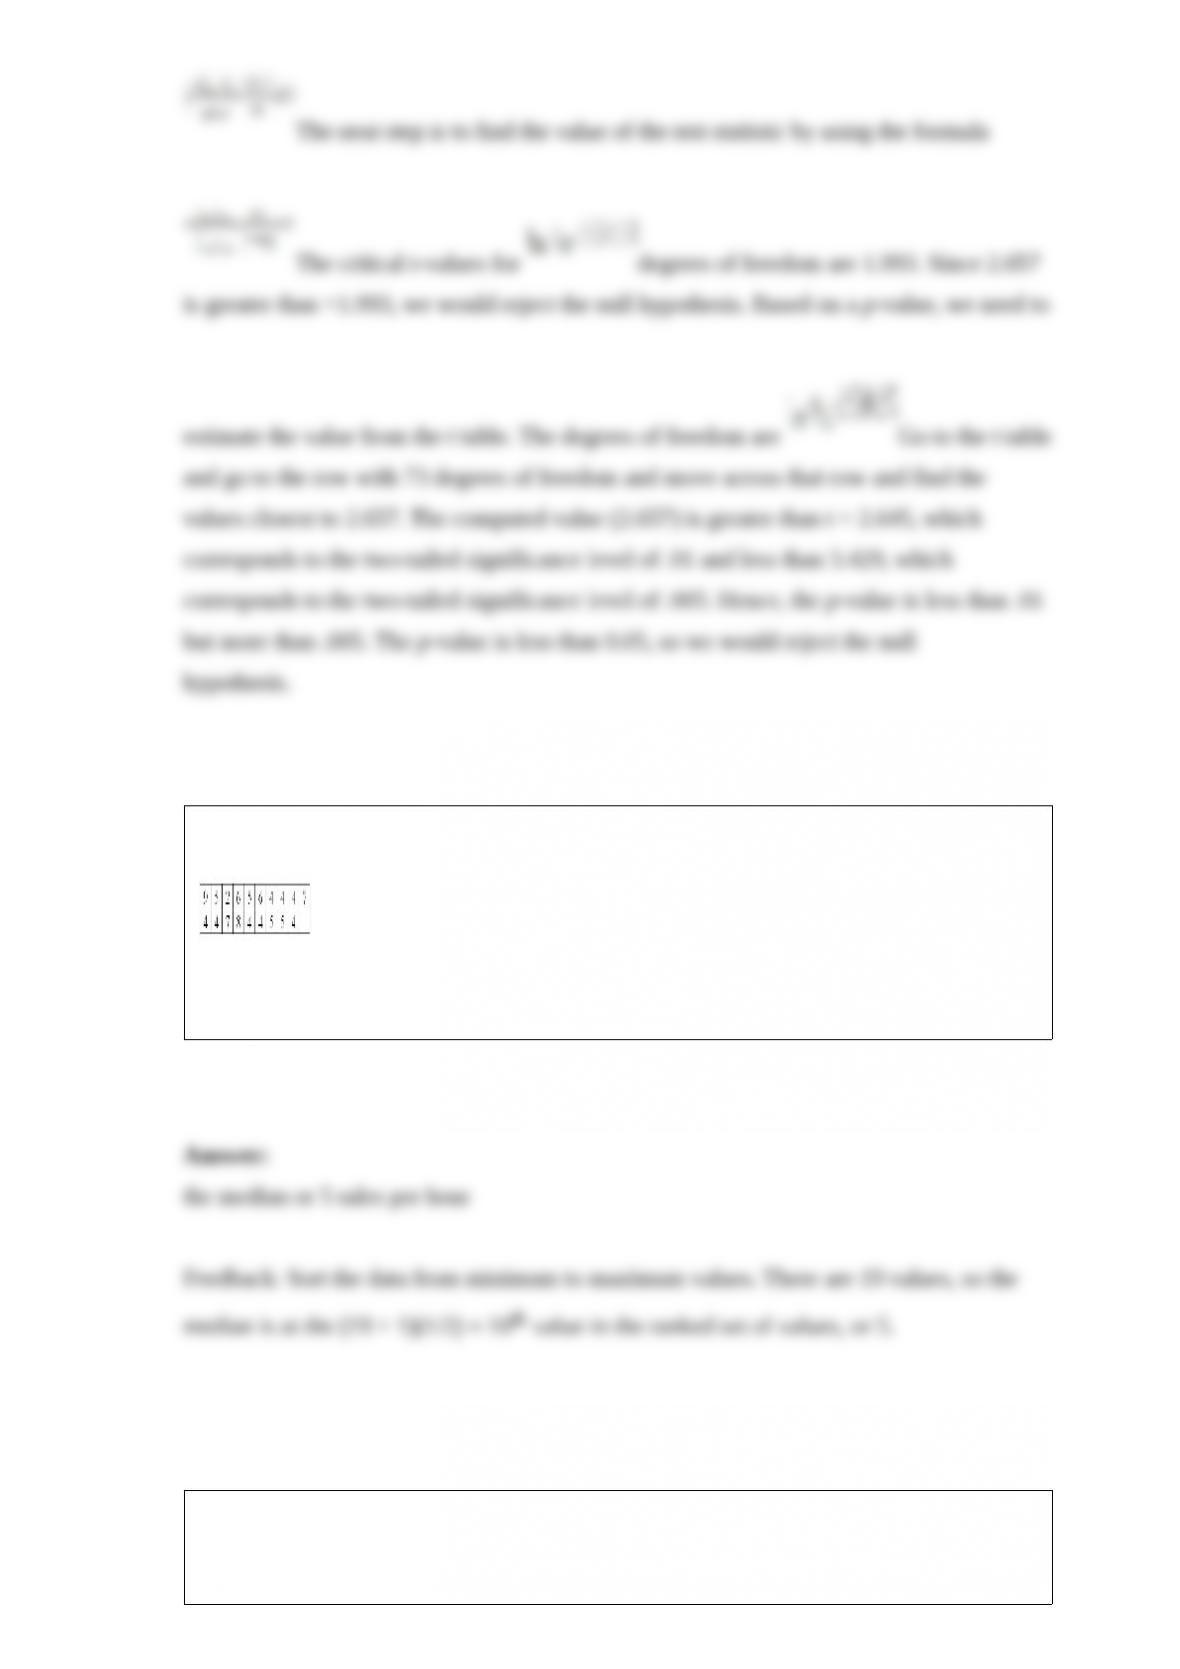
A telemarketing firm is monitoring the performance of its employees based on the
number of sales per hour. One employee had the following sales for the last 19 hours.
For the distribution of number of sales per hour, 50% are equal or greater than
___________.
A soap manufacturer is experimenting with several formulas of soap powder. Three of
the formulas were selected for further testing by a panel of homemakers. The ratings for
the three formulas are as follows:
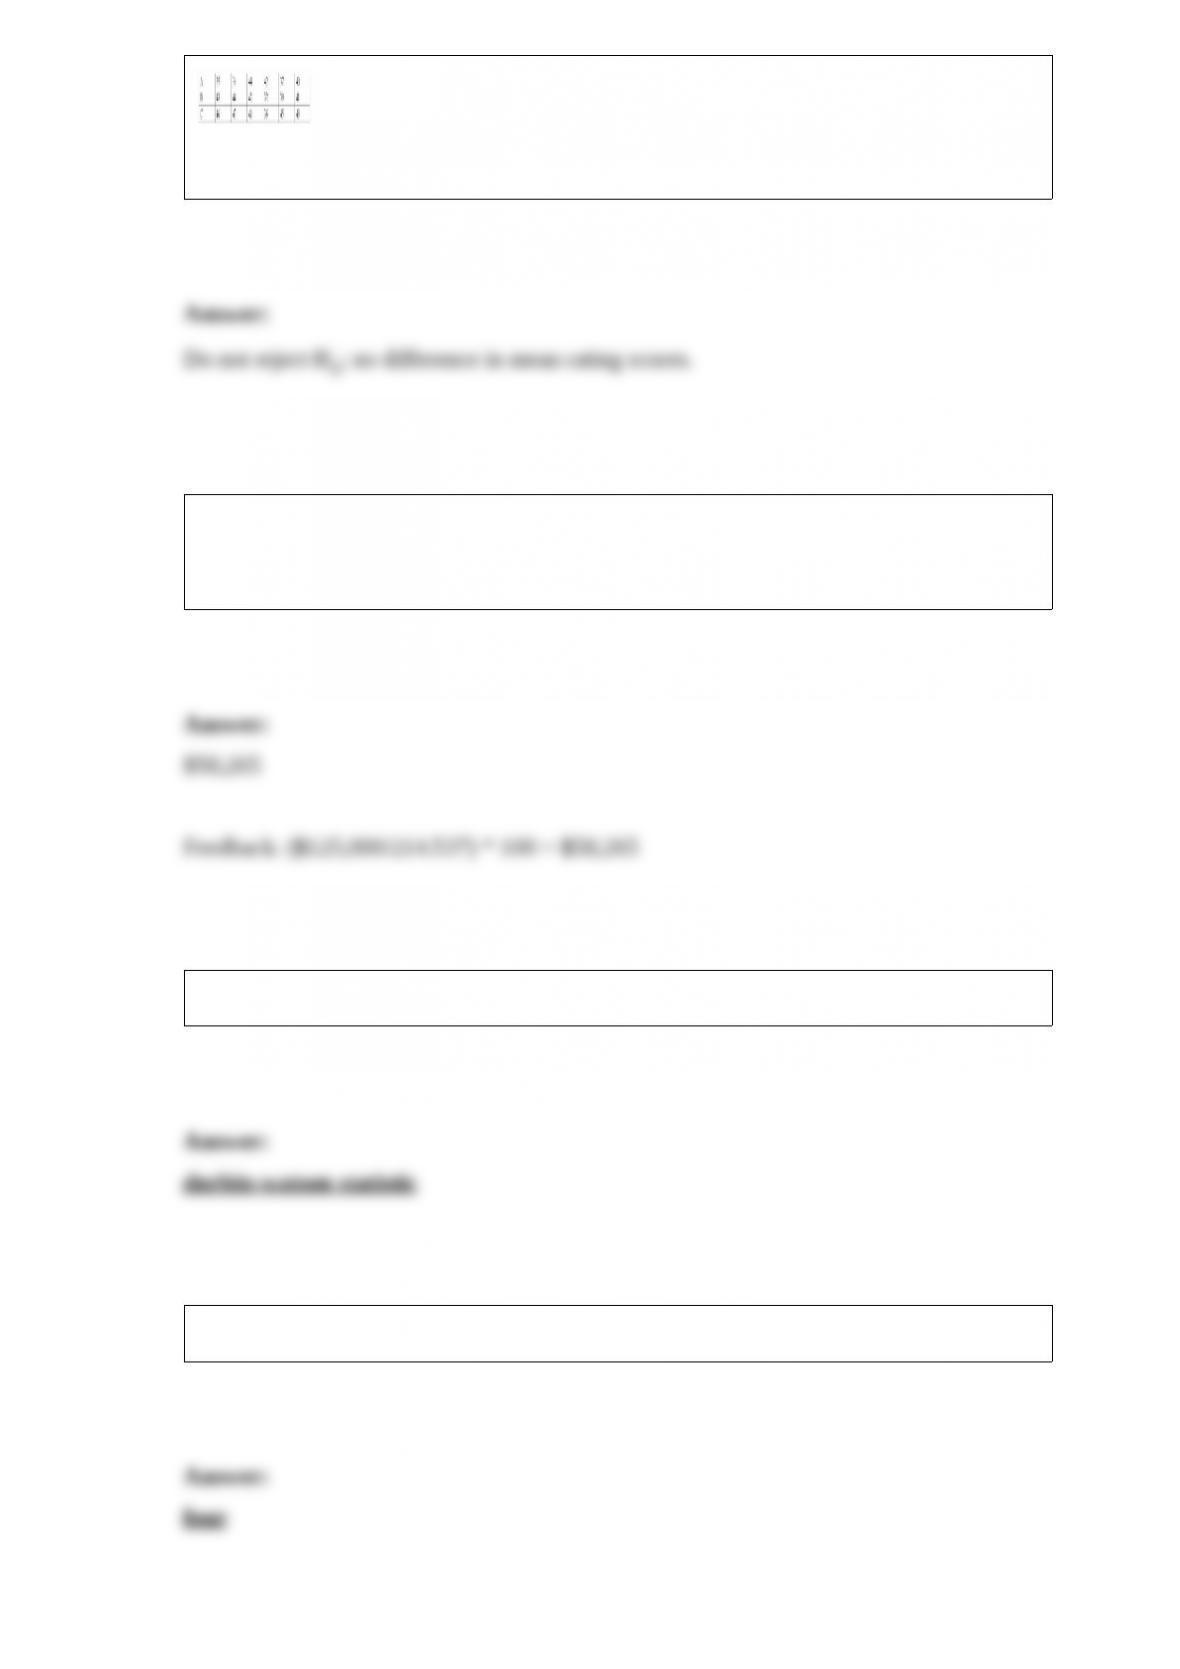
If H is less than the critical value, what is our decision rule?
In 2000, an executive earned $100,000. In 2009, the executive earned $125,000. The
CPI in 2000 was 172.2, and the CPI in 2009 was 214.537. Using the CPI base,
1982-1984 = 100, what was the real income in 2009?
Autocorrelation in a time series can be tested using the ___________.
Quartiles divide a frequency distribution into _______ equal parts.
To test a hypothesis to verify that an observed frequency distribution data is normally
distributed, the expected frequencies are _______________ distributed.