
The coefficient of skewness is the standard deviation divided by the mean.
A cumulative frequency distribution is used when we want to determine how many
observations lie above or below certain values.
An example of a weighted index is P = pt/p0.
Statistics is defined as a body of techniques used to facilitate the collection,
organization, presentation, analysis, and interpretation of information for the purpose of
making better decisions.

The use of the chi-square statistic would be permissible in the following goodness-of-fit
test.
A random variable represents the outcome of an experiment.
If we are testing for the difference between two population means and assume that the
two populations have equal but unknown standard deviations, the variances are pooled
to compute the best estimated variance.

An index of 239.2 represents a 239.2% change.
In the goodness-of-fit test, the chi-square distribution is used to determine how well an
observed distribution of observations “fits” an expected distribution of observations.
The values of a and b in the regression equation are called the regression coefficients.
The coefficient of determination is the square root of the coefficient of correlation.
Which of the following are TRUE assumptions underlying linear regression?
(1) For each value of X, there is a group of Y values that is normally distributed.
(2) The means of these normal distributions of Y values all lie on the regression line.
(3) The standard deviations of these normal distributions are equal.
A. Only (1)
B. Only (2)
C. Only (3)
D. All of them
The 95% confidence interval states that 95% of the sample means of a specified sample
size selected from a population will lie within plus and minus 1.96 standard deviations
of the hypothesized population mean.
An analysis of past seasonal fluctuations can be helpful in planning production for
items such as toys, dolls, Easter eggs, and other holiday-oriented goods.

To determine the value of the standard error of the mean, the standard deviation is
divided by the sample size.
The average score of 100 students taking a statistics final was 70 with a standard
deviation of 7. Assuming a normal distribution, what is the probability that a student
scored greater than 65?
A. 0.2611
B. 0.2389
C. 0.7611
D. -0.714

An electronics retailer believes that, at most, 40% of their cell phone inventory was sold
during November. The retailer surveyed 80 dealers and found that 38% of the inventory
was sold. Since 38% is less than 40%, is this difference of 2 percentage points sampling
error or a significant difference? Test at the 0.05 level. The computed z = -0.37.
A. The 2% is a significant difference.
B. We cannot determine if the 2% is a significant difference.
C. There is not enough information to reach a conclusion.
D. None Apply.
The average cost of tuition plus room and board at small private liberal arts colleges is
reported to be $8,500 per term, but a financial administrator believes that the average
cost is higher. A study conducted using 350 small liberal arts colleges showed that the
average cost per term is $8,7 The population standard deviation is $1,200. Let α =
0.05. Based on the computed test statistic or p-value, what is our decision about the
average cost?
A. Equal to $8,500
B. Greater than $8,500
C. Less than $8,500
D. Not equal to $8,500
When testing for differences between treatment means, the t statistic is based on
____________.
A. the treatment degrees of freedom
B. the total degrees of freedom
C. the error degrees of freedom
D. the ratio of treatment and error degrees of freedom
If A and B are mutually exclusive events with P(A) = 0.2 and P(B) = 0.6, then P(A or B)
= _____.
A. 0.00
B. 0.12
C. 0.8
D. 0.4
For the following distribution:
What is the variance of the distribution?
A. 1.1616
B. 0.964
C. 0.982
D. 1.000
A dot plot shows ____________.
A. The general shape of a distribution
B. The mean, median, and mode
C. The relationship between two variables
D. The interquartile range
Suppose a tire manufacturer wants to set a mileage guarantee on its new XB 70 tire.
Tests revealed that the tire’s mileage is normally distributed with a mean of 47,900
miles and a standard deviation of 2,050 miles. The manufacturer wants to set the
guaranteed mileage so that no more than 5% of the tires will have to be replaced. What
guaranteed mileage should the manufacturer announce?
A. 44,518
B. 32,960
C. 49,621
D. 40,922
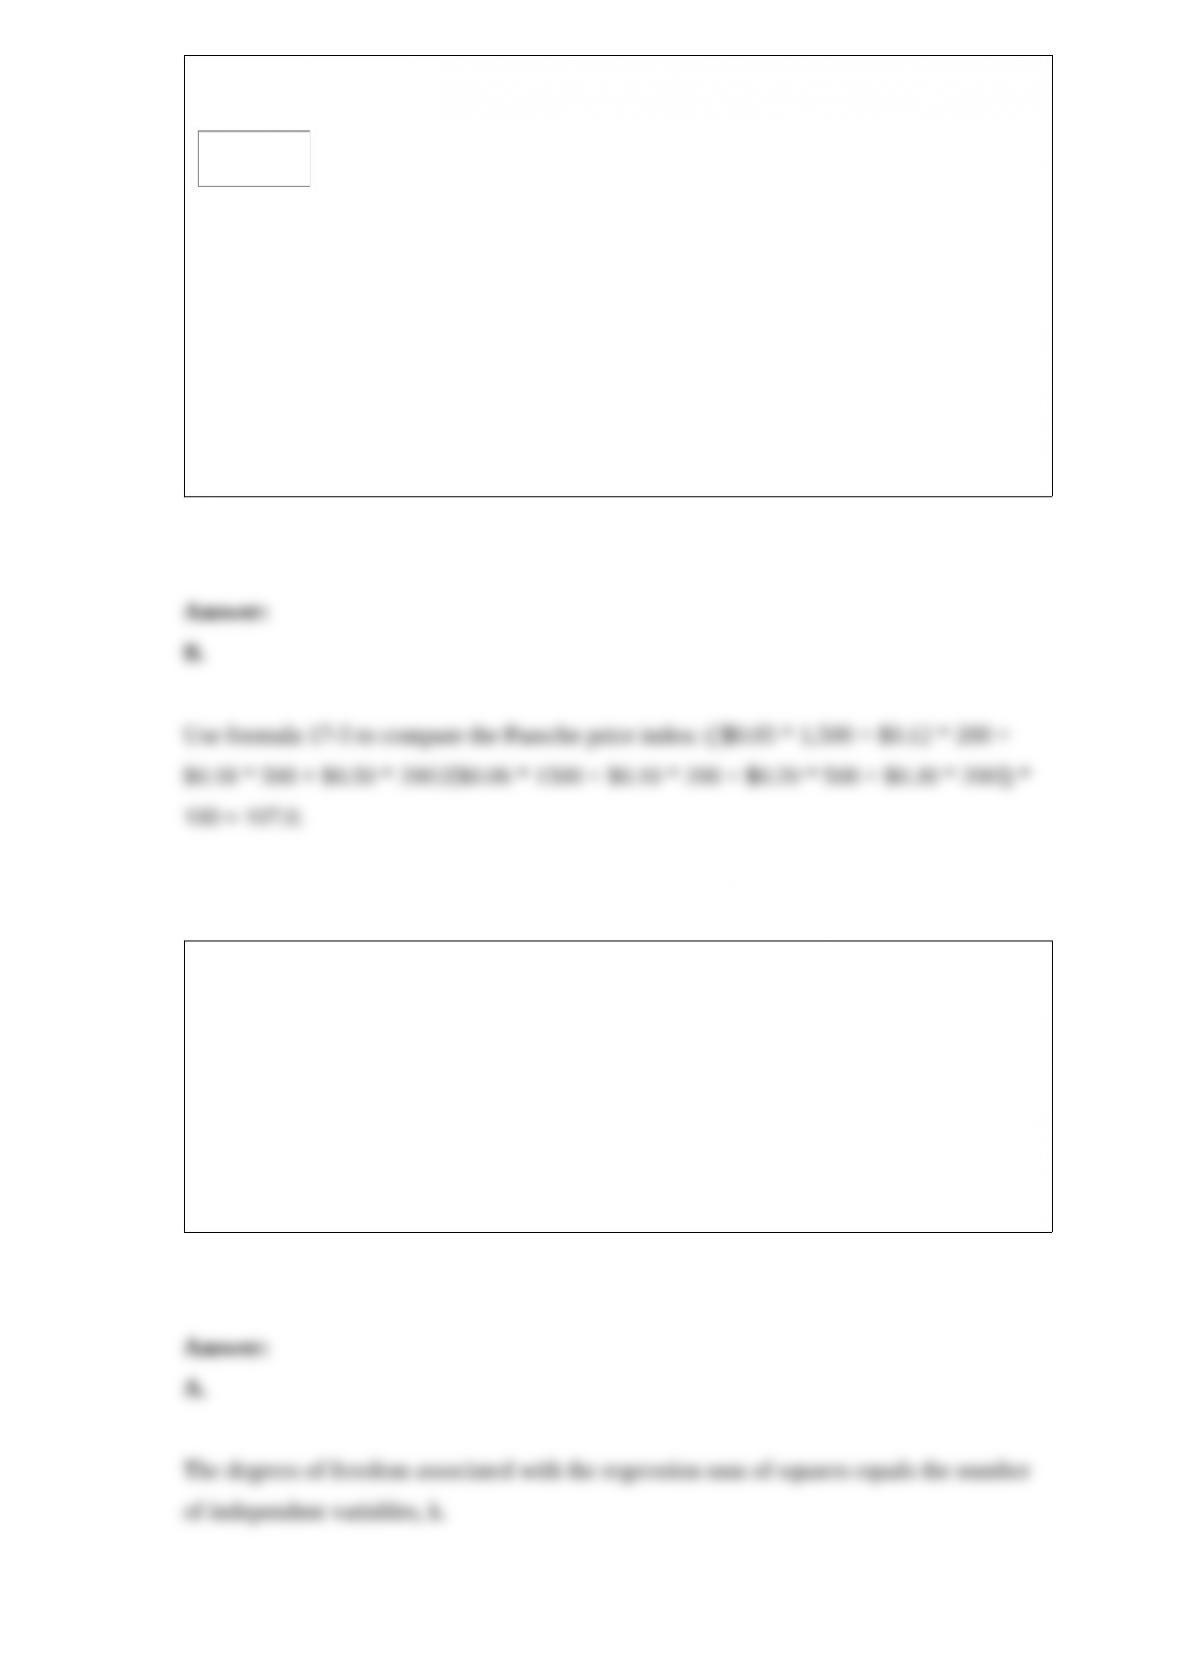
Data for selected vegetables purchased at wholesale prices for 1995 and 2007 are
shown next.
What is Paasche’s price index?
A. 98.4
B. 107.0
C. 108.0
D. 117.5
The degrees of freedom associated with the regression sum of squares equals ____.
A. The number of independent variables
B. 1
C. The F-ratio
D. (n – 2)

The z-value for a standard normal distribution ________.
A. is always positive
B. is always equal to zero
C. can be either positive or negative
D. is always equal to the value of the population mean
A local retail company wants to estimate the mean amount spent by customers. Their
store’s budget limits the number of surveys to 225. What is their maximum error of the
estimated mean amount spent for a 99% level of confidence and an estimated standard
deviation of $10.00?
A. $10.00
B. $1.00
C. 1%
D. $1.72
Which of the following is the standard error of the mean?
A. σ

B. x/n
C.
D. s
In the Kruskal-Wallis test for the following data, what is the sum of the ranks for
Sample 1?
A. 61.5
B. 163
C. 6
D. 253
In the regression equation, what does the letter “b” represent?
A. The Y-intercept
B. The slope of the line
C. Any value of the independent variable that is selected
D. The value of Y when X = 0
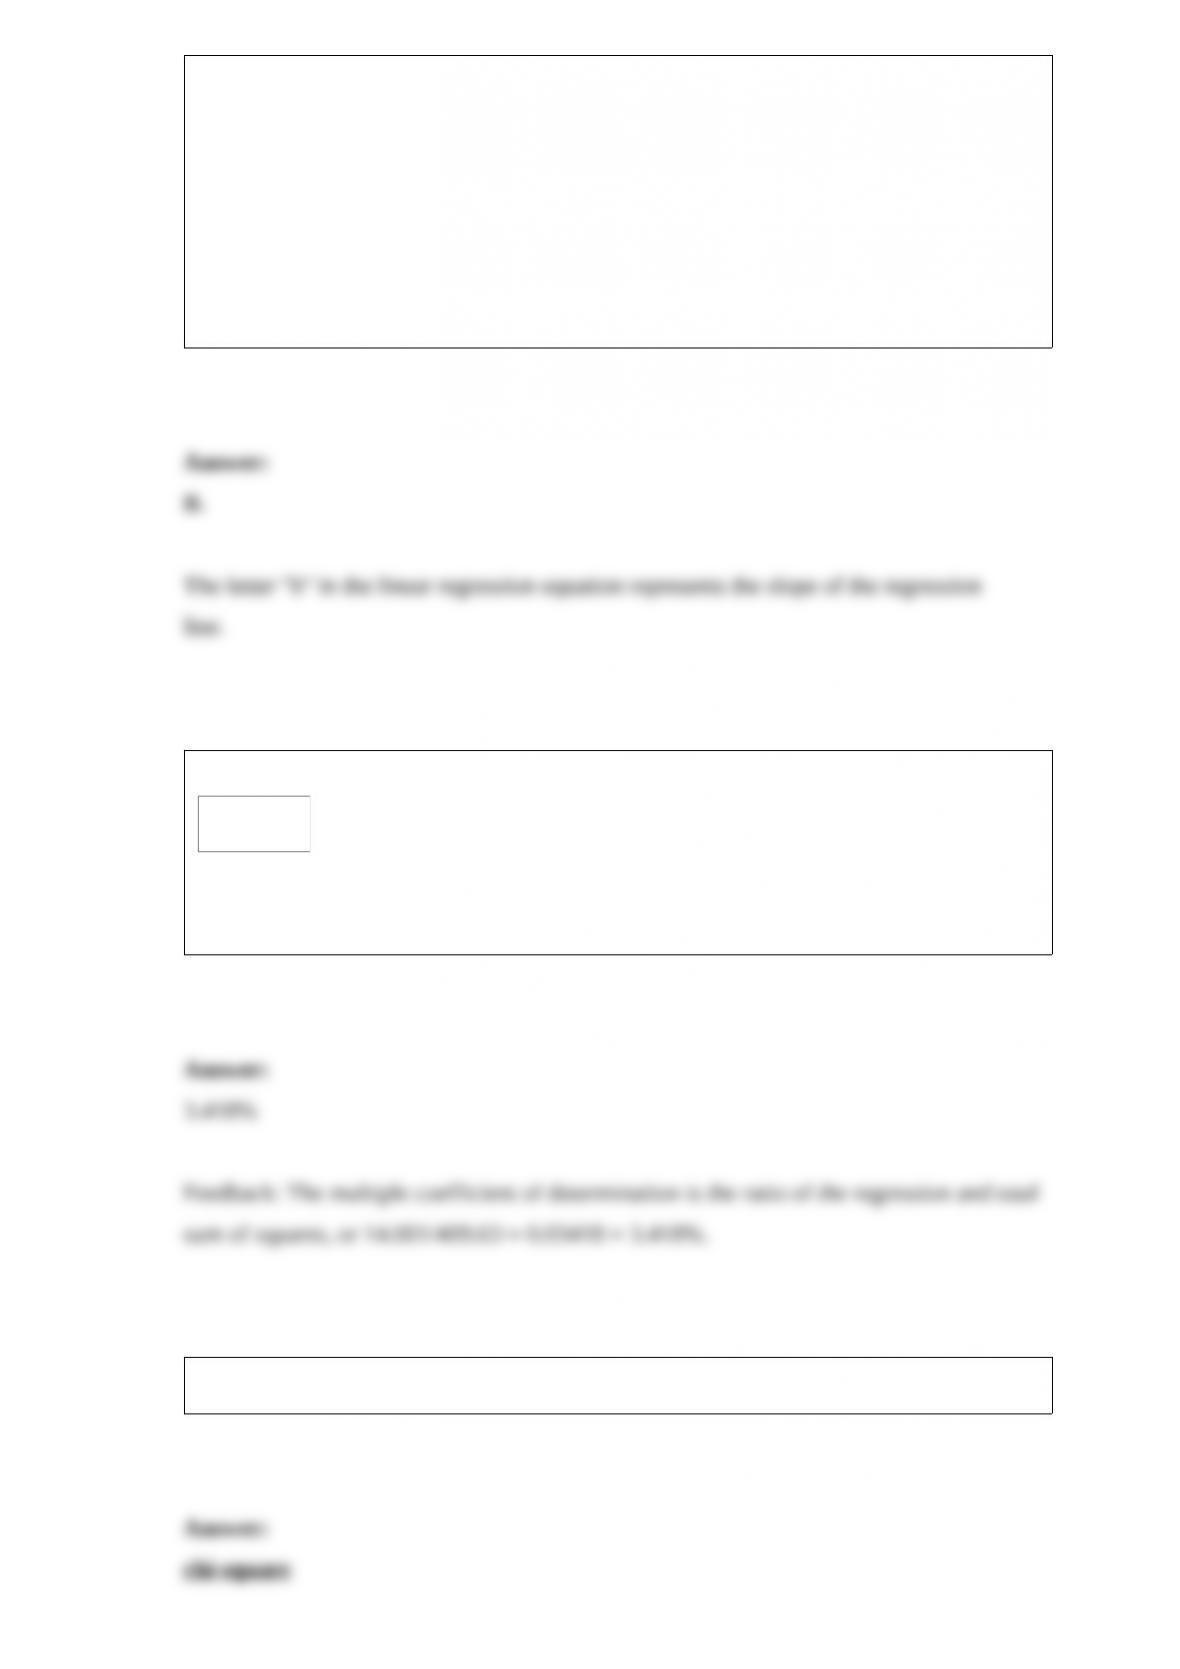
A multiple regression analysis showed the following ANOVA table result.
Based on the information in the ANOVA, what is the multiple coefficient of
determination expressed as a percent?
The Kruskal-Wallis H statistic follows the __________ distribution.
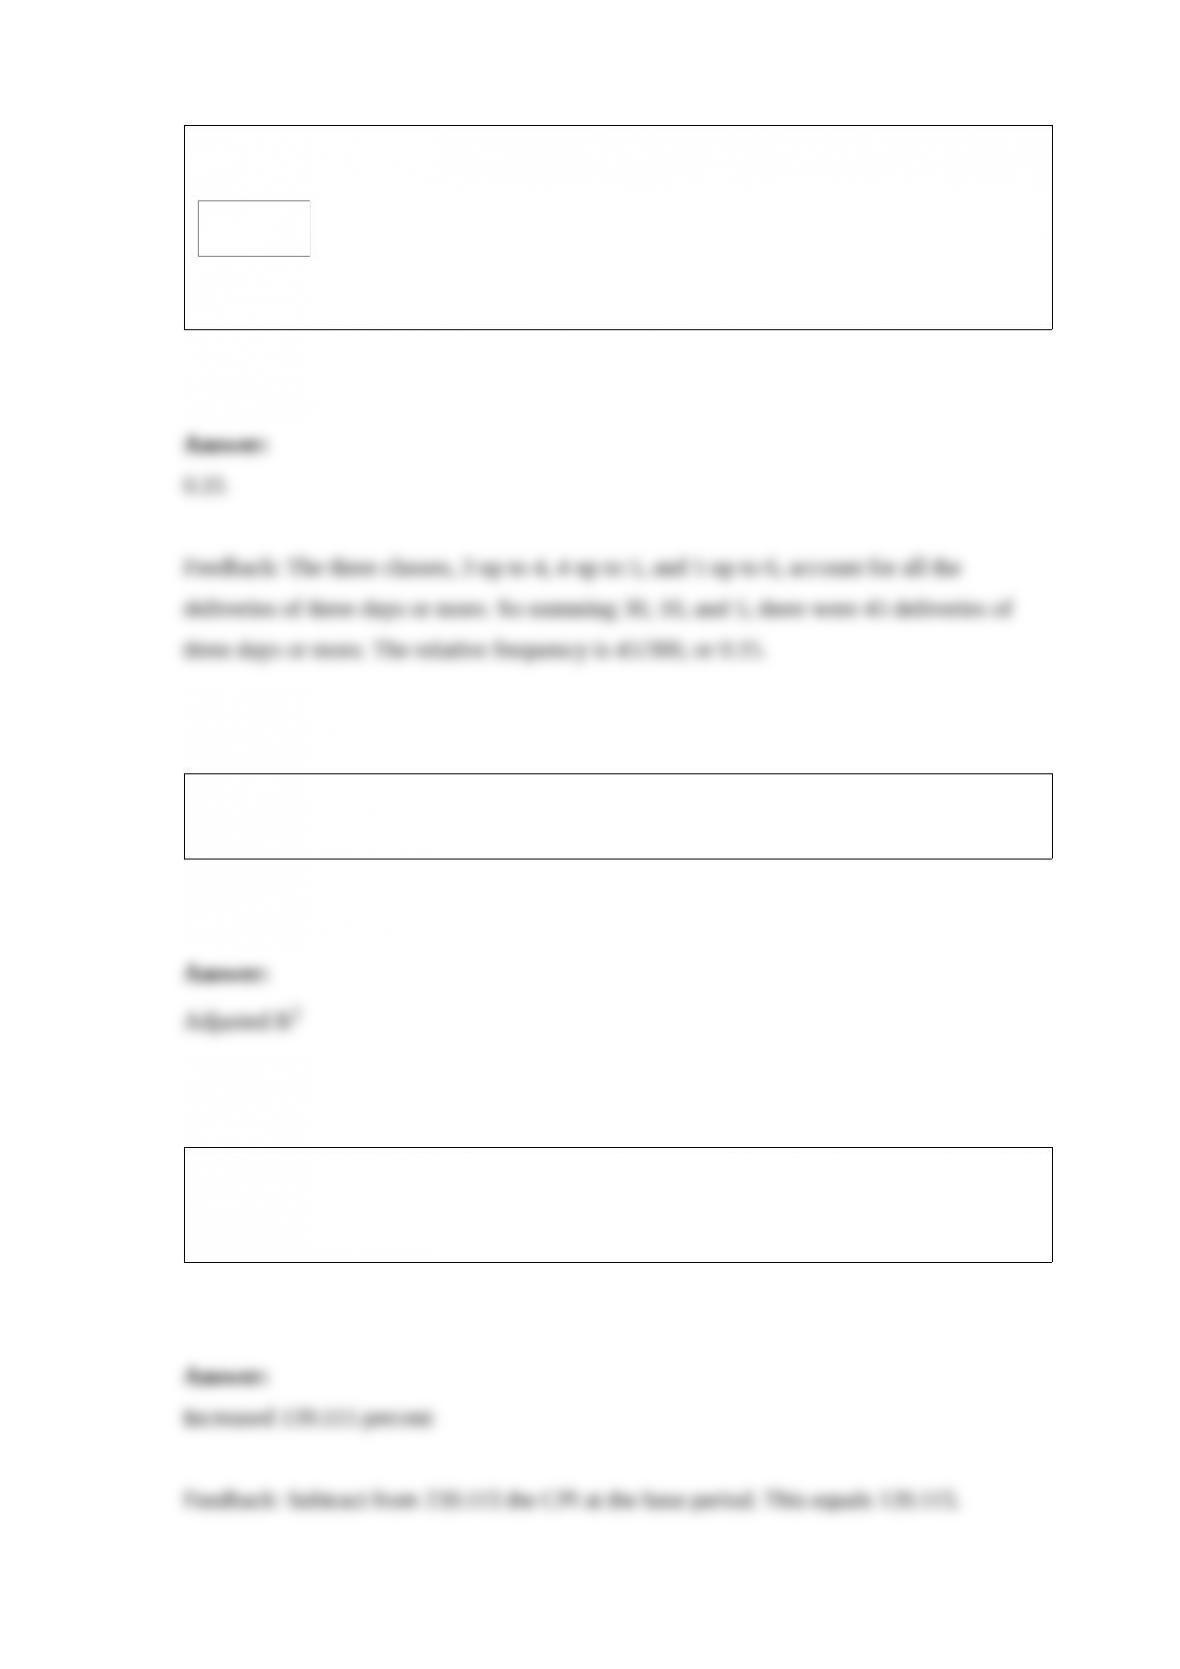
The following frequency distribution shows the distribution of delivery times (in days)
for swimstuff.com customer orders during the last month.
What is the relative frequency for orders delivered in three days or more?
In multiple regression, the __________ accounts for the variance of additional
independent variables.
The Consumer Price Index (1982-84 = 100) reports a CPI in August 2010 for Rent of
Shelter as 239.115. What is the percentage change in the price of Rent of Shelter
compared to the base?