When doing research, knowing the population mean and other population parameters is
essential.
The 50th percentile of a distribution is the same as the distribution mean.
As a general rule of thumb, if the items selected for a sample are not replaced and the
sample size is less than 5 percent of the population, the binomial distribution can be
used to approximate the hypergeometric distribution.
In acceptance sampling, usually 100% of the incoming lot is checked.
In a bar chart, the heights of the bars represent the frequencies in each class.
The terms descriptive statistics and inferential statistics can be used interchangeably.
For any uniform probability distribution, the mean and standard deviation can be
computed based on the maximum and minimum values of the random variable.
The Durbin-Watson statistic is used to test for correlated residuals.
A manufacturer claims that less than 1% of all its products do not meet the minimum
government standards. A survey of 500 products revealed that 10 did not meet the
standard. The p-value is ______________.
A population consists of the following five values: 3, 8, 11, 13, and 16. From this
population, there are 10 different samples of size 3. The means of the 10 samples of size
3 are: 7.33, 8, 9, 9, 10, 10.67, 10.67, 11.67, 12.33, and 13.33. Compute the mean of the
distribution of the sample means and the population mean. What is
The Union of Electrical Workers of America with 9,128 members polled 362 members
about a new wage package that will be submitted to management. The population is the
362 members.
What does the complement rule state?
A. P(A) = P(A) – P(B)
B. P(A) = 1 – P(not A)
C. P(A) = P(A) P(B)
D. P(A) = P(A)X + P(B)
Consider a regression analysis, where the correlation coefficient is 0.18. Then, the
coefficient of determination is _______.
A. 0.36
B. 0.0324
C. 0.424
D. 1.16
For the following distribution of heights, what are the limits for the class with the
greatest frequency?
A. 64 and up to 70
B. 65 and 69
C. 65 and up to 70
D. 69.5 and 74.5
Suppose an automobile manufacturer designed a radically new lightweight engine and
wants to recommend the grade of gasoline that will have the best fuel economy. The
four grades are regular, economy, premium, and super premium. The test car made three
trial runs on the test track using each of the four grades. The miles per gallon were
recorded for each grade. At the 0.05 level, what is the critical value of F used to test the
hypothesis that the miles per gallon for each fuel are the same?
A. 1.96
B. 4.07
C. 2.33
D. 12.00
If the coefficient of determination is 0.94, what can we say about the relationship
between two variables?
A. The strength of the relationship is 0.94.
B. The direction of the relationship is positive.
C. 94% of the total variation of the dependent variable is explained by the independent
variable.
D. The direction of the relationship is negative.
What does the interquartile range describe?
A. The range of the lower 50% of the observations
B. The range of the middle 50% of the observations
C. The range of the upper 50% of the observations
D. The ranges of the lower 25% and the upper 25% of the observations
A student wanted to construct a 95% confidence interval for the mean age of students in
her statistics class. She randomly selected nine students. Their mean age was 19.1
years, with a sample standard deviation of 1.5 years. What is the 95% confidence
interval for the population mean?
A. [0.97, 3.27]
B. [15.64, 22.56]
C. [17.97, 20.23]
D. [17.95, 20.25]
The tread life of tires mounted on light duty trucks follows the normal probability
distribution with a mean of 60,000 miles and a standard deviation of 4,000 miles.
Suppose you bought a set of four tires, what is the likelihood the mean tire life of these
four tires is more than 66,000 miles?
A. 0.0013
B. 0.9987
C. 0.4987
D. 0.9544
In an ANOVA table, for a multiple regression analysis, the variation of the dependent
variable explained by the variation of the independent variables is represented by
___________.
A. The regression sum of squares
B. The total sum of squares
C. The residual mean square
D. The p-value
Twenty randomly selected statistics students were given 15 multiple-choice questions
and 15 open-ended questions, all on the same material. The professor was interested in
determining if students scored higher on the multiple-choice questions. This experiment
is an example of ________________.
A. A one-sample test of means
B. A two-sample test of means
C. A paired t-test
D. A test of proportions
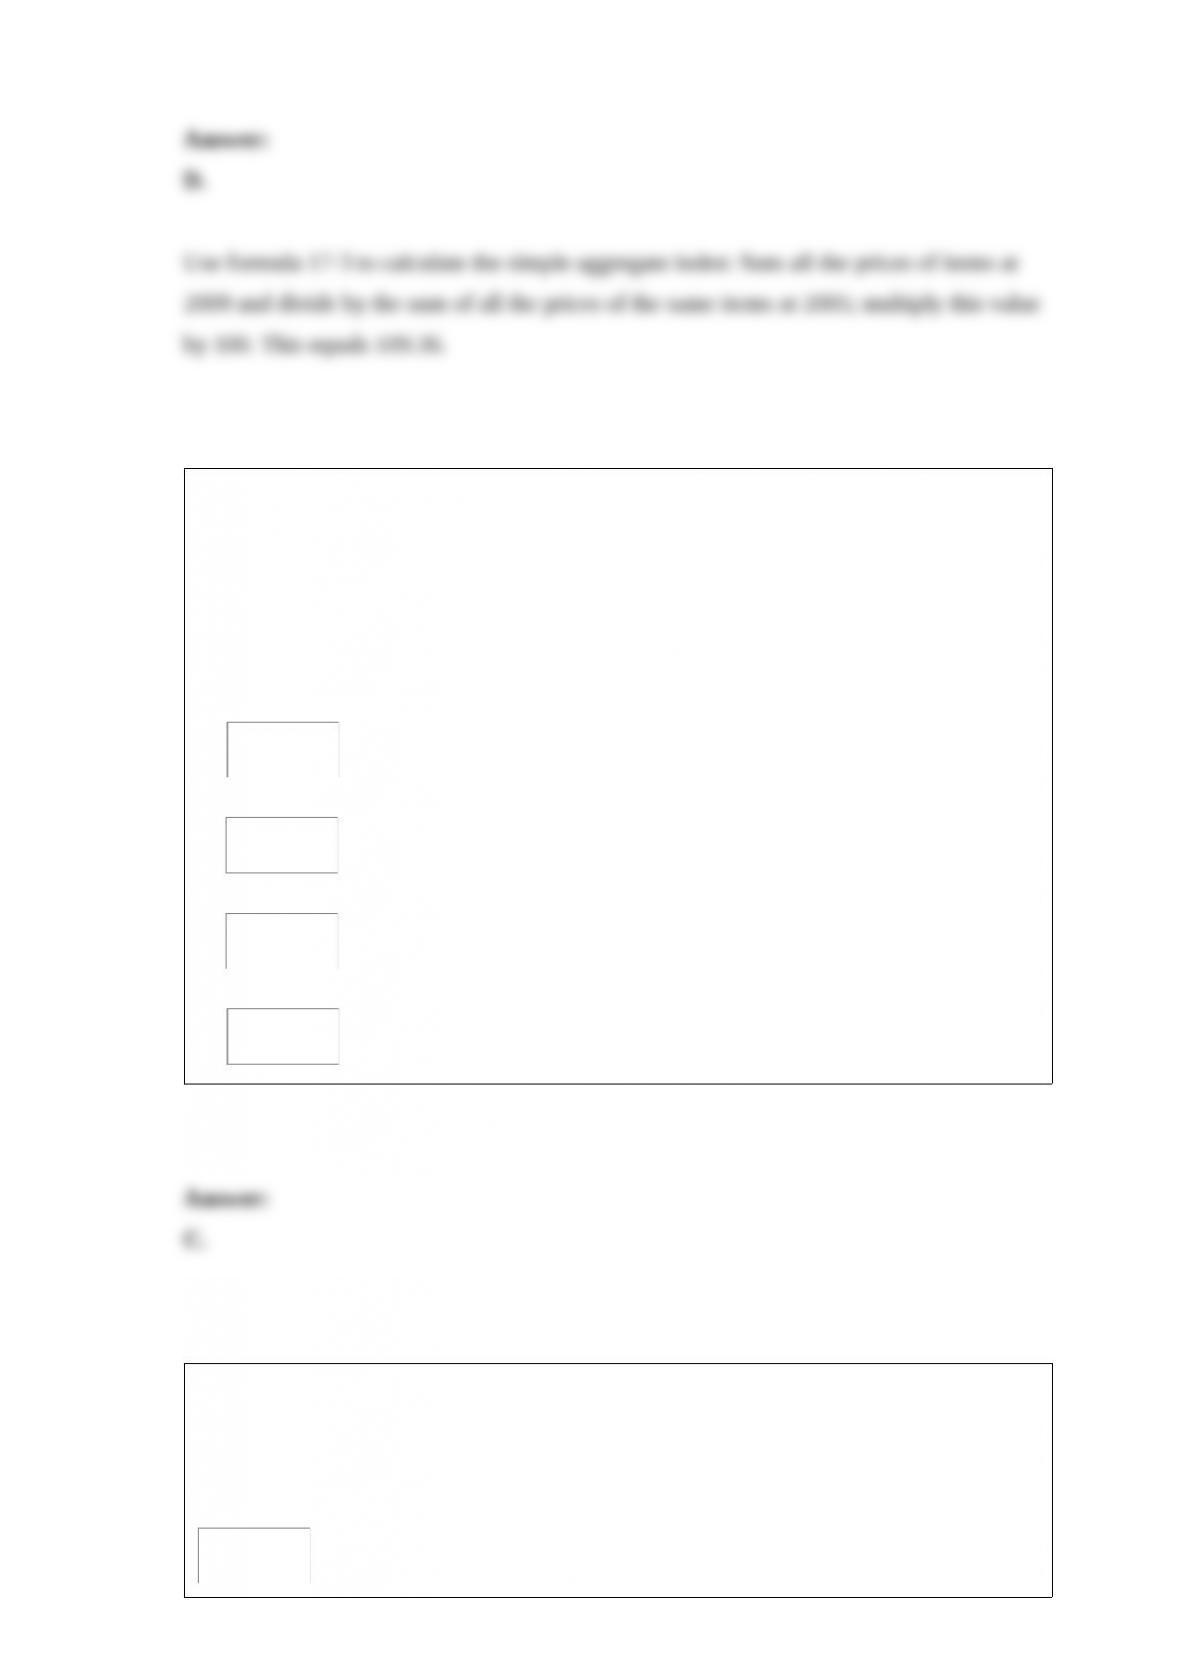
Data for selected fruits purchased at wholesale prices for 2005 and 2009 are shown
next.
What is the unweighted aggregate price index?
A. 112.70
B. 179.08
C. 111.97
D. 109.36
Twenty economists were sampled and asked to predict if the national economy would
improve during the next 12 months. Eleven of the economists predicted an increase,
two economists predicted no change, and seven economists predicted a decrease in the
economy. Conduct a hypothesis test at the 0.10 significance level to determine if the
majority of economists predict an increase.
The null hypothesis is:
A.
B.
C.
D.
A company is researching the effectiveness of a new website design to decrease the
time to access a website. Five website users were randomly selected, and their times (in
seconds) to access the website with the old and new designs were recorded. To compare
the times, they computed (new website design time – old website design time). The
results follow.
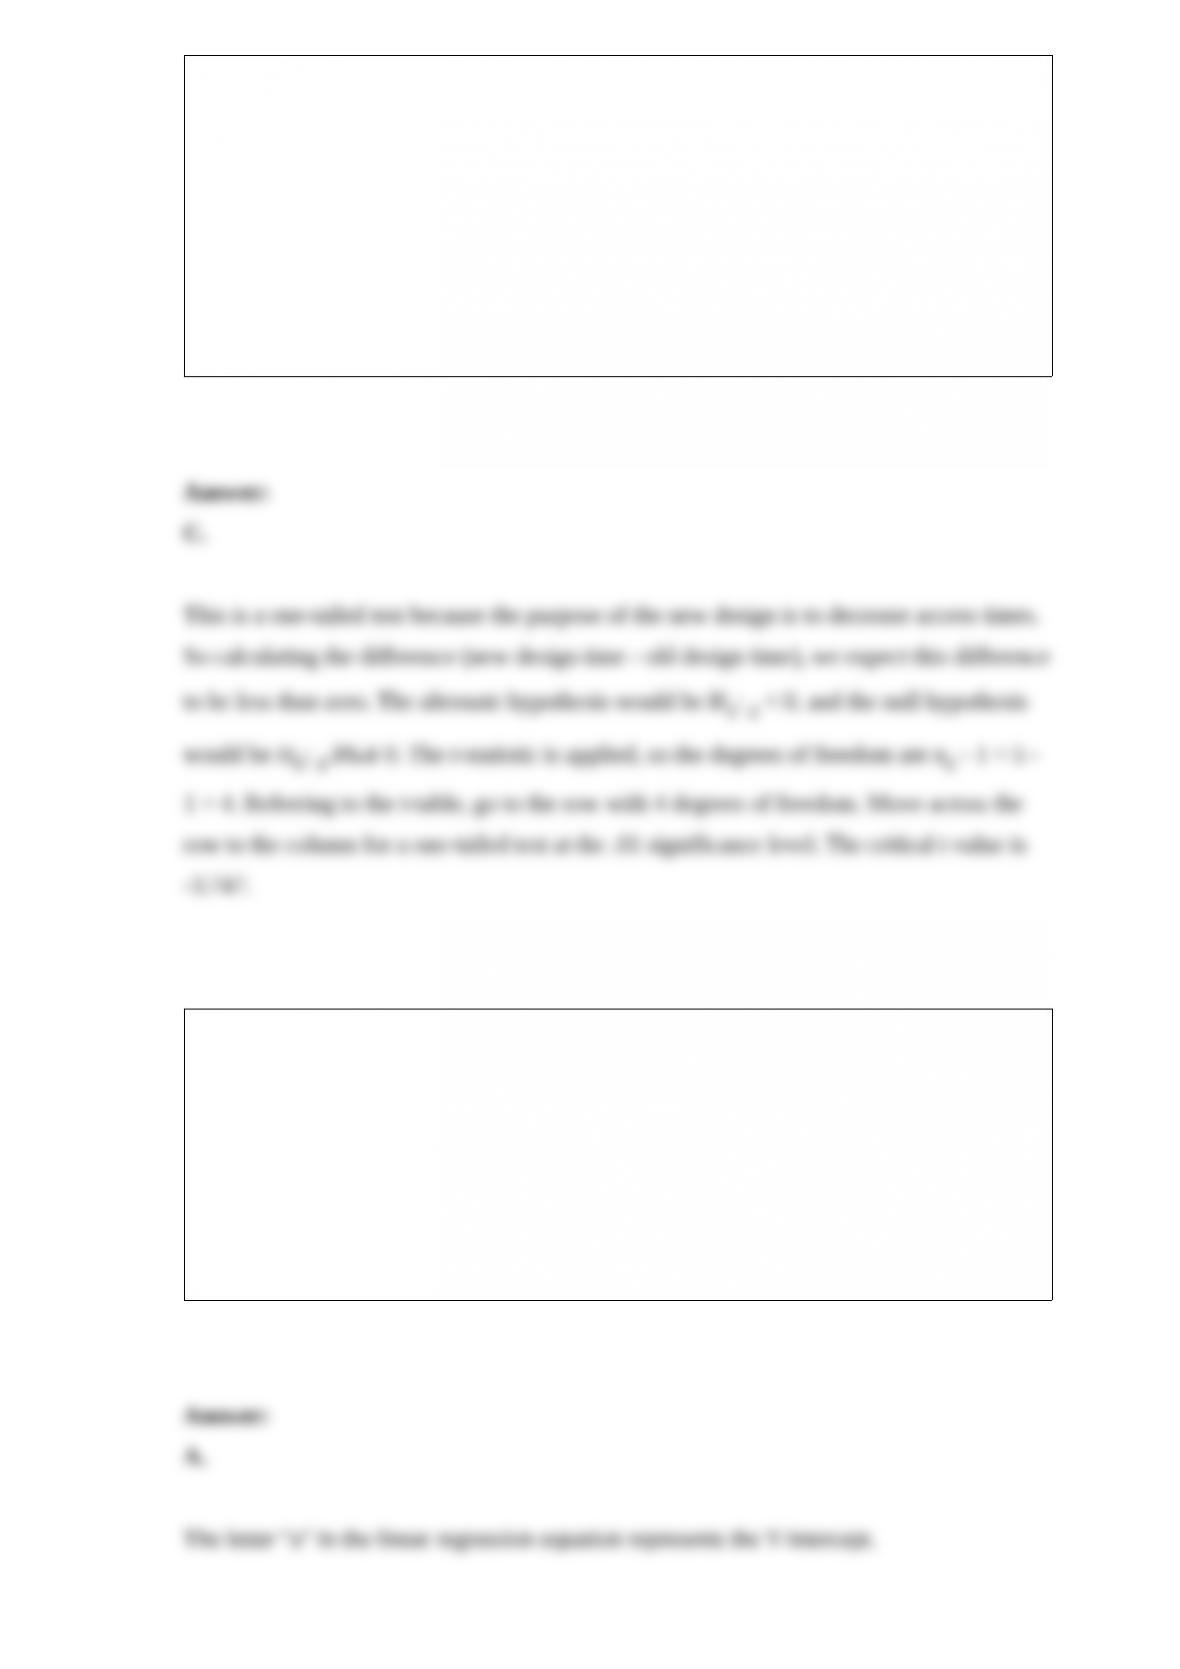
For a 0.01 significance level, what is the critical value?
A. 2.256
B. 1.895
C. 3.747
D. 2.447
In the regression equation, what does the letter “a” represent?
A. The Y-intercept
B. The slope of the line
C. Any value of the independent variable that is selected
D. An error

What is a null hypothesis for a one-tailed sign test?
A. H0: π = 0
B. H0: π ≥ 1.00
C. H0: π = 0.50
D. H0: π ≤ 0.50
In a contingency table, we describe the relationship between ________.
A. Two variables measured at the ordinal or nominal level
B. Two variables, one measured as an ordinal variable and the other as a ratio variable
C. Two variables measured at the interval or ratio level
D. A variable measure on the interval or ratio level and time
The following table shows the sales for a plastics manufacturer recorded over the past
year. The seasonal indexes for each quarter are also provided. To track the trend for
these four quarters, use the indexes to deseasonalize the sales data.
What is the deseasonalized sales value for quarter 3?
The general process of gathering, organizing, summarizing, analyzing, and interpreting
data is called ____________.
A. Statistics
B. Descriptive statistics
C. Inferential statistics
D. Levels of measurement
In multiple regression analysis, a dummy variable is ____________.
A. An additional quantitative variable
B. A nominal variable with three or more values
C. A nominal variable with only two values
D. A new regression coefficient
To test if an observed frequency distribution with five classes is normally distributed,
we compute probabilities for each class based on a(n) _________________.
A. Standard normal distribution
B. Chi-square distribution
C. Student’s t distribution
D. F distribution
A manufacturer of golf club shafts inspects 50 shafts every day. Over the last ten days,
the number of defective shafts has been reported to be the following.
To construct a process control chart for the mean percent defective, what is the upper
control limit?
Two movie reviewers gave their ratings (0 to 4 stars) to ten movies released this past
month as follows:
The rank order correlation is to be used.
What is the null hypothesis for rank order correlation?
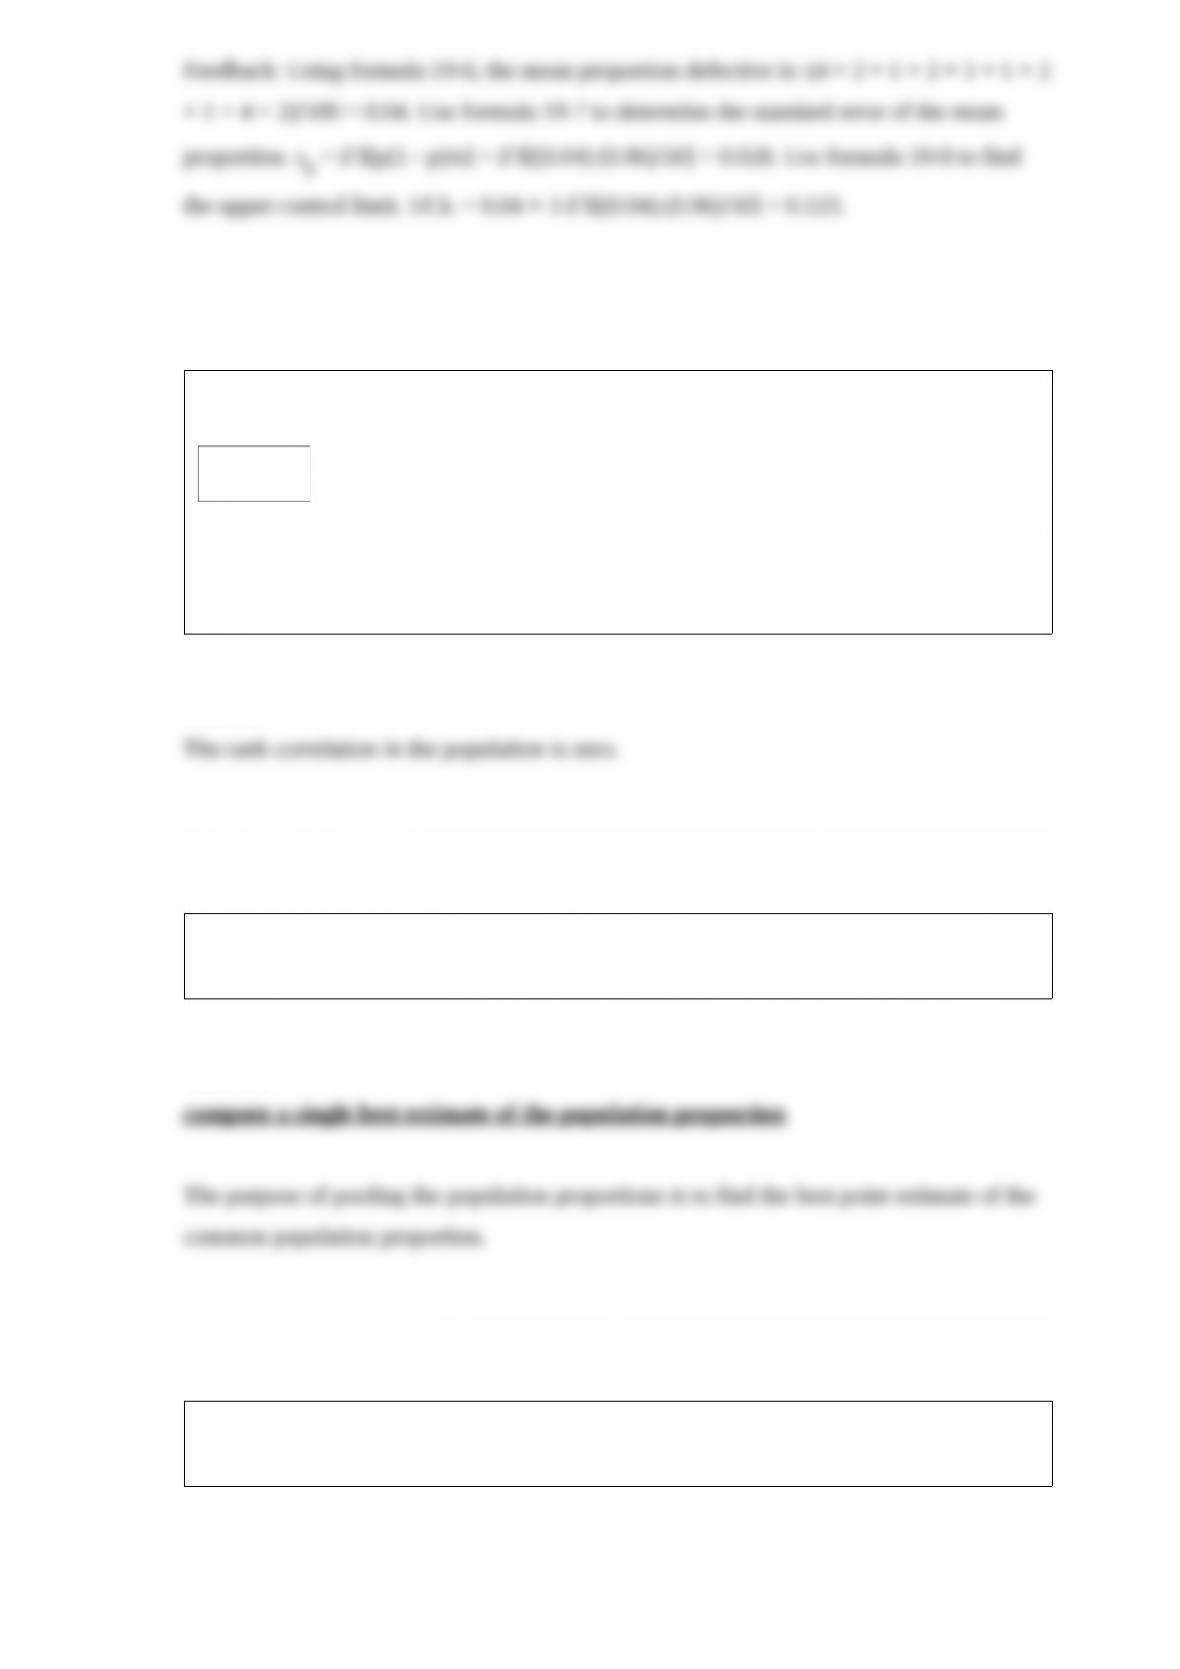
The purpose of pooling the sample proportions when testing the difference between two
population proportions is to ___________.
A(n) _________ estimate states the range within which a population parameter
probably lies.
What is the purpose of sensitivity analysis in decision theory?