A p-value is a probability.
If the computed value of F is 0.99 and the F critical value is 89, we would not reject the
null hypothesis.
In testing the difference between two population proportions, we pool the two sample
proportions to estimate the population proportion.
An example of a hypothesis is: A person is innocent until proven guilty.

The shape of the chi-square distribution depends on the size of the sample.
There is not one, but a family of chi-square distributions. There is a chi-square
distribution for 1 degree of freedom, another for 2 degrees of freedom, another for 3
degrees of freedom, and so on.
The regression equation is used to estimate a value of the dependent variable Y based on
a selected value of the independent variable X.
The sum of the deviations from the mean for the set of numbers 4, 9, and 5 will equal
zero.
Correlation analysis is a statistical technique used to measure the strength of the
relationship between two variables.
For a hypothesis test comparing two population means, the combined degrees of
freedom are 24. Which of the following statements about the two sample sizes is NOT

A probability distribution is a mutually exclusive and collectively exhaustive listing of
experimental outcomes that can occur by chance, and their corresponding probabilities.
It is often not feasible to study the entire population because it is impossible to observe
all the items in the population.
If the null hypothesis is FALSE and the researchers accept it, a _______ error has been
made.
Etienne Laspeyres developed a method in the latter part of the 18th century to determine
a weighted index using base-period weights.

The variance measures the skewness of a probability distribution.
The shape of any uniform probability distribution is ____________.
A. Negatively skewed
B. Positively skewed
C. Rectangular
D. Bell-shaped
When determining how well an observed set of frequencies fit an expected set of
frequencies, what is the test statistic?
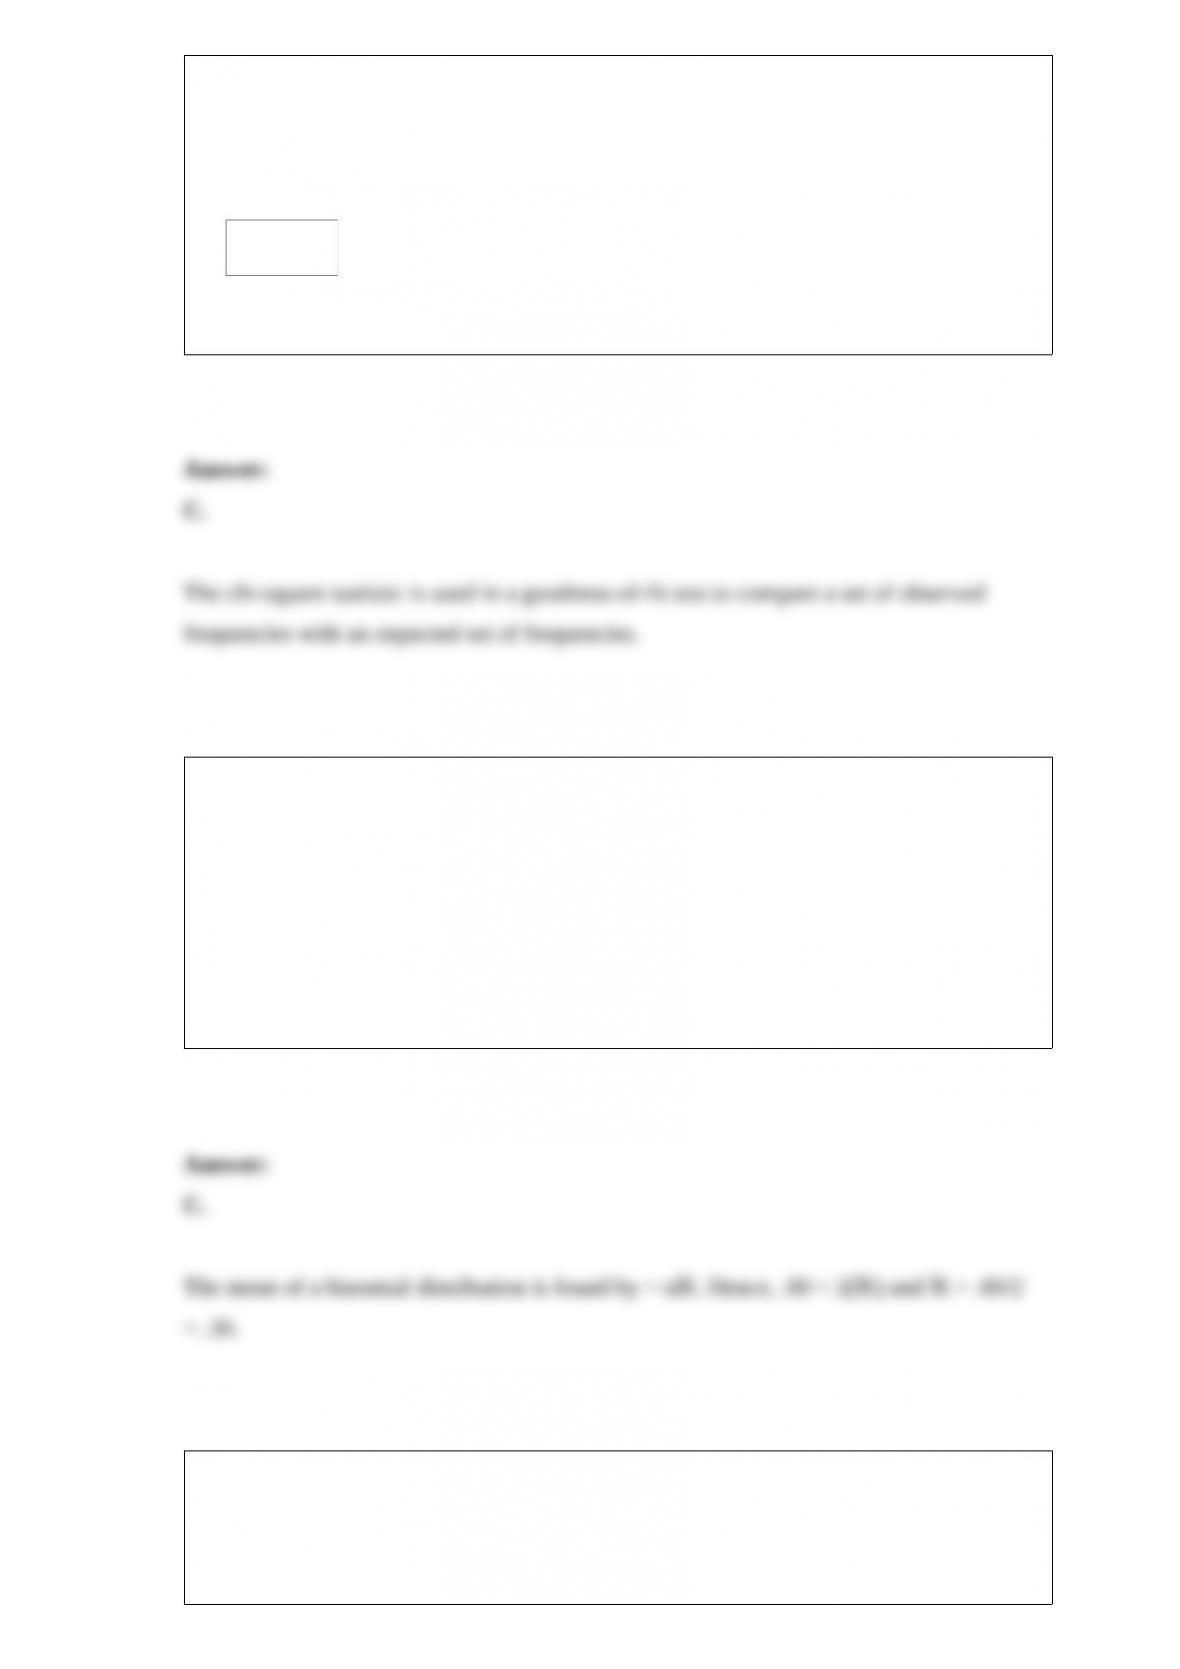
A. F-statistic
B. t-statistic.
C. statistic
D. z-statistic
For a binomial distribution, the mean is 0.6 and n = 2. What is π for this distribution?
A. 0.5
B. 1.00
C. 0.3
D. 0.1
Consider independent simple random samples that are taken to test the difference
between the means of two populations. The variances of the populations are unknown,
but are assumed to be equal. The sample sizes of each population are n1 = 37 and n2 =
45. The appropriate distribution to use is the:

A. t distribution with df = 82.
B. t distribution with df = 81.
C. t distribution with df = 41.
D. t distribution with df = 80.
Monthly commissions of first-year insurance brokers are $1,270, $1,310, $1,680,
$1,380, $1,410, $1,570, $1,180 and $1,420. These figures are referred to as a(n)
__________.
A. Histogram
B. Raw data
C. Frequency distribution
D. Frequency polygon
Given the following ANOVA table for three treatments each with six observations:
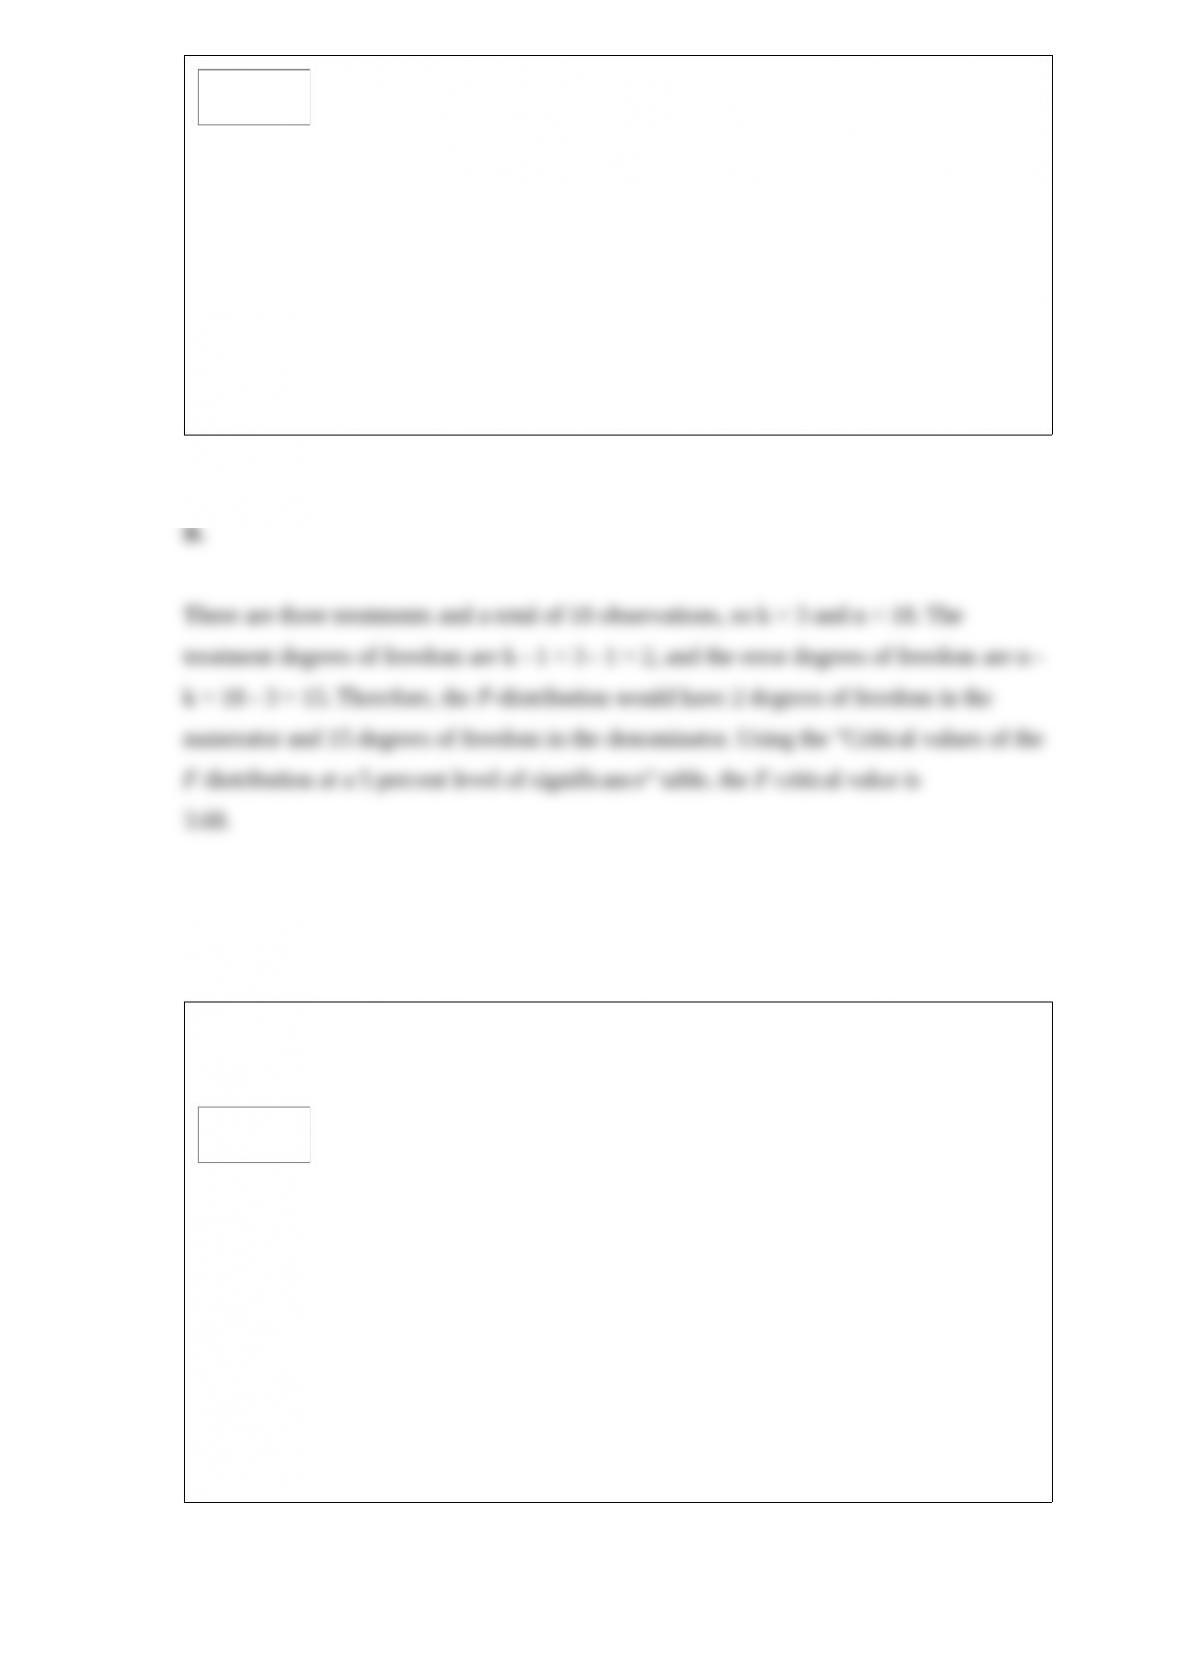
What is the critical value of F at the 5% level of significance?
A. 3.29
B. 3.68
C. 3.59
D. 3.20
Each salesperson in a large department store chain is rated on their sales ability and
their potential for advancement. The data for the 500 sampled salespeople are
summarized in the following table.
What is the probability that a salesperson selected at random will have an excellent
potential for advancement given they also have above average sales ability?
A. 0.27
B. 0.60
C. 0.404
D. 0.45

A study was conducted on the percent of total advertising dollars spent by ten local
firms for advertising in the press and on cable television. Results were ranked with a
resulting sum of squared differences equal to 128.
What is the sum of the differences in ranks?
A. 128
B. 100
C. 0
D. 1
The test scores for a class of 147 students are computed. What is the location of the test
score associated with the third quartile?
A. 111
B. 37
C. 74
D. 75%

If a major hurricane exerts an impact on the economy, that event could be classified as
a(n) ___________.
A. secular trend
B. episodic variation
C. residual variation
D. seasonal variation
When dividing a population into subgroups so that a random sample from each
subgroup can be collected, what type of sampling is used?
A. Simple random sampling
B. Systematic sampling
C. Stratified random sampling
D. Cluster sampling

Two accounting professors decided to compare the variance of their grading procedures.
To accomplish this, they each graded the same 10 exams, with the following results:
What is the alternate hypothesis?
A.
B.
C.
D.
If P(A) = 0.62, P(B) = 0.47, and P(A or B) = 0.88, then P(A and B) = _____.
A. 0.2914
B. 1.9700
C. 0.6700
D. 0.2100
A manufacturer of automobile transmissions uses two different processes. Management
ordered a study of the production costs to see if there is a difference between the two
processes. A summary of the findings is shown next.
What is the critical value of F at the 5% level of significance?
A. 19.45
B. 3.00
C. 4.41
D. 4.38
In an ANOVA table for a multiple regression analysis, the global test of significance is
based on the _________.
A. Treatment mean square divided by the error variation
B. Block and error variation
C. Treatment mean square and block mean square
D. Regression mean square divided by the mean square error
It is claimed that in a bushel of peaches, less than 10% are defective. A sample of 400
peaches is examined and 50 are found to be defective. If α = 0.025, what will be the
decision?
A. Accept the null.
B. Reject the null and conclude the defects are not greater than 10%.
C. Reject the null and conclude the defects are greater than 10%.
D. Fail to reject the null.

Refer to the following frequency distribution on days absent during a calendar year by
employees of a manufacturing company:
How many employees were absent from 6 up to 12 days?
A. 20
B. 8
C. 12
D. 17
It has been hypothesized that overall academic success for college freshmen as
measured by grade point average (GPA) is a function of IQ scores, X1, hours spent
studying each week, X2, and one’s high school average, X3. Suppose the regression
equation is . The multiple standard error is 6.313 and R2 = 0.826.
What is the predicted GPA for a student with an IQ of 108, 32 hours spent studying per
week, and a high school average of 82?
If the Laspeyres index is 111.95 and the Paasche index is 122.58, what is Fisher’s ideal
index?
To summarize the gender of students attending a college in a frequency distribution, a
total of at least ______ classes would be required.
If the Laspeyres index is 140.78 and the Paasche index is 98.01, what is Fisher’s ideal
index?
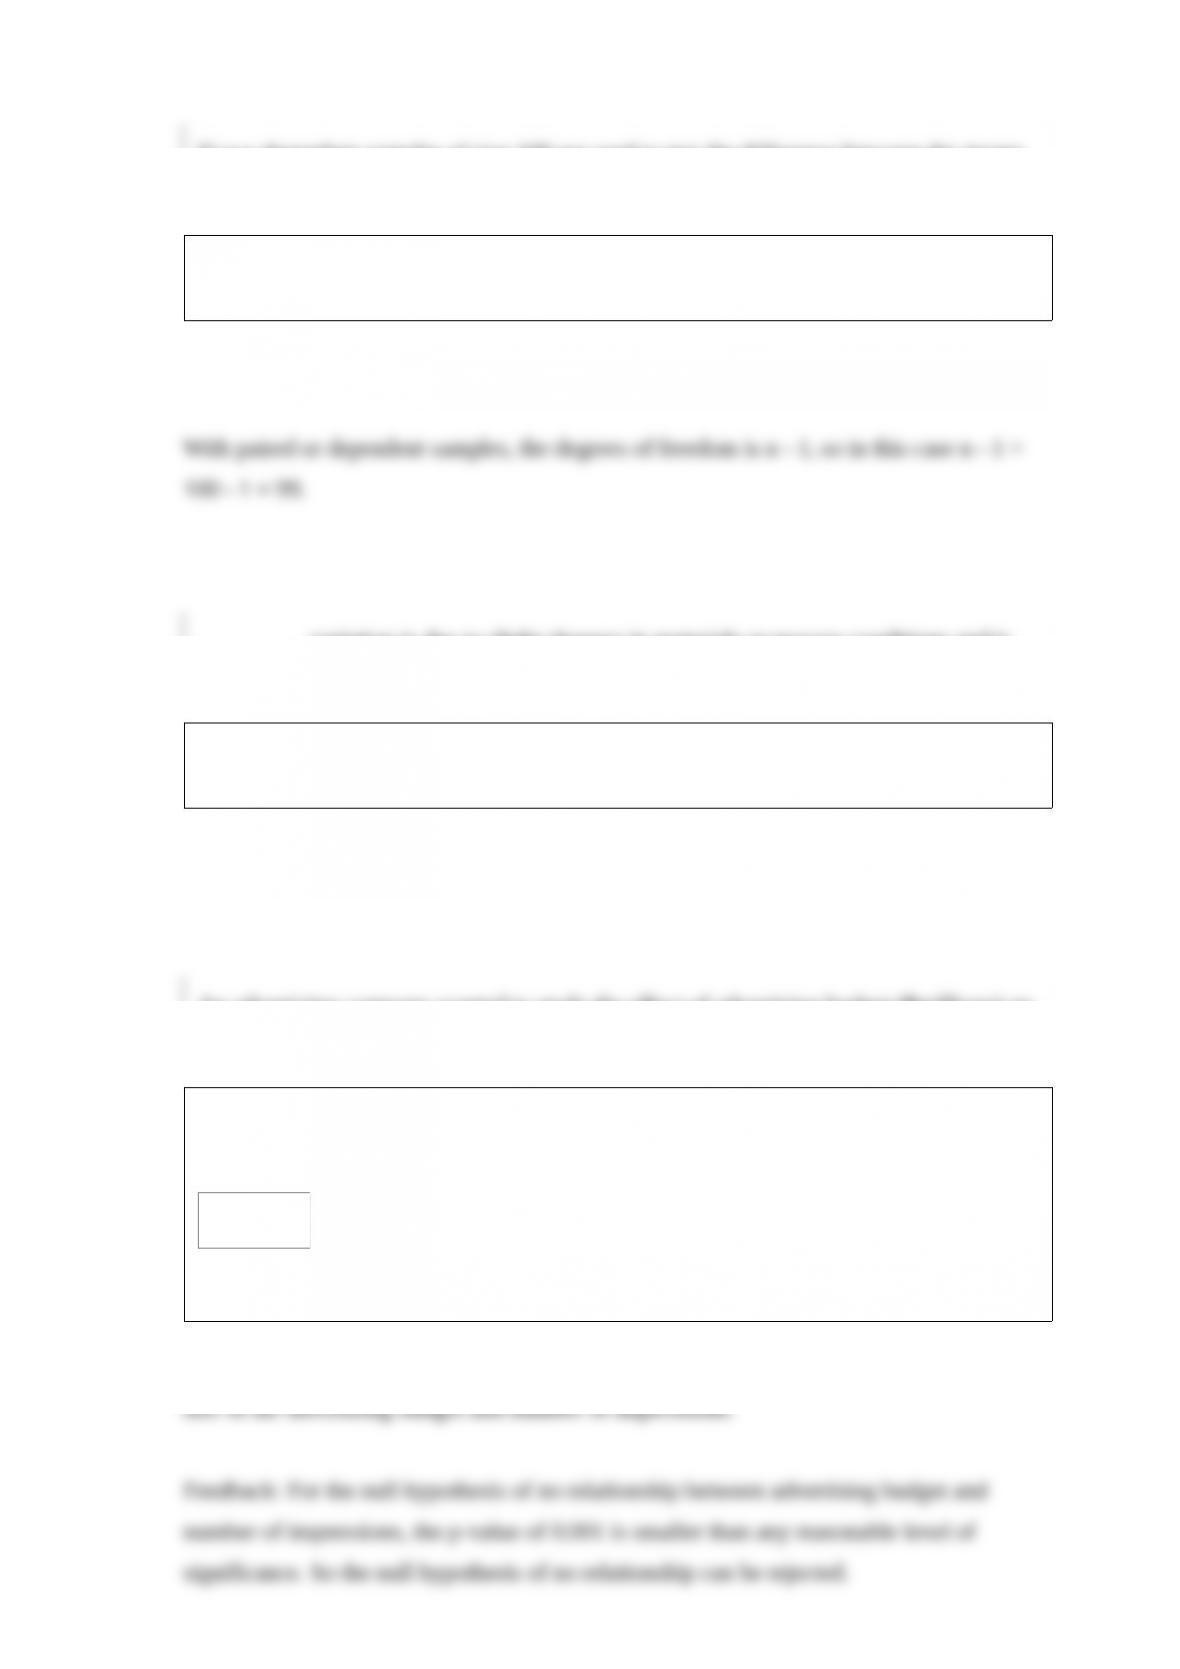
If two dependent samples of size 100 are used to test the difference between the means,
the degrees of freedom for a t-statistic are _____.
_________ variation is due to slight changes in materials or process conditions and is
random in nature.
An advertising company wanted to study the effect of advertising budget ($millions) on
the millions of ad impressions of consumers. The following regression analysis shows
the results of the study.
What is the decision regarding the null hypothesis that no relationship exists?
Assuming a normal population with a known population standard deviation, the z
statistic for a 99% confidence interval would be ______.
There are eight flights from Minneapolis to St. Cloud each day. The probability that any
one flight is late is 0.10. Using the binomial probability formula, what is the probability
that 1 or more are late?
A random sample of 15 recent home sales was selected to test the hypothesis that the
area of a home, in square feet, and the selling price are positively correlated. The
rejection region will fall in the ________ tail of a t distribution.