
The Poisson distribution or, the law of improbable events, is _______________
skewed.
The Canal Corporation recorded the last five annual percent changes in profit.
What is the mean annual percentage change over the last five years?
A new computer game has been developed and 80 veteran game players will test its
market potential. If 60 players liked the game, the probability that any veteran game
player will like the new computer game is ______.
The American Auto Association reports that the mean price per gallon of regular
gasoline is $3.10, with a population standard deviation of $0.20. Assume a random
sample of 16 gasoline stations is selected and their mean cost for regular gasoline is

computed. What is the probability that the difference between the sample mean and the
population mean is less than 0.01?
You have a decision to invest $10,000 in any of four different companies. You estimate
the probabilities that the economy will be favorable or unfavorable, and you estimate
the percent returns over the next year.
Based on expected value, what company do you choose?
The ________________ index measures the average change in prices received in the
primary markets of the United States by producers of commodities.

The following stem-and-leaf display reports the number of boats shipped per week by
Ottertail Boats, Inc.
11| 1 5 9
12| 0 1 2 2 6 9
13| 0 1 2 3 4 5 5 7 8 8 9
14| 2 6 8
15| 0 1 2 4 5 7 8 9
16| 1 5 7 9
What are the smallest and largest values?
The weight of a bag of corn chips is normally distributed with a mean of 22 ounces and
a standard deviation of 0.5 ounces. The probability that a bag of corn chips weighs
between 20.75 and 23.25 ounces is ____.
The sign test requires the populations to be _____________.
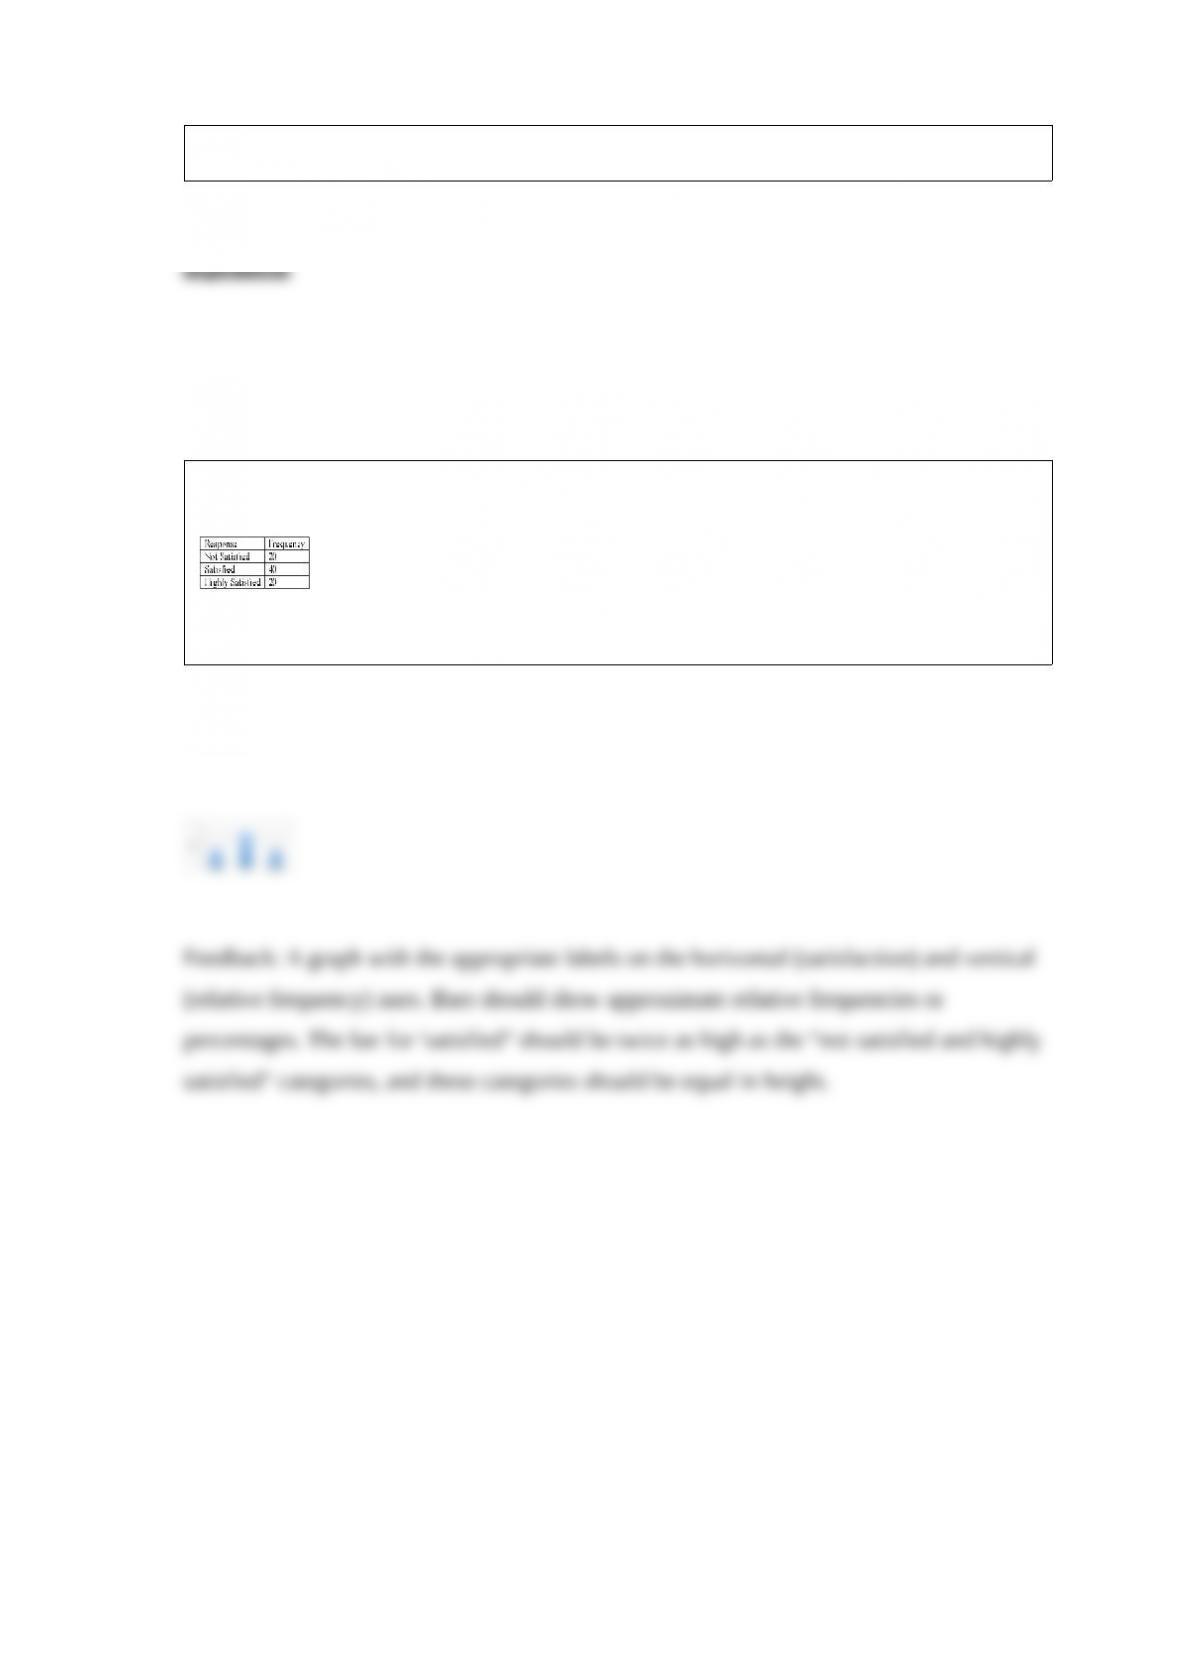
Refer to the following breakdown of responses to a survey of room cleanliness in a
hotel.
Draw a bar graph that illustrates the relative frequencies.