The hypothesis to test the slope of a regression equation is H0: α = 0.
A survey of 25 grocery stores revealed that the mean price of a gallon of milk was
$2.98, with a standard error of $0.10. What is the 95% confidence interval to estimate
the TRUE cost of a gallon of milk?
A. $2.81 to $3.15
B. $2.94 to $3.02
C. $2.77 to $3.19
D. $2.95 to $3.01
For a set of data arranged or sorted in numerical order, the value of the observation in
the center is called the weighted mean.
A survey of 25 grocery stores revealed that the mean price of a gallon of milk was
$2.98, with a standard error of $0.10. If 90% and 95% confidence intervals were
developed to estimate the TRUE cost of a gallon of milk, what similarities would they
have?
A. Both have the same confidence level
B. Both use the same t statistic
C. Both use the same z statistic
D. Both use the same point estimate of the population mean
A frequency polygon is a very useful graphic technique when comparing two or more
distributions.
Which statement is
When a blocking effect is included in an ANOVA, the result is a larger error sum of
squares.
If 40 samples of size 21 were selected from a population of 22,493, we would expect
the mean of the sample means and the population mean to be close but not exactly
equal.
A sample is a portion or part of the population of interest.
Optimists advocate a maximin strategy.
In a bar chart, the x-axis is labeled with the values of a qualitative variable.
For small samples, the test statistic for the sign test is the z statistic.
A hypothesis regarding the weight of newborn infants at a community hospital is that
the mean is 6.6 pounds. A sample of seven infants is randomly selected and their
weights at birth are recorded as 9.0, 7.3, 6.0, 8.8, 6.8, 8.4, and 6.6 pounds. What is the
alternate hypothesis?
A. H1: = 6.6
B. H1: ≠6.6
C. H1: ≥ 6.6
D. H1: > 7.6
The distribution of the annual incomes of a group of middle management employees
approximated a normal distribution with a mean of $37,200 and a standard deviation of
$800. About 68% of the incomes lie between what two incomes?
A. $30,000 and $40,000
B. $36,400 and $38,000
C. $34,800 and $39,600
D. $35,600 and $38,800
Refer to the following wage breakdown for a garment factory.
What is the class interval for the preceding table of wages?
A. $2
B. $3
C. $4
D. $5
The incomes of 50 loan applicants are obtained. Which level of measurement is
income?
A. Nominal
B. Ordinal
C. Interval
D. Ratio
A survey of property owners’ opinions about a street-widening project was taken to
determine if owners’ opinions were related to the distance between their home and the
street. A randomly selected sample of 100 property owners was contacted and the
results are shown next.
What is the critical value at the 10% level of significance?
A. 7.779
B. 9.236
C. 9.488
D. 11.070
What type of variable is the number of robberies reported in your city?
A. Attribute
B. Continuous
C. Quantitative
D. Qualitative
A study was conducted on the percent of total advertising dollars spent by ten local
firms for advertising in the press and on cable television. Results were ranked with a
resulting sum of squared differences equal to 128.
What is Spearman’s coefficient of rank correlation?
A. -0.871
B. +0.224
C. +0.234
D. -0.234
Using the following information:
What is the correlation coefficient?
A. 0.9184
B. 0.9583
C. -0.9583
D. 0.9004
What are the degrees of freedom used to test the significance of the slope in a simple
linear regression equation?
A. n – 1
B. n – 2
C. n – 1, n – 2
D. (n – 1)(n – 2)
In regression analysis, what is the predictor variable called?
A. Independent variable
B. Dependent variable
C. Correlation variable
D. Variable of determination
How many permutations of the three letters C, D, and E are possible?
A. 3
B. 0
C. 6
D. 8
The national sales manager for “I colored this” (ICT) T-shirts provides all salespersons
with the following opportunity loss table showing the potential lost profit for each
purchase decision or act from one to four dozen T-shirts. The probability of demand for
each state of nature is also shown.
What is the expected opportunity loss of purchasing one dozen T-shirts?
A. 84
B. 108
C. 156
D. 204
The regression equation is Ŷ = 30 + 2.56X, the sample size is 14, and the standard
error of the slope is 0.97. What is the test-statistic to test the significance of the slope?
A. z = -2.560
B. z = +2.639
C. t = +2.560
D. t = +2.639
For the following distribution:
What is the variance of the distribution?
A. 2.1
B. 0.132
C. 0.364
D. 1.000
A binomial distribution has 100 trials (n = 100) with a probability of success of 0.25 (Ï€
= 0.25). To apply the normal distribution to approximate the binomial, what are the
mean and standard deviation?
A. = 100 and σ = 0.25
B. = 25 and σ = 100
C. = 25 and σ = 4.33
D. = 100 and σ = 2500
What level of measurement is the Centigrade temperature scale?
A. Nominal
B. Ordinal
C. Interval
D. Ratio
For the following time series, you are given the moving average forecast.
The three-year moving average for 2004 is ______.
A. 22
B. 21
C. 14.33
D. 166
A new printing machine is set or calibrated to print 25 copies per minute. On each of
four days, the printer’s output is measured five times. The data will be used to construct
a process control chart to monitor the printing process. The results of the printing
process are in the following table.
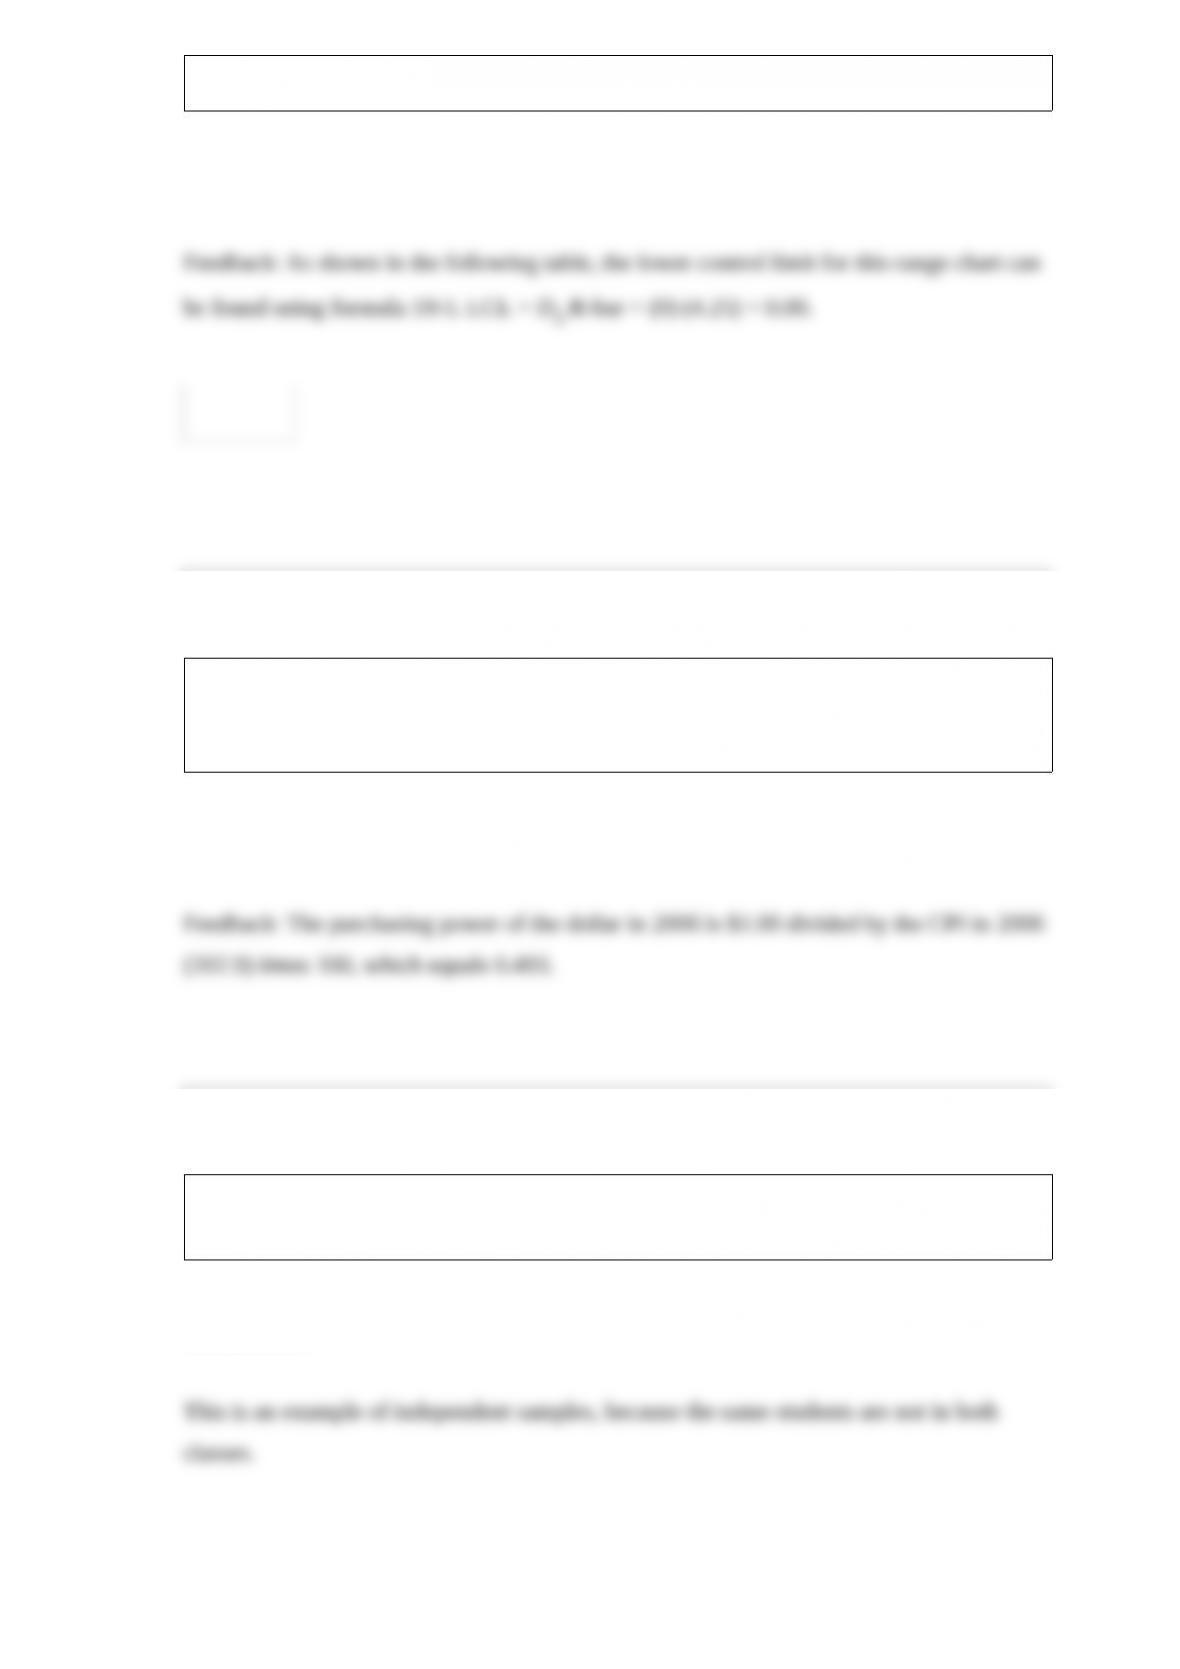
What is the value for the lower control limit (LCL) of the range chart?
Suppose your annual 2001 salary was $40,000 and your 2006 salary was $52,000.
Assume the annual CPI rose from 177.1 to 202.9 during this period of time. What was
the purchasing power of the dollar in 2006?
A statistics professor wants to compare grades in two different classes of the same
course. This is an example of _________ populations.
A soap manufacturer is experimenting with several formulas of soap powder. Three of
the formulas were selected for further testing by a panel of homemakers. The ratings for
the three formulas are as follows:
What is the sum of the ranks for Formula C?
A new printing machine is set or calibrated to print 25 copies per minute. On each of
four days, the printer’s output is measured five times. The data will be used to construct
a process control chart to monitor the printing process. The results of the printing
process are in the following table.
What is the value of the lower control limit factor for a range chart?
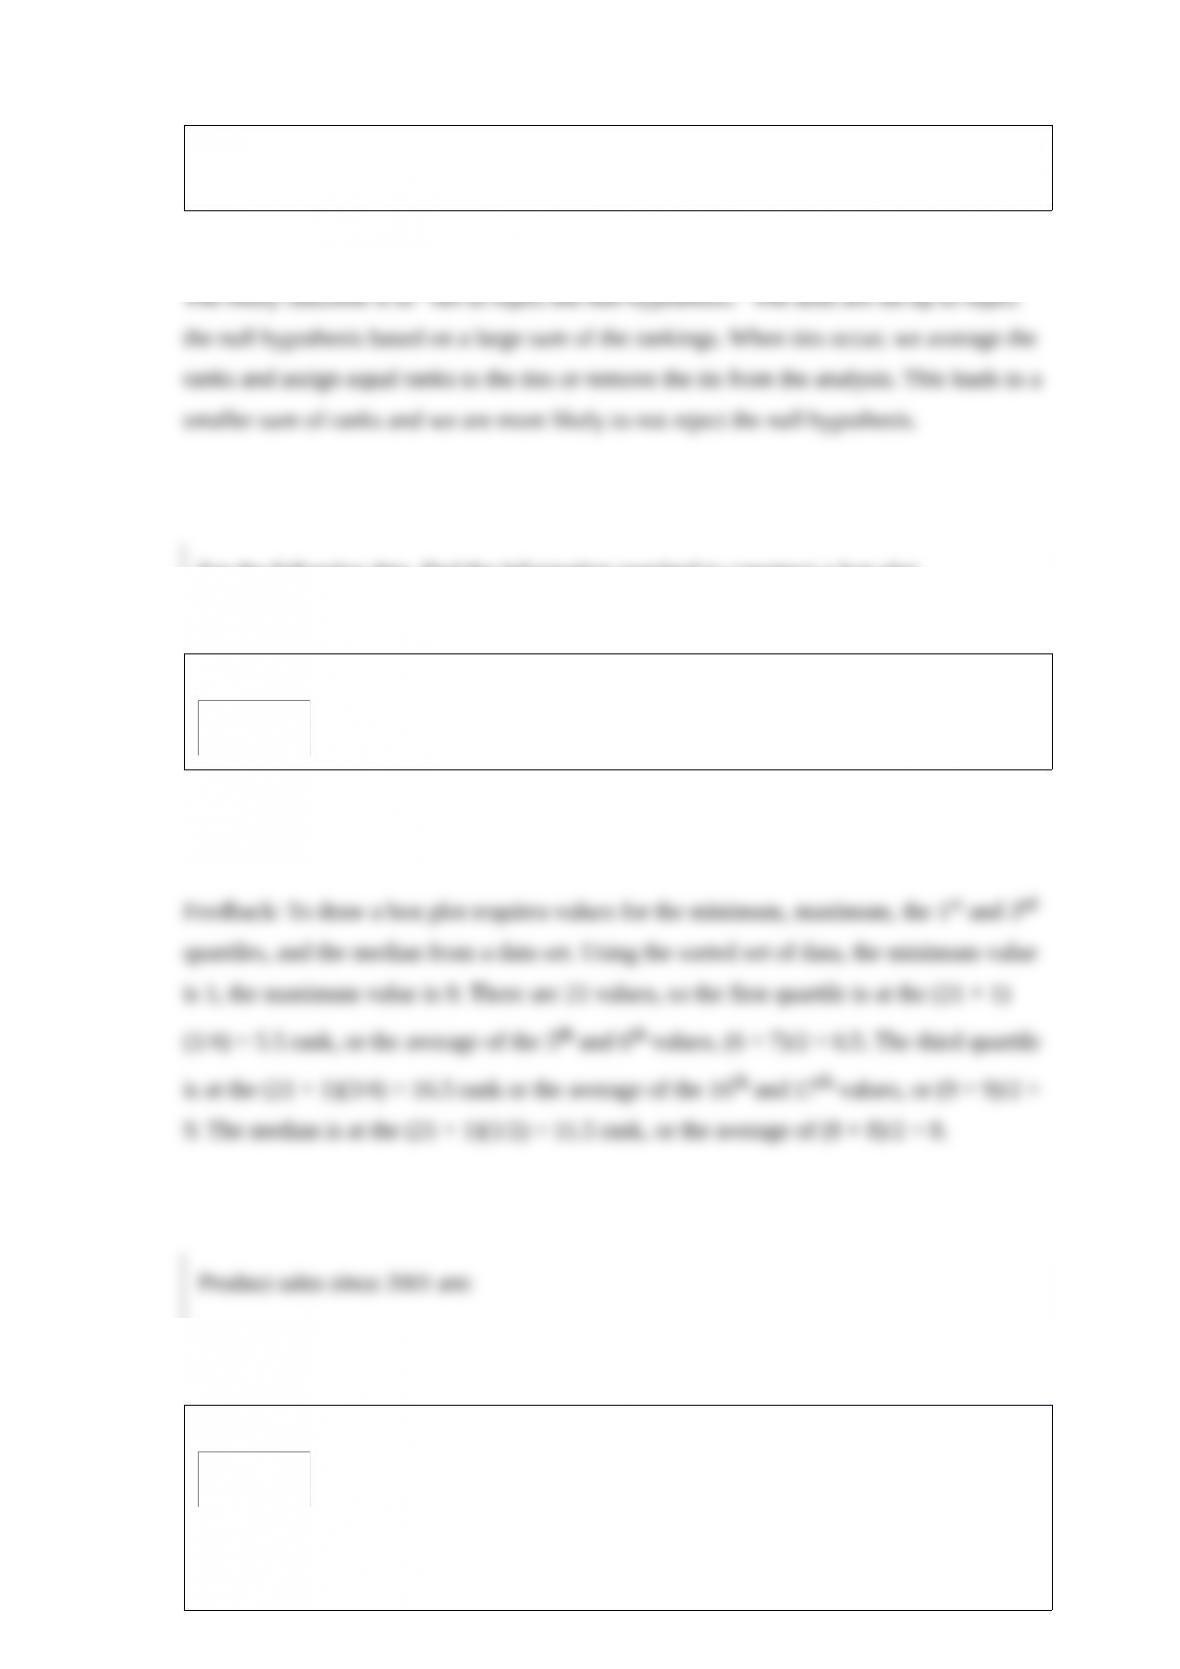
For a nonparametric test based on ranking the data, if a majority of the ranks are based
on ties, what is the likely outcome of a hypothesis test? Why?
For the following data, find the information required to construct a box plot.
Product sales since 2001 are:
The least squares trend equation is given as:
Ŷ = 100 + 28t, where t is set equal to 1 for 2001.

What is the three-year moving average for 2007 to 2009?