For the sampling distribution of sample means, sampling error will decrease as sample
size increases.
The arithmetic mean is the sum of the quantitative observations divided by the total
number of observations.
The Laspeyres method computes a weighted index.
Sampling a population is often necessary because the cost of studying all the items in
the population is prohibitive.

A point estimate is a range of values used to estimate a population parameter.
A correlation matrix shows individual correlation coefficients for all pairs of variables.
An economist is interested in predicting the unemployment rate based on gross
domestic product. Since the economist is interested in predicting unemployment, the
independent variable is gross domestic product.
A confidence interval for a population proportion uses the uniform distribution to
approximate the binomial distribution.

Interaction occurs when the relationship between an independent variable and a
dependent variable is affected by another independent variable.
The variance inflation factor is used to select or remove independent variables to reduce
the effects of multicollinearity in a multiple regression equation.
Knowing the seasonal pattern in the form of indexes allows the retailer to deseasonalize
sales. This is accomplished by dividing the actual sales for a month by the typical index
for that month.

A TRUE/ FALSE test consists of six questions. If you guess the answer to each
question, what is the probability of getting all six questions correct?
A. 0
B. 0.016
C. 0.062
D. 0.250
When data is collected using a qualitative, nominal variable, what is TRUE about a
frequency distribution that summarizes the data?
A. The upper and lower class limits must be calculated.
B. A pie chart can be used to summarize the data.
C. The number of classes is equal to the number of variable’s values plus 2.
D. The “5 to the k rule” can be applied.
An index number is a percent that measures the change in price, quantity, or value,
compared to a base period.
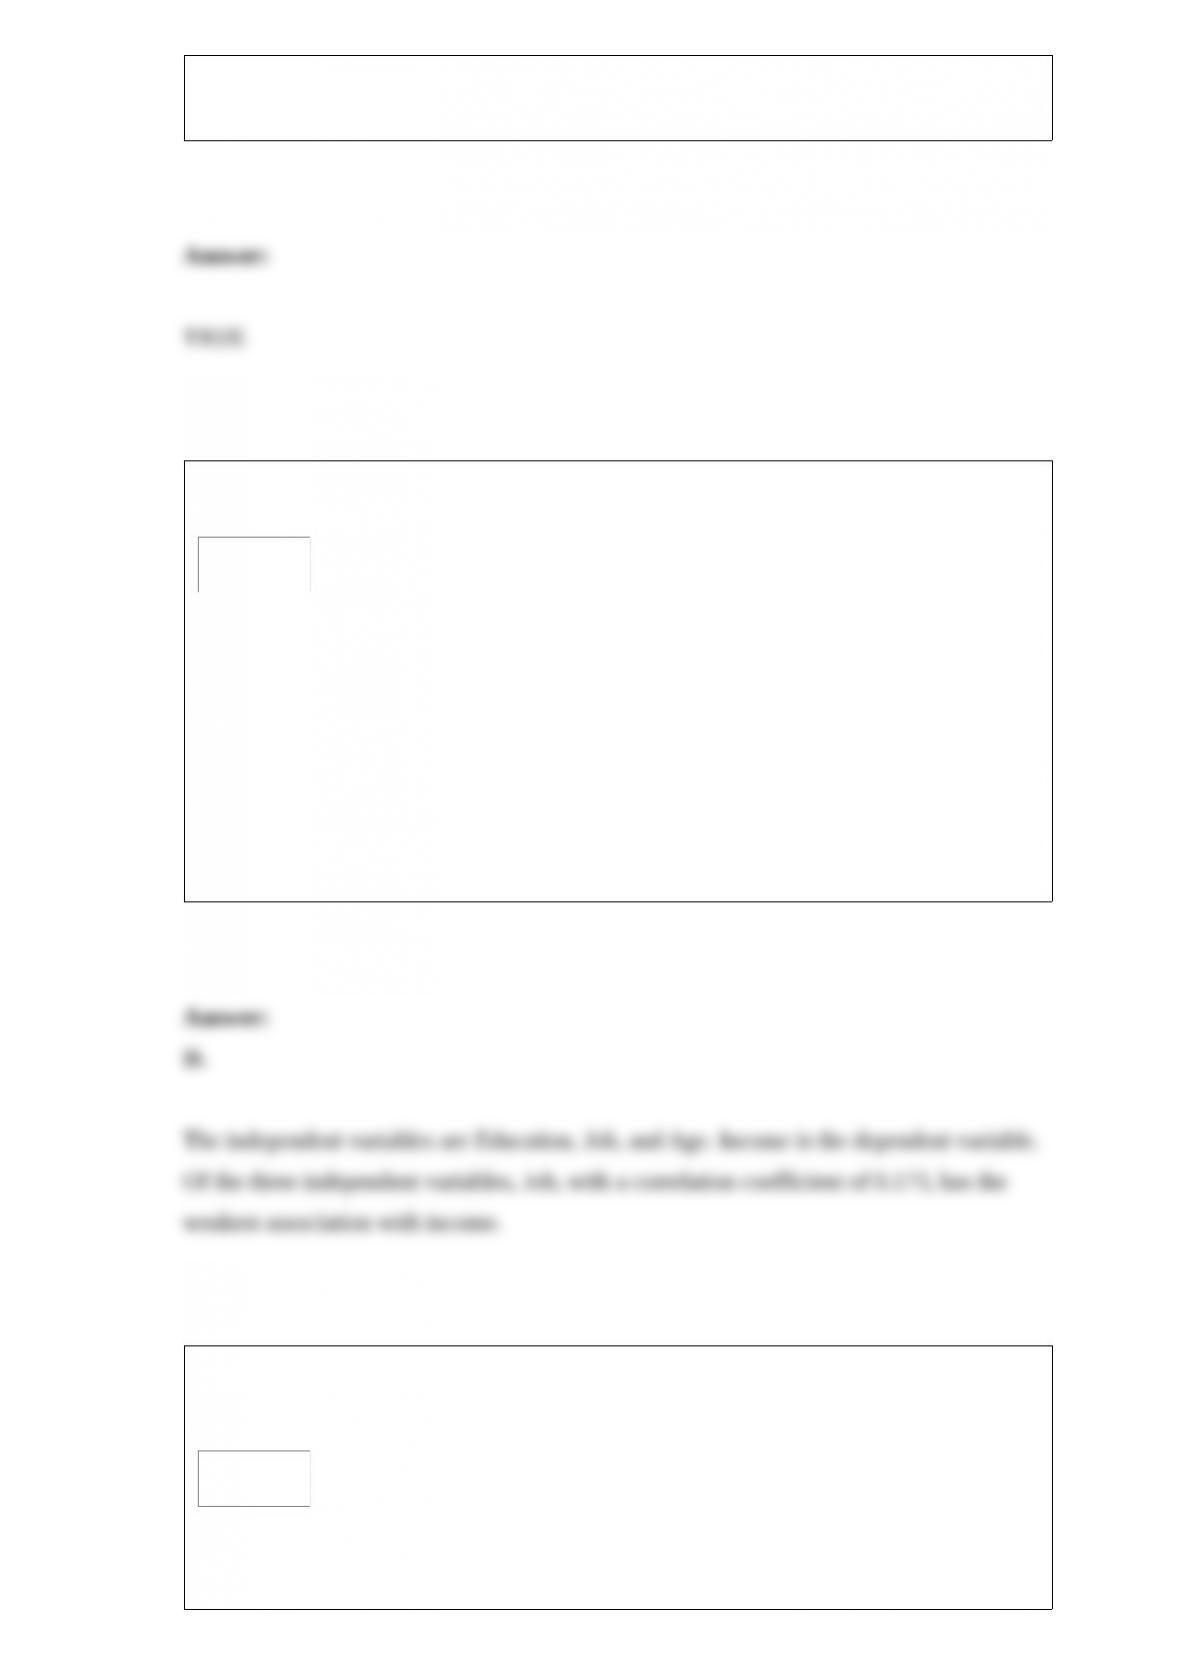
The following correlations were computed as part of a multiple regression analysis that
used education, job, and age to predict income.
Which independent variable has the weakest association with the dependent variable?
A. Income
B. Age
C. Education
D. Job
A company is studying the number of monthly absences among its 125 employees. The
following probability distribution shows the likelihood that people were absent 0, 1, 2,
3, 4, or 5 days last month.
What is the mean number of days absent?

A. 1.00
B. 0.40
C. 0.72
D. 2.5
A recent study of the relationship between social activity and education for a sample of
corporate executives showed the following results.
The appropriate test to analyze the relationship between social activity and education is
__________.
A. A regression analysis
B. An analysis of variance
C. A contingency table analysis
D. A goodness-of-fit test

The Nielsen Ratings break down the number of people watching a particular television
show by age. What level of measurement is age?
A. Nominal
B. Ordinal
C. Interval
D. Ratio
The manager of Paul’s fruit and vegetable store is considering the purchase of a new
seedless watermelon from a wholesale distributor. Since this seedless watermelon costs
$4, will sell for $7, and is highly perishable, he only expects to sell between six and
nine of them. What is the payoff value for the purchase of six watermelons when the
demand is for six watermelons?
A. 18
B. 21
C. 24
D. 42
A study was conducted on the percent of total advertising dollars spent by ten local
firms for advertising in the press and on cable television. Results were ranked with a
resulting sum of squared differences equal to 128.

What is the computed value of t?
A. 0.719
B. 0.804
C. 1.339
D. 0.650
The following graph is _______________.
A. Positively skewed
B. Negatively skewed
C. Symmetric
D. Uniformly distributed
The number of items produced and the price per item for the Duffy Manufacturing

Company are:
What is the value index of production for 2006 using 1990 as the base period?
A. 115.2
B. 72.9
C. 110.6
D. 127.1
A small sample of computer operators shows monthly incomes of $1,950, $1,775,
$2,060, $1,840, $1,795, $1,890, $1,925, and $1,810. What are these ungrouped
numbers called?
A. Histogram
B. Class limits
C. Class frequencies
D. Raw data
What is the chart called when the paired data (the dependent and independent variables)
are plotted?
A. A scatter diagram
B. A bar chart
C. A pie chart
D. A histogram
What statement do we make that determines if the null hypothesis is rejected?
A. Decision rule
B. Test statistic
C. Alternate hypothesis
D. Critical value
Suppose 1,600 of 2,000 registered voters sampled said they planned to vote for the
Republican candidate for president. Using the 0.95 degree of confidence, what is the
interval estimate for the population proportion (to the nearest 10th of a percent)?

A. 78.2% to 81.8%
B. 69.2% to 86.4%
C. 76.5% to 83.5%
D. 77.7% to 82.3%
Bones Brothers & Associates prepare individual tax returns. Over prior years, Bones
Brothers has maintained careful records regarding the time to prepare a return. The
mean time to prepare a return is 90 minutes and the standard deviation of this
distribution is 14 minutes. Suppose 100 returns from this year are selected and analyzed
regarding the preparation time. What is the probability that the mean time for the
sample of 100 returns is between 88 minutes and 92 minutes?
A. Approximately 1
B. 0.1664
C. 0.8336
D. 0.8472

A university surveyed recent graduates of the English Department for their starting
salaries. Four hundred graduates returned the survey. The average salary was $25,000.
The population standard deviation is $2,500. A 95% confidence interval is constructed.
What does the confidence interval mean?
A. The population mean is in the interval.
B. The population mean is not in the interval.
C. The likelihood that any confidence interval based on a sample of 400 graduates will
contain the population mean is 0.95.
D. There is a 5% chance that the computed interval does not contain the population
mean.
The manager of Paul’s fruit and vegetable store is considering the purchase of a new
seedless watermelon from a wholesale distributor. Since this seedless watermelon costs
$4, will sell for $7, and is highly perishable, he only expects to sell between six and
nine of them. What is the opportunity loss for purchasing seven watermelons when the
demand is for six watermelons?
A. 0
B. 3
C. 4
D. 6

A new machine is set or calibrated to fill tubes of toothpaste at precisely 6.75 ounces.
Then, once the machine is running, a sample of six tubes is taken every three hours and
weighed with the following results:
The measurement of quality is based on:
A. an attribute
B. a variable
C. a scale
D. a chart
Consider a two-tailed test with a level of confidence of 80.30%. The z-value is
________.
A. 2.58
B. 1.29
C. 0.85
D. 1.96

The mean number of travel days per year for salespeople employed by three hardware
distributors needs to be estimated with a 0.90 degree of confidence. For a small pilot
study, the mean was 150 days and the standard deviation was 14 days. If the population
mean is estimated within two days, how many salespeople should be sampled?
A. 133
B. 452
C. 511
D. 2,100
Refer to the following distribution of commissions:
What is the class interval?
A. 200
B. 300
C. 3,500
D. 400
A sample of 250 adults tried the new multigrain cereal “Wow!” A total of 187 rated it as
excellent. In a sample of 100 children, 66 rated it as excellent. Using the 0.1
significance level, the researcher wishes to show that adults like the cereal better than
children. Which of the following is the alternate hypothesis?
A. H1: πA = πC
B. H1: πA < πC
C. H1: πA > πC
D. H1: πA ≠πC
To conduct a test of hypothesis with a small sample, we make an assumption that
__________.
A. A larger computed value of t will be needed to reject the null hypothesis
B. The region of acceptance will be wider than for large samples
C. The confidence interval will be wider than for large samples
D. The population is normally distributed
The first card selected from a standard 52-card deck was a king. If it is returned to the
deck, what is the probability that a king will be drawn on the second selection?
A. 1/4 or 0.25
B. 1/13 or 0.077
C. 12/13 or 0.923
D. 1/3 or 0.33
In regression, if the relationship between the dependent and independent variables is
non-linear, a linear relationship between the variables can be achieved by:
A. including an interaction term.
B. multiplying by 100.
C. rescaling the variables.
D. adding another independent variable.
In a regression analysis, three independent variables are used in the equation based on a
sample of 40 observations. In the ANOVA table for a multiple regression analysis, what
are the degrees of freedom associated with the F-statistic?
A. 3 and 39
B. 4 and 40
C. 3 and 36
D. 2 and 39
In a Poisson distribution, each trial is ___________________.
If there is absolutely no relationship between two variables, Pearson’s r will equal
_____.
A person is trying to decide if they should buy a lottery ticket. The ticket costs $1.00. If
the ticket is a winner, the prize would be $10,000. Knowing that winning $10,000 is not
a certain outcome (state of nature), the person finds that the probability of winning is
0.0009. Based on this information, the following payoff table can be constructed.
Based on the expected monetary value of buying a ticket, what is the best decision?
In a survey of employee satisfaction, the following table summarizes the results in
terms of employee satisfaction and gender.
What is the probability that an employee is satisfied, given that the employee is male?
A company is researching the effectiveness of a new website design to decrease the
time to access a website. Five website users were randomly selected and their times (in
seconds) to access the website with the old and new designs were recorded. The results
follow.
Let α = 0.05. Is the mean time to access the new website design shorter, or is (time for
the old design – time for the new design) greater than zero? Express your answer in
terms of the null hypothesis.
A person is trying to decide if they should buy a lottery ticket. The ticket costs $1.00. If
the ticket is a winner, the prize would be $10,000. Knowing that winning $10,000 is not
a certain outcome (state of nature), the person finds that the probability of winning is
0.0009. Based on this information, the following payoff table can be constructed.
What is the expected monetary value of buying the ticket?