Archives
Chapter 1 Banking The Most Common Type Industry Among
CHAPTER 1—DATA AND STATISTICS MULTIPLE CHOICE 1. Which of the following is an example of quantitative data? a. the player’s number on a baseball uniform b. the serial number on a one-dollar bill c. the part number of an inventory […]
Chapter 10 Eight observations were selected from each of 3 populations
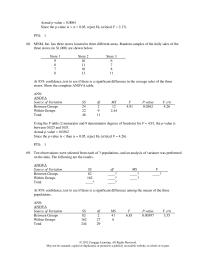
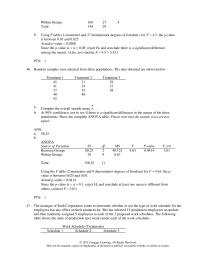
Actual p-value = 0.0004 Since the p-value is < = 0.05, reject H0 (critical F = 2.17). PTS: 1 68. MNM, Inc. has three stores located in three different areas. Random samples of the daily sales of the three […]
Chapter 10 If we are interested in testing whether the mean of population
CHAPTER 10—COMPARISONS INVOLVING MEANS, EXPERIMENTAL DESIGN, AND ANALYSIS OF VARIANCE MULTIPLE CHOICE 1. In making three pairwise comparisons, what is the experiment-wise Type I error rate ew if the comparison-wise Type I error rate is .10? a. .001 […]
Chapter 10 Independent random samples taken on two university campuses
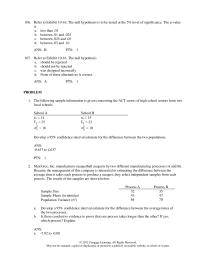
106. Refer to Exhibit 10-16. The null hypothesis is to be tested at the 5% level of significance. The p-value is a. less than .01 b. between .01 and .025 c. between .025 and .05 d. between .05 and .10 […]
Chapter 10 The manager of Roth Corporation wants to determine whether
Within Groups 108 27 4 Total 144 29 b. Using F table (2 numerator and 27 denominator degrees of freedom), for F = 4.5, the p-value is between 0.01 and 0.025 Actual p-value = 0.0206 Since the p-value is < […]
Chapter 11 Equal rights Amendment The Following Contingency Table Shows
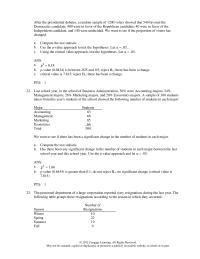
After the presidential debates, a random sample of 1200 voters showed that 540 favored the Democratic candidate; 480 were in favor of the Republican candidate; 40 were in favor of the Independent candidate, and 140 were undecided. We want to […]
Chapter 11 The assumptions for the multinomial experiment parallel those
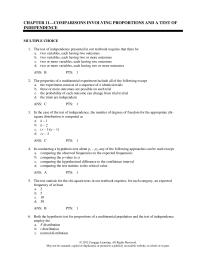
CHAPTER 11—COMPARISONS INVOLVING PROPORTIONS AND A TEST OF INDEPENDENCE MULTIPLE CHOICE 1. The test of independence presented in our textbook requires that there be a. two variables, each having two outcomes b. two variables, each having two or more outcomes […]
Chapter 12 2 perform a t test and determine whether or not demand
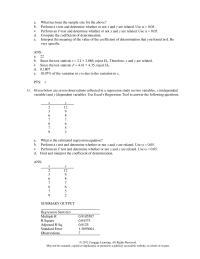
a. What has been the sample size for the above? b. Perform a t-test and determine whether or not x and y are related. Use = 0.05. c. Perform an F-test and determine whether or not x and y […]
Chapter 12 Company Has Recorded Data The Daily Demand
CHAPTER 12—SIMPLE LINEAR REGRESSION MULTIPLE CHOICE 1. The proportion of the variation in the dependent variable y that is explained by the estimated regression equation is measured by the a. correlation coefficient b. standard error of the estimate c. coefficient […]
Chapter 13 2 test to see if there is a significant relationship between
x3 -4.00 1.00 a. Use the above results and write the regression equation. b. Compute the coefficient of determination and fully interpret its meaning. c. Is the regression model significant? Perform an F test and let = 0.05. d. […]
Chapter 13 The numerical value of the coefficient of determination
CHAPTER 13—MULTIPLE REGRESSION MULTIPLE CHOICE 1. If a qualitative variable has k levels, the number of dummy variables required is a. k − 1 b. k c. k + 1 d. 2k ANS: A PTS: 1 2. As the goodness […]
Chapter 14 Compute The Upper Limit Center Line And
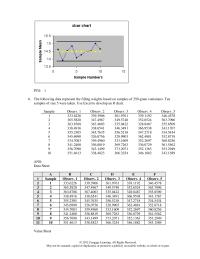
PTS: 1 6. The following data represent the filling weights based on samples of 350-gram containers. Ten samples of size 5 were taken. Use Excel to develop an R chart. Sample Observ. 1 Observ. 2 Observ. 3 Observ. 4 Observ. […]
Chapter 14 The general practice in quality control is to set the control chart’s
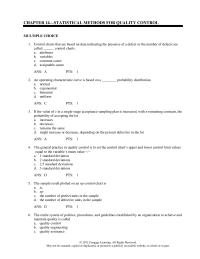
CHAPTER 14—STATISTICAL METHODS FOR QUALITY CONTROL MULTIPLE CHOICE 1. Control charts that are based on data indicating the presence of a defect or the number of defects are called ______ control charts. a. attributes b. variables c. common-cause d. assignable-cause […]
Chapter 15 below you are given the seasonal factors and the estimated
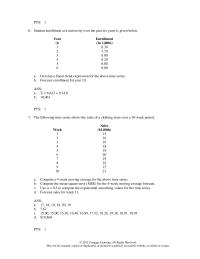
PTS: 1 6. Student enrollment at a university over the past six years is given below. Year Enrollment (t) (In 1,000s) 1 6.30 2 7.70 3 8.00 4 8.20 5 8.80 6 8.00 a. Develop a linear trend expression for […]
Chapter 15 Which of the following smoothing constants would make an
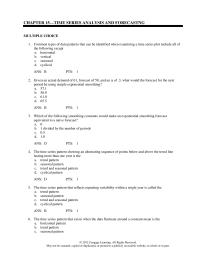
CHAPTER 15—TIME SERIES ANALYSIS AND FORECASTNG MULTIPLE CHOICE 1. Common types of data patterns that can be identified when examining a time series plot include all of the following except a. horizontal b. vertical c. seasonal d. cyclical ANS: B […]
Chapter 2 Also Can Noted That 10 Females Sat
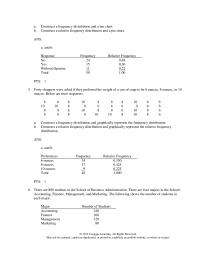
a. Construct a frequency distribution and a bar chart. b. Construct a relative frequency distribution and a pie chart. ANS: a. and b. Response Frequency Relative Frequency No 24 0.48 Yes 15 0.30 Without Opinion 11 0.22 Total 50 1.00 […]
Chapter 2 The sum of the relative frequencies for all classes
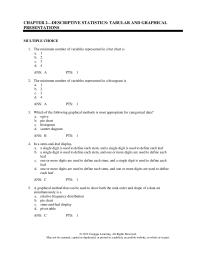
CHAPTER 2—DESCRIPTIVE STATISTICS: TABULAR AND GRAPHICAL PRESENTATIONS MULTIPLE CHOICE 1. The minimum number of variables represented in a bar chart is a. 1 b. 2 c. 3 d. 4 ANS: A PTS: 1 2. The minimum number of variables represented […]
Chapter 3 Suppose annual salaries for sales associates from a particular
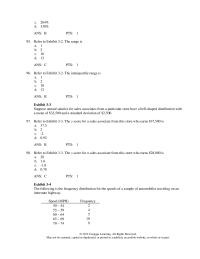
c. 264% d. 330% ANS: B PTS: 1 95. Refer to Exhibit 3-2. The range is a. 1 b. 2 c. 10 d. 12 ANS: C PTS: 1 96. Refer to Exhibit 3-2. The interquartile range is a. 1 b. […]
Chapter 3 The Variance Sample Observations Equals
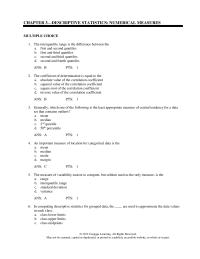
CHAPTER 3—DESCRIPTIVE STATISTICS: NUMERICAL MEASURES MULTIPLE CHOICE 1. The interquartile range is the difference between the a. first and second quartiles b. first and third quartiles c. second and third quartiles d. second and fourth quartiles ANS: B PTS: 1 […]
Chapter 4 The “Top Three” at a racetrack consists of picking the correct
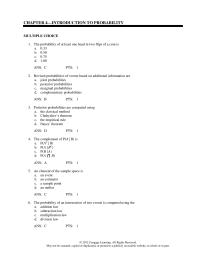
CHAPTER 4—INTRODUCTION TO PROBABILITY MULTIPLE CHOICE 1. The probability of at least one head in two flips of a coin is a. 0.33 b. 0.50 c. 0.75 d. 1.00 ANS: C PTS: 1 2. Revised probabilities of events based on […]
Chapter 4 What The Probability Getting Raise c Are Getting
c. 8/12 PTS: 1 9. A very short quiz has one multiple-choice question with five possible choices (a, b, c, d, e) and one true or false question. Assume you are taking the quiz but do not have any idea […]
Chapter 5 A random variable that can assume only a finite number of values
CHAPTER 5—DISCRETE PROBABILITY DISTRIBUTIONS MULTIPLE CHOICE 1. A numerical description of the outcome of an experiment is called a a. descriptive statistic b. probability function c. variance d. random variable ANS: D PTS: 1 2. A random variable that can […]
Chapter 5 What The Probability That Less Than Four
d. Not enough information is given to answer this question. ANS: B PTS: 1 97. Refer to Exhibit 5-11. The appropriate probability distribution for the random variable is a. discrete b. continuous c. either a or b depending on how […]
Chapter 6 Ninety five Percent The Bottles Will Contain Least
c. 0.0668 d. zero ANS: D PTS: 1 Exhibit 6-7 f(x) = (1/10) e-x/10 x 0 95. Refer to Exhibit 6-7. The mean of x is a. 0.10 b. 10 c. 100 d. 1,000 ANS: B PTS: 1 96. […]
Chapter 6 Whenever the probability is proportional to the length of
CHAPTER 6—CONTINUOUS PROBABILITY DISTRIBUTIONS MULTIPLE CHOICE 1. If arrivals follow a Poisson probability distribution, the time between successive arrivals must follow a. a Poisson probability distribution b. a normal probability distribution c. a uniform probability distribution d. an exponential probability […]
Chapter 8 The sample size that guarantees all estimates of proportions
CHAPTER 8—INTERVAL ESTIMATION MULTIPLE CHOICE 1. As the degrees of freedom increase, the t distribution approaches the a. uniform distribution b. normal distribution c. exponential distribution d. p distribution ANS: B PTS: 1 2. If the margin of error in […]
Chapter 8 What Size Sample Should Selected Obtain 095
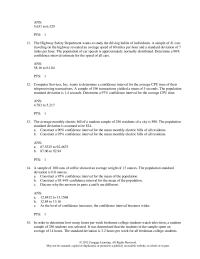
© 2012 Cengage Learning. All Rights Reserved. May not be scanned, copied or duplicated, or posted to a publicly accessible website, in whole or in part. 11. The Highway Safety Department wants to study the driving habits of individuals. A […]
Chapter 9 Assume The Distribution The Population Is normal Let
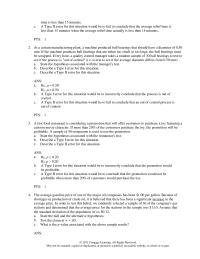
time is less than 15 minutes. c. A Type II error for this situation would be to fail to conclude that the average relief time is less than 15 minutes when the average relief time actually is less than 15 […]
Chapter 9 Two approaches to drawing a conclusion in a hypothesis test area
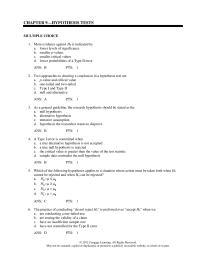
CHAPTER 9—HYPOTHESIS TESTS MULTIPLE CHOICE 1. More evidence against H0 is indicated by a. lower levels of significance b. smaller p-values c. smaller critical values d. lower probabilities of a Type II error ANS: B PTS: 1 2. Two approaches […]