CHAPTER 14—STATISTICAL METHODS FOR QUALITY CONTROL
MULTIPLE CHOICE
1. Control charts that are based on data indicating the presence of a defect or the number of defects are
called ______ control charts.
a.
attributes
b.
variables
c.
common-cause
d.
assignable-cause
2. An operating characteristic curve is based on a ________ probability distribution.
a.
normal
b.
exponential
c.
binomial
d.
uniform
3. If the value of c in a single-stage acceptance sampling plan is increased, with n remaining constant, the
probability of accepting the lot
a.
increases
b.
decreases
c.
remains the same
d.
might increase or decrease, depending on the percent defective in the lot
4. The general practice in quality control is to set the control chart’s upper and lower control limit values
equal to the variable’s mean value +/−
a.
1 standard deviation
b.
2 standard deviations
c.
2.5 standard deviations
d.
3 standard deviations
5. The sample result plotted on an np control chart is
a.
np
b.
np
c.
the number of perfect units in the sample
d.
the number of defective units in the sample
6. The entire system of policies, procedures, and guidelines established by an organization to achieve and
maintain quality is called
a.
quality control
b.
quality engineering
c.
quality assurance
d.
Both quality control and quality engineering are correct.
7. Quality assurance consists of
a.
quality control
b.
quality engineering
c.
quality assurance
d.
Both quality control and quality engineering are correct.
8. __________ consist(s) of making a series of inspections and measurements to determine whether
quality standards are being met.
a.
Quality control
b.
Quality engineering
c.
Quality assurance
d.
Both quality control and quality engineering are correct.
9. Which of the following is a statistical method used in quality control?
a.
statistical process control
b.
acceptance sampling
c.
Both statistical process control and acceptance sampling are correct.
d.
None of the other answers is correct.
10. Variation in the quality of production output that is due to factors such as machine tools wearing out is
called
a.
common-cause variation
b.
assignable-cause variation
c.
acceptable-cause variation
d.
natural-cause variation
11. Normal or natural variation in the quality of production output that is due purely to chance is called
a.
common-cause variation
b.
assignable-cause variation
c.
control-cause variation
d.
correctable-cause variation
12. A graphical tool used to help determine whether a process is in control or out of control is a
a.
scatter diagram
b.
histogram
c.
control chart
d.
None of the other answers is correct.
13. Which of the following is not a type of a control chart?
a.
a p chart
b.
an x-bar chart
c.
an R chart
d.
All of these are types of control charts.
14. A control chart used when the output of a process is measured in terms of the mean value of a variable
such as a length, weight, temperature, and so on is
a.
a p chart
b.
an x-bar chart
c.
an R chart
d.
an np chart
15. The control limits for an x-bar chart are how many standard deviations above and below the process
mean?
a.
one
b.
two
c.
three
d.
four
16. A control chart that is used when the output of a production process is measured in terms of the
proportion defective is
a.
a p chart
b.
an x-bar chart
c.
an R chart
d.
an np chart
17. If the calculated lower-control limit of a p chart is negative,
a.
a mistake has been made in the calculations
b.
use the absolute value of the lower limit
c.
it is set to zero
d.
None of the other answers is correct.
18. The control limits for a p chart are how many standard deviations above and below the proportion
defective?
a.
one
b.
two
c.
three
d.
four
19. A control chart that is used to monitor the range of the measurements in a sample is
a.
a p chart
b.
an x-bar chart
c.
an R chart
d.
an np chart
20. A control chart that is used to monitor the number of defectives in a sample is
a.
a p chart
b.
an x-bar chart
c.
an R chart
d.
an np chart
21. The control limits for an np chart are how many standard deviations above and below the expected
number of defectives?
a.
one
b.
two
c.
three
d.
four
22. A group of items such as incoming shipments of raw material is called
a.
a sample plan
b.
an incoming control
c.
a lot
d.
None of the other answers is correct.
23. A statistical procedure in which the number of defective items found in a sample is used to determine
whether a lot should be accepted or rejected is called
a.
statistical process control
b.
acceptance sampling
c.
quality assurance
d.
control charts
24. In acceptance sampling, the risk of rejecting a good quality lot is known as
a.
consumer’s risk
b.
producer’s risk
c.
a Type II error
d.
None of the other answers is correct
25. Producer’s risk is
a.
the same as the consumer’s risk
b.
a Type II error
c.
a Type I error
d.
None of the other answers is correct.
26. In acceptance sampling, the risk of accepting a poor quality lot is known as
a.
consumer’s risk
b.
producer’s risk
c.
a Type I error
d.
None of the other answers is correct.
27. Consumer’s risk is
a.
the same concept as the producer’s risk
b.
a Type II error
c.
a Type I error
d.
None of the other answers is correct.
28. Accepting a good-quality lot would be a
a.
Type I error
b.
Type II error
c.
correct decision
d.
None of the other answers is correct.
29. Rejecting a poor-quality lot would be a
a.
Type I error
b.
Type II error
c.
correct decision
d.
None of the other answers is correct.
30. A graph showing the probability of accepting the lot as a function of the percent defective in the lot is
a.
a power curve
b.
a control chart
c.
an operating characteristic curve
d.
None of the other answers is correct.
31. The maximum number of defective items that can be found in the sample and still lead to acceptance
of the lot is
a.
the upper control limit
b.
the lower control limit
c.
the acceptance criterion
d.
None of the other answers is correct.
32. A form of acceptance sampling in which more than one sample or stage is used is called a
a.
single-sample plan
b.
multiple-sampling plan
c.
multinomial sampling plan
d.
None of the other answers is correct.
33. Juran proposed a simple definition of quality:
a.
customer satisfaction
b.
conformance to specifications
c.
fitness for use
d.
commitment to excellence
34. The three quality processes on which Juran’s approach to quality focused include all of the following
except
a.
quality planning
b.
quality execution
c.
quality control
d.
quality improvement
35. In contrast to Deming’s philosophy, which required a major cultural change in the organization,
Juran’s programs were designed to improve quality by
a.
working within the current organizational system
b.
reducing the number of levels in the organizational structure
c.
changing customer perception and expectations
d.
identifying and replacing the most counter-productive employees
36. The Malcolm Baldrige National Quality Award was established in
a.
1954
b.
1971
c.
1987
d.
1993
37. When a Motorola executive said “That evaluation is …. perhaps the most cost-effective, value-added
business consultation available anywhere in the world today” he was referring to
a.
ISO 9000 standards
b.
the Six Sigma philosophy
c.
Deming’s 14 Points
d.
the Malcolm Baldrige Quality Award
38. Six Sigma represents a quality level of at most ____ defects per million opportunities.
a.
3.4
b.
6.0
c.
19.7
d.
99.5
39. DFSS stands for
a.
Defects Found Sifting and Sorting
b.
Design For Six Sigma
c.
Deviation From Specifications and Standards
d.
Defer For Statistical Study
40. The second stage of a two-stage acceptance sampling plan is executed when the first-stage result is
a.
x1 > c1
b.
c1 < x1 < c2
c.
x1 > c2
d.
x1 > c1 + c2
41. If the value of c in a single-stage sampling plan is increased, with n remaining constant, the probability
of accepting the lot
a.
increases
b.
decreases
c.
is unchanged
d.
might increase or decrease, depending on the lot percent defective
42. The two general classifications of attributes in quality control are
a.
random and predictable
b.
controllable and uncontrollable
c.
variable and constant
d.
defective and nondefective
43. Control charts based on data that can be measured on a continuous scale are called
a.
normal control charts
b.
variables control charts
c.
attributes control charts
d.
precision control charts
44. In practice, it is common to use the sample _____ to estimate the process _________.
a.
variances, range
b.
means, variance
c.
standard deviations, mean
d.
ranges, standard deviation
45. Process control and acceptance sampling procedures are most closely related to
a.
linear regression procedures
b.
interval estimation procedures
c.
hypothesis testing procedures
d.
analysis of variance procedures
46. We can examine the effect of the sampling plan on both types of risks by varying the assumed
a.
percentage of defective items in the lot
b.
number of defective items in the sample
c.
probability of accepting the lot
d.
number of units in the lot
47. The process mean and standard deviation can be estimated by using samples that are selected from the
process when
a.
it has only assignable-cause variation
b.
its output is uniformly distributed
c.
it is assumed to be operating in control
d.
it is operating at peak capacity
48. Heavy emphasis on statistical analysis and careful measurement are closely associated with
a.
Total Quality
b.
ISO 9000
c.
Baldrige National Quality Program
d.
Six Sigma
PROBLEM
1. A soft drink filling machine is set up to fill bottles with 12 ounces of soft drink. The standard deviation
s is known to be 0.4 ounces. The quality control department periodically selects samples of 16 bottles
and measures their contents. Assume the distribution of filling volumes is normal.
a.
Determine the upper and lower control limits and explain what they indicate.
b.
The means of six samples were 11.8, 12.2, 11.9, 11.9, 12.1, and 11.8 ounces. Construct an
x-bar chart and indicate whether or not the process is in control.
UCL = 11.7, LCL = 12.3
b.
Process is in control
2. A production process that is in control has a mean () of 80 and a standard deviation () of 10.
a.
Determine the upper and the lower control limits for sample sizes of 25.
b.
Five samples had means of 81, 84, 75, 83, and 79. Construct an x-bar chart and explain whether
or not the process is in control.
LCL = 74, UCL = 86
b.
The process is in control.
3. The upper and lower control limits of a process are 66 and 54. Samples of size 16 are used for the
inspection process. Determine the mean and the standard deviation for this process.
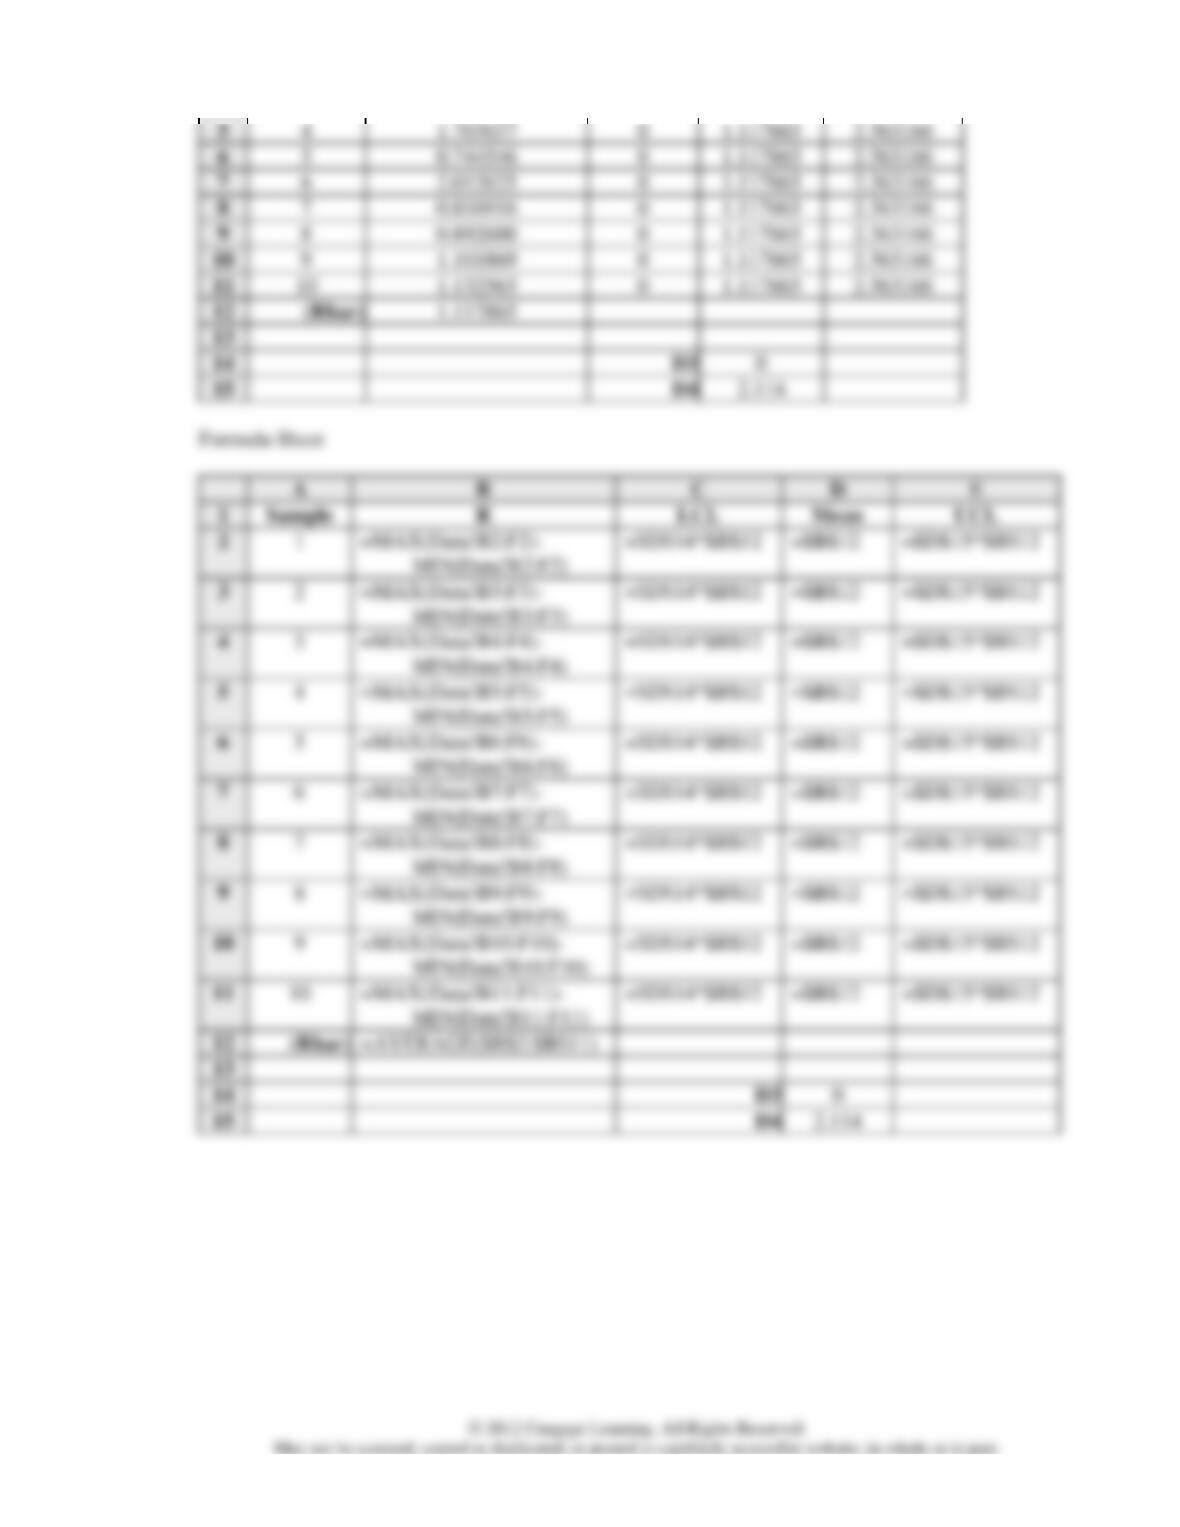
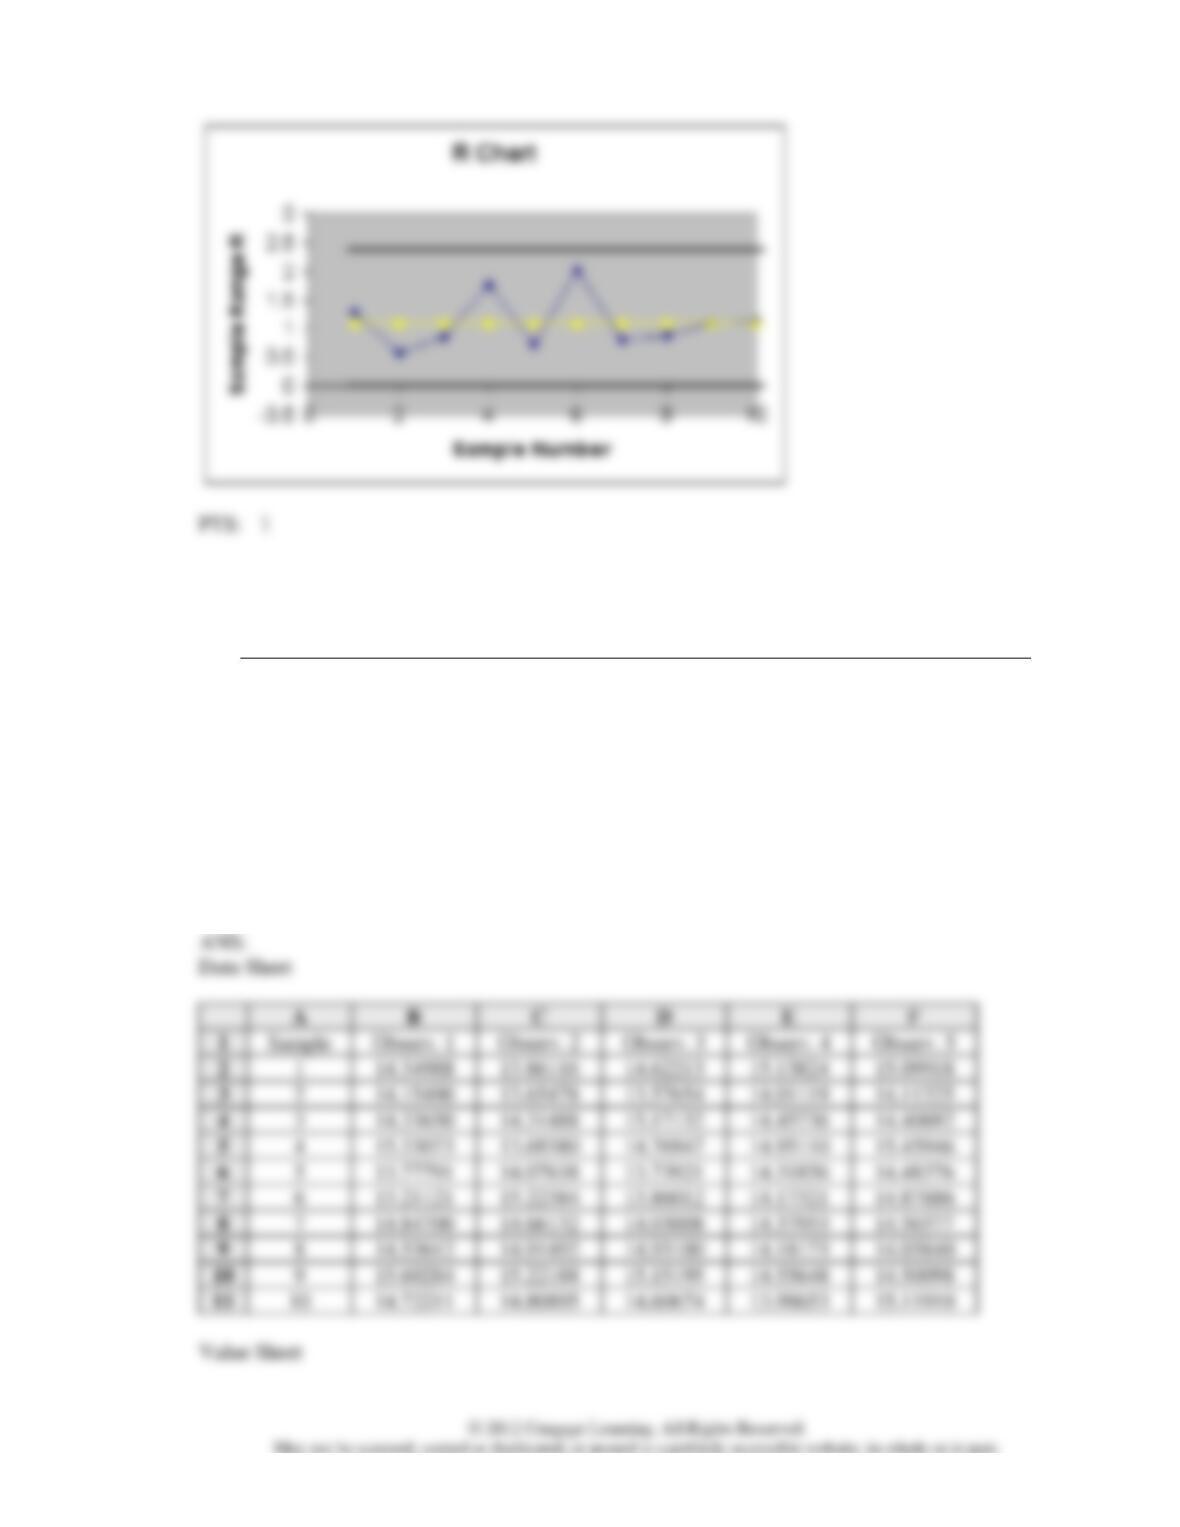
4. The following data represent the filling weights based on samples of 14.5 ounce cans of whole peeled
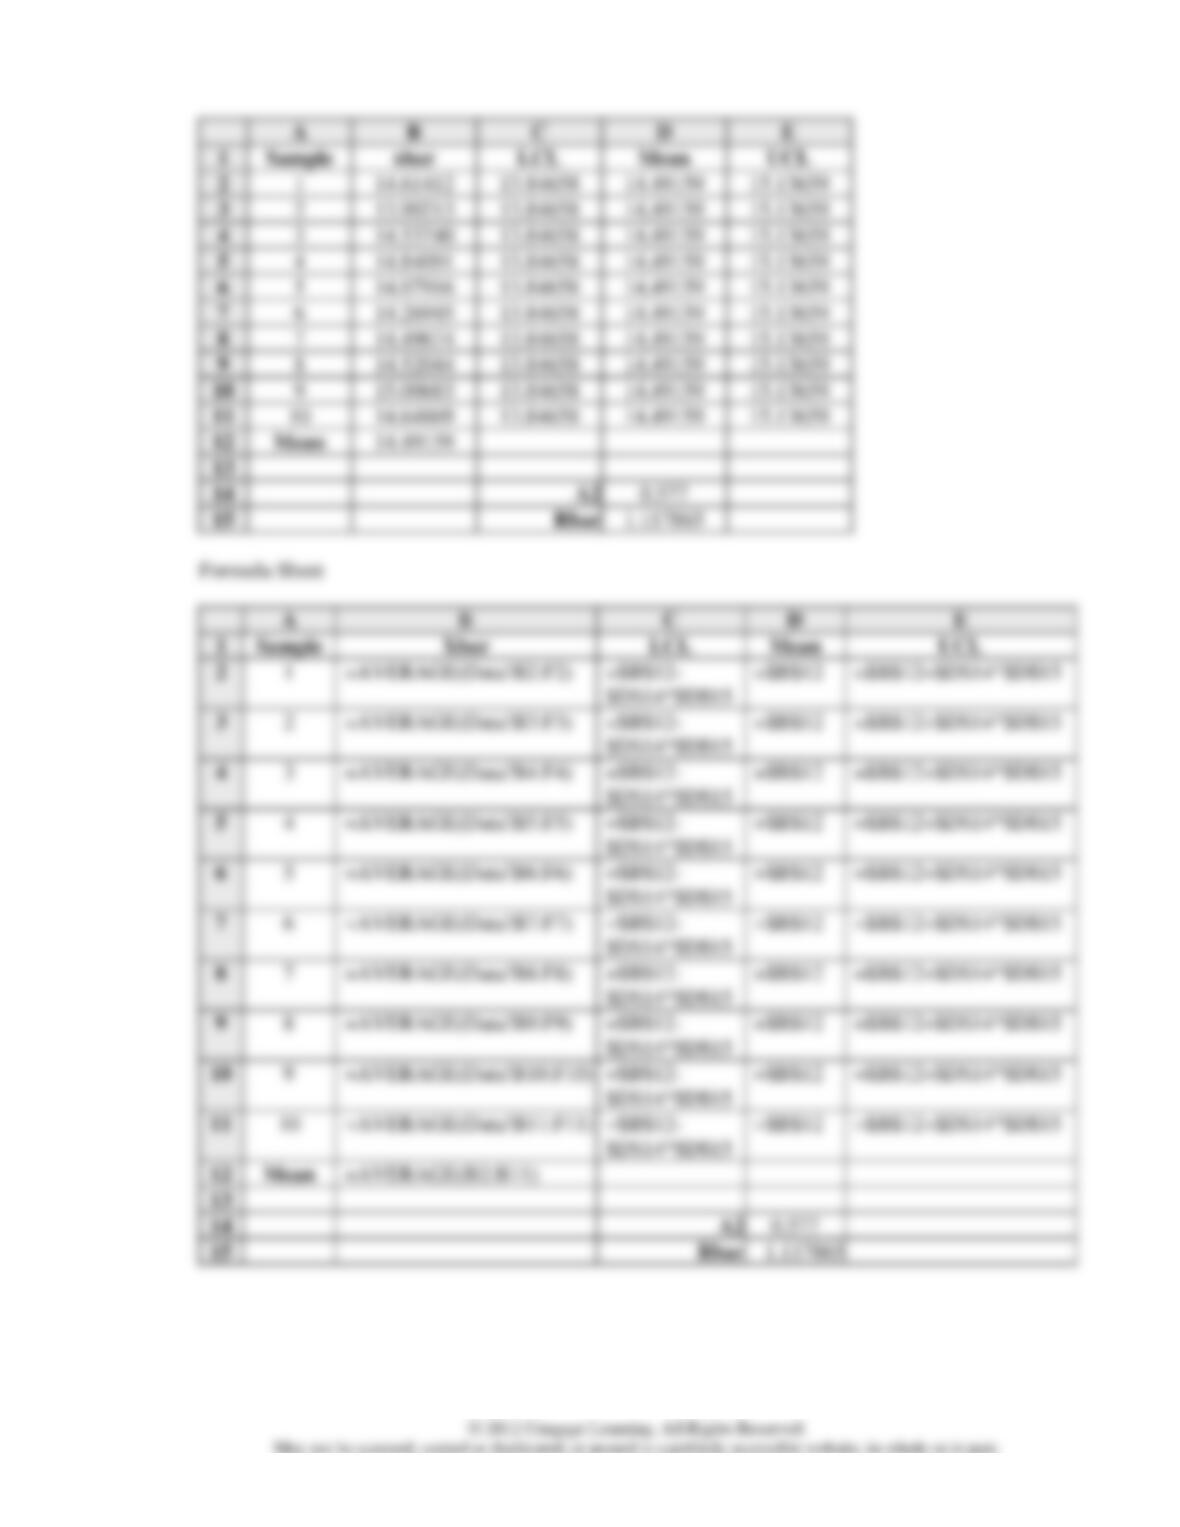
tomatoes. Ten samples of size 5 were taken. Use Excel to develop an R chart.
Sample
Observ. 1
Observ. 2
Observ. 3
Observ. 4
Observ. 5
1
14.34988
13.86116
14.62213
15.13824
15.09918
2
14.15490
13.65478
13.57654
14.01119
14.11325
3
14.33650
14.31488
15.17132
14.45736
14.40692
4
15.33073
13.69380
14.76947
14.95110
15.45946
5
13.77791
14.07638
13.73921
14.31856
14.48376
6
13.21121
15.22384
13.86012
14.17321
14.87886
7
14.84700
14.66132
14.03008
14.37953
14.56577
8
14.53612
14.91492
14.93100
14.18173
14.03840
9
15.60284
15.22188
15.15195
14.55648
14.50098
10
14.72211
14.80895
14.60674
13.98653
15.11910
5. The following data represent the filling weights based on samples of 14.5 ounce cans of whole peeled
tomatoes. Ten samples of size 5 were taken. Use Excel to develop an x-bar chart.
Sample
Observ. 1
Observ. 2
Observ. 3
Observ. 4
Observ. 5
1
14.34988
13.86116
14.62213
15.13824
15.09918
2
14.15490
13.65478
13.57654
14.01119
14.11325
3
14.33650
14.31488
15.17132
14.45736
14.40692
4
15.33073
13.69380
14.76947
14.95110
15.45946
5
13.77791
14.07638
13.73921
14.31856
14.48376
6
13.21121
15.22384
13.86012
14.17321
14.87886
7
14.84700
14.66132
14.03008
14.37953
14.56577
8
14.53612
14.91492
14.93100
14.18173
14.03840
9
15.60284
15.22188
15.15195
14.55648
14.50098
10
14.72211
14.80895
14.60674
13.98653
15.11910