
After the presidential debates, a random sample of 1200 voters showed that 540 favored the
Democratic candidate; 480 were in favor of the Republican candidate; 40 were in favor of the
Independent candidate, and 140 were undecided. We want to see if the proportion of voters has
changed.
a.
Compute the test statistic.
b.
Use the p-value approach to test the hypotheses. Let = .05.
c.
Using the critical value approach, test the hypotheses. Let = .05.
b.
c.
critical value is 7.815; reject Ho; there has been a change.
22. Last school year, in the school of Business Administration, 30% were Accounting majors, 24%
Management majors, 26% Marketing majors, and 20% Economics majors. A sample of 300 students
taken from this year’s students of the school showed the following number of students in each major:
Major
Students
Accounting
83
Management
68
Marketing
85
Economics
64
Total
300
We want to see if there has been a significant change in the number of students in each major.
a.
Compute the test statistic.
b.
Has there been any significant change in the number of students in each major between the last
school year and this school year. Use the p-value approach and let = .05.
7.815)
23. The personnel department of a large corporation reported sixty resignations during the last year. The
following table groups these resignations according to the season in which they occurred.
Number of
Season
Resignations
Winter
10
Spring
22
Summer
19
Fall
9
Test to see if the number of resignations is uniform over the four seasons.
Let = 0.05.
24. In 2009, forty percent of the students at a major university were Business majors, 35% were
Engineering majors and the rest of the students were majoring in other fields. In a sample of 600
students from the same university taken in 2010, two hundred were Business majors, 220 were
Engineering majors and the remaining students in the sample were majoring in other fields. At 95%
confidence, test to see whether there has been a significant change in the proportions between 2009
and 2010.
25. In the last presidential election before the candidates began their major campaigns, the percentages of
registered voters who favored the various candidates were as follows.
Percentage
Republicans
34
Democrats
43
Independents
23
After the major campaigns began, a random sample of 400 voters showed that 172 favored the
Republican candidate; 164 were in favor of the Democratic candidate; and 64 favored the Independent
candidate. Test with = .01 to see if the proportion of voters who favored the various candidates
changed.
26. Before the rush began for Christmas shopping, a department store had noted that the percentage of its
customers who use the store’s credit card, the percentage of those who use a major credit card, and the
percentage of those who pay cash are the same. During the Christmas rush in a sample of 150
shoppers, 46 used the store’s credit card; 43 used a major credit card; and 61 paid cash. With = 0.05,
test to see if the methods of payment have changed during the Christmas rush.
27. A major automobile manufacturer claimed that the frequencies of repairs on all five models of its cars
are the same. A sample of 200 repair services showed the following frequencies on the various makes
of cars.
Model of Car
Frequency
A
32
B
45
C
43
D
34
E
46
At = 0.05, test the manufacturer’s claim.
28. A lottery is conducted that involves the random selection of numbers from 0 to 4. To make sure that
the lottery is fair, a sample of 250 was taken. The following results were obtained.
Value
Frequency
0
40
1
45
2
55
3
60
4
50
a.
State the null and alternative hypotheses to be tested.
b.
Compute the test statistic.
c.
The null hypothesis is to be tested at the 5% level of significance. Determine the critical
value from the table.
d.
What do you conclude about the fairness of this lottery?
b.
5
c.
9.488
Do not reject the null hypothesis; it is fair. (p-value = 0.2872)
29. The makers of Compute-All know that in the past, 40% of their sales were from people under 30 years
old, 45% of their sales were from people who are between 30 and 50 years old, and 15% of their sales
were from people who are over 50 years old. A sample of 300 customers was taken to see if the market
shares had changed. In the sample, 100 of the people were under 30 years old, 150 people were
between 30 and 50 years old, and 50 people were over 50 years old.
a.
State the null and alternative hypotheses to be tested.
b.
Compute the test statistic.
c.
The null hypothesis is to be tested at the 1% level of significance. Determine the critical value
from the table.
d.
What do you conclude?
b.
5.56
c.
9.210
Do not reject the null hypothesis (p-value = 0.062); market share hasn’t changed.
30. The following table shows the results of a recent study regarding the gender of individuals and their
selected field of study.
Field of Study
Male
Female
Total
Medicine
80
40
120
Business
60
20
80
Engineering
160
40
200
Total
300
100
400
We want to determine if the selected field of study is independent of gender.
a.
Compute the test statistic.
b.
Using the p-value approach at 90% confidence, test to see if the field of study is independent of
gender.
c.
Using the critical method approach at 90% confidence, test for the independence of major and
gender.
b.
31. Shown below is 3 x 2 contingency table with observed values from a sample of 1,500. At 95%
confidence, test for independence of the row and column factors.
Column Factor
Row Factor
X
Y
Total
A
450
300
750
B
300
300
600
C
100
50
150
Total
850
650
1,500
32. Shown below is 2 x 3 contingency table with observed values from a sample of 500. At 95%
confidence using the critical value approach, test for independence of the row and column factors.
Column Factor
Row Factor
X
Y
Z
A
40
50
110
B
60
100
140
33. A sample of 150 individuals (males and females) was surveyed, and the individuals were asked to
indicate their yearly incomes. Their incomes were categorized as follows.
Category 1
$20,000 up to $40,000
Category 2
$40,000 up to $60,000
Category 3
$60,000 up to $80,000
The results of the survey are shown below.
Income Category
Male
Female
Category 1
10
30
Category 2
35
15
Category 3
15
45
We want to determine if yearly income is independent of gender.
a.
Compute the test statistic.
b.
Using the p-value approach, test to determine if yearly income is independent of gender.
34. A group of 2000 individuals from 3 different cities were asked whether they owned a foreign or a
domestic car. The following contingency table shows the results of the survey.
City
Type of Car
Detroit
Atlanta
Denver
Total
Domestic
80
200
520
800
Foreign
120
600
480
1200
Total
200
800
1000
2000
At = 0.05 using the p-value approach, test to determine if the type of car purchased is independent of
the city in which the purchasers live.
35. Dr. Sherri Brock’s diet pills are supposed to cause significant weight loss. The following table shows
the results of a recent study where some individuals took the diet pills and some did not.
Diet Pills
No Diet Pills
Total
No Weight Loss
80
20
100
Weight Loss
100
100
200
Total
180
120
300
We want to see if losing weight is independent of taking the diet pills.
a.
Compute the test statistic.
b.
Using the p-value approach at 95% confidence, test to determine if weight loss is independent
on taking the pill.
c.
Use the critical method approach and test for independence.
a.
pills
c.
critical = 3.481; reject Ho; not independent
36. Five hundred randomly selected automobile owners were questioned on the main reason they had
purchased their current automobile. The results are given below.
Styling
Engineering
Fuel Economy
Total
Male
70
130
150
350
Female
30
20
100
150
100
150
250
500
a.
State the null and alternative hypotheses for a contingency table test.
b.
State the decision rule for the critical value approach. Let = 0.10.
c.
Calculate the test statistic.
d.
Give your conclusion for this test.
31.746
d.
Reject the null hypothesis; auto preference is not independent of sex.
37. A group of 500 individuals were asked to cast their votes regarding a particular issue of the Equal
Rights Amendment. The following contingency table shows the results of the votes:
Sex
Favor
Undecided
Oppose
Total
Female
180
80
40
300
Male
150
20
30
200
Total
330
100
70
500
At = .05 using the p-value approach, test to determine if the votes cast were independent of the sex
of the individuals.
38. Two hundred fifty managers with degrees in business administration indicated their fields of
concentration as shown below.
Major
Top Management
Middle Management
Total
Management
65
60
125
Marketing
30
20
50
Accounting
25
50
75
Total
120
130
250
At = .01 using the p-value approach, test to determine if the position in management is independent
of the major of concentration.
39. From a poll of 800 television viewers, the following data have been accumulated as to their levels of
education and their preference of television stations.
Level of Education
High School
Bachelor
Graduate
Total
Public Broadcasting
110
190
100
400
Commercial Stations
80
220
100
400
Total
190
410
200
800
Test at = .05 to determine if the selection of a TV station is dependent upon the level of education.
Use the p-value approach.
40. The data below represents the fields of specialization for a randomly selected sample of undergraduate
students. We want to determine whether there is a significant difference in the fields of specialization
between regions of the country.
Northeast
Midwest
South
West
Total
Business
54
65
28
93
240
Engineering
15
24
8
33
80
Liberal Arts
65
84
33
98
280
Fine Arts
13
15
7
25
60
Health Sciences
3
12
4
21
40
150
200
80
270
700
a.
Determine the critical value of the chi-square ( ) for this test of independence.
b.
Calculate the value of the test statistic.
c.
What is the conclusion for this test? Let = .05.
21.026
b.
8.674
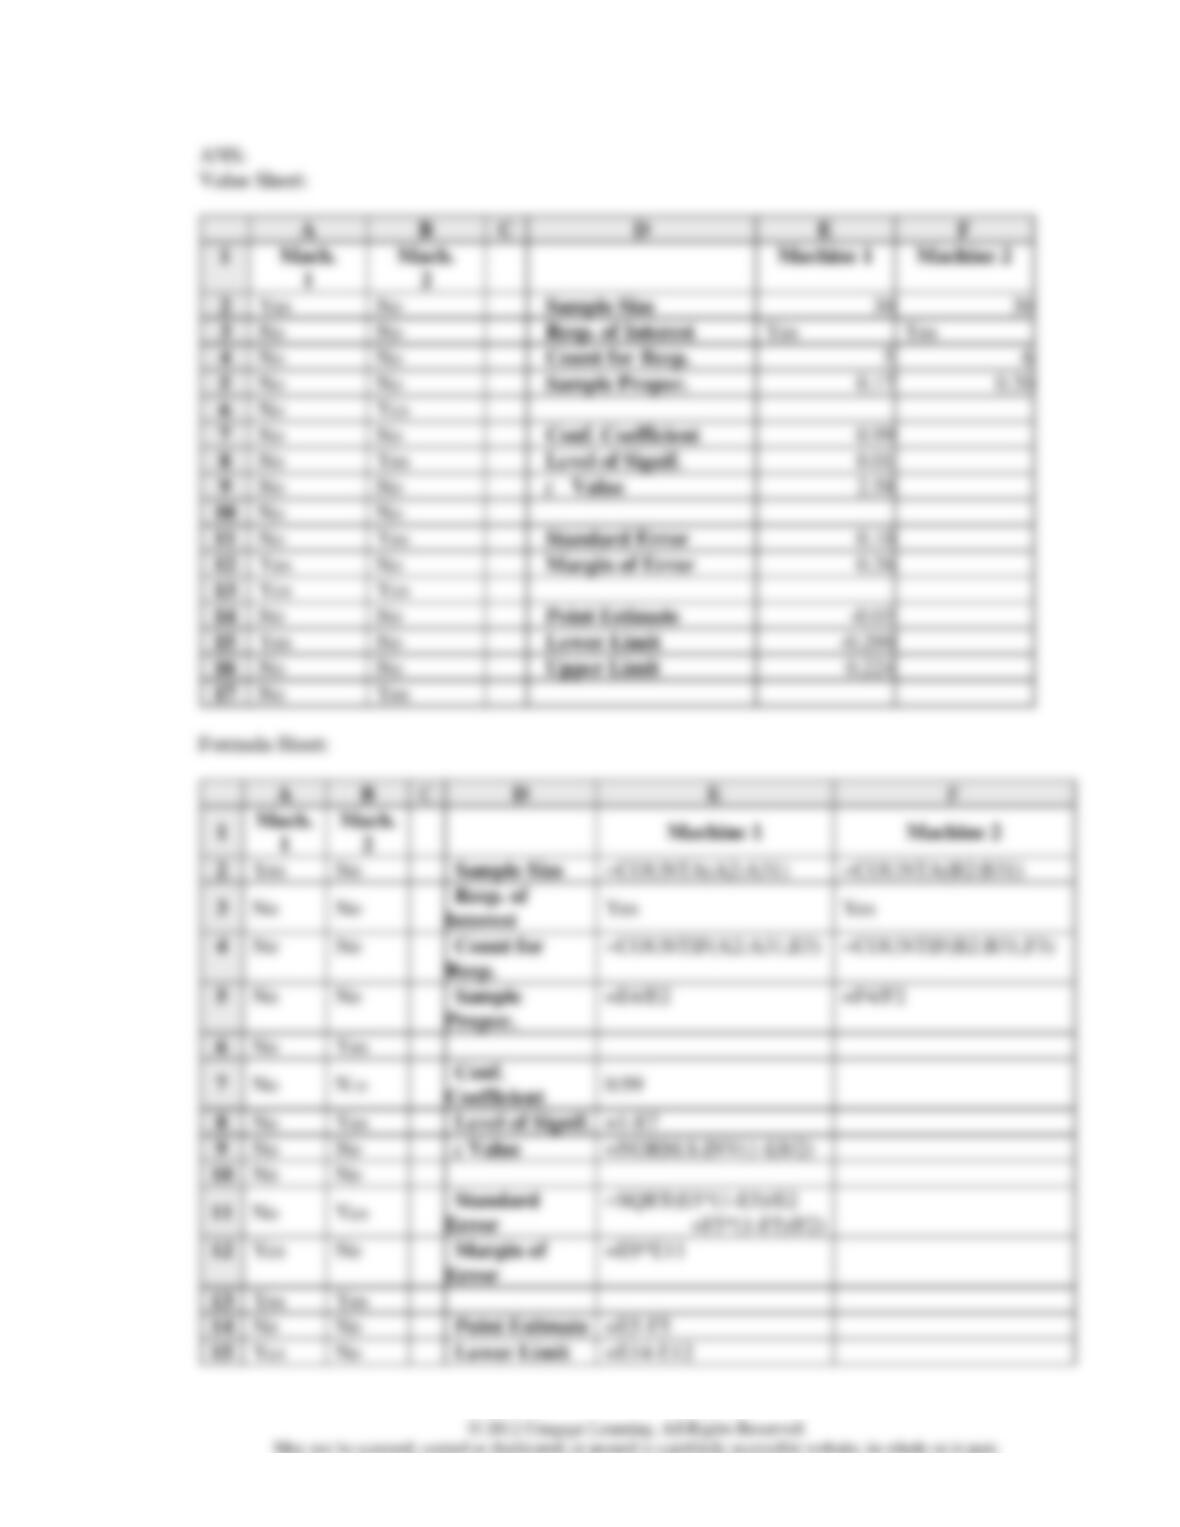
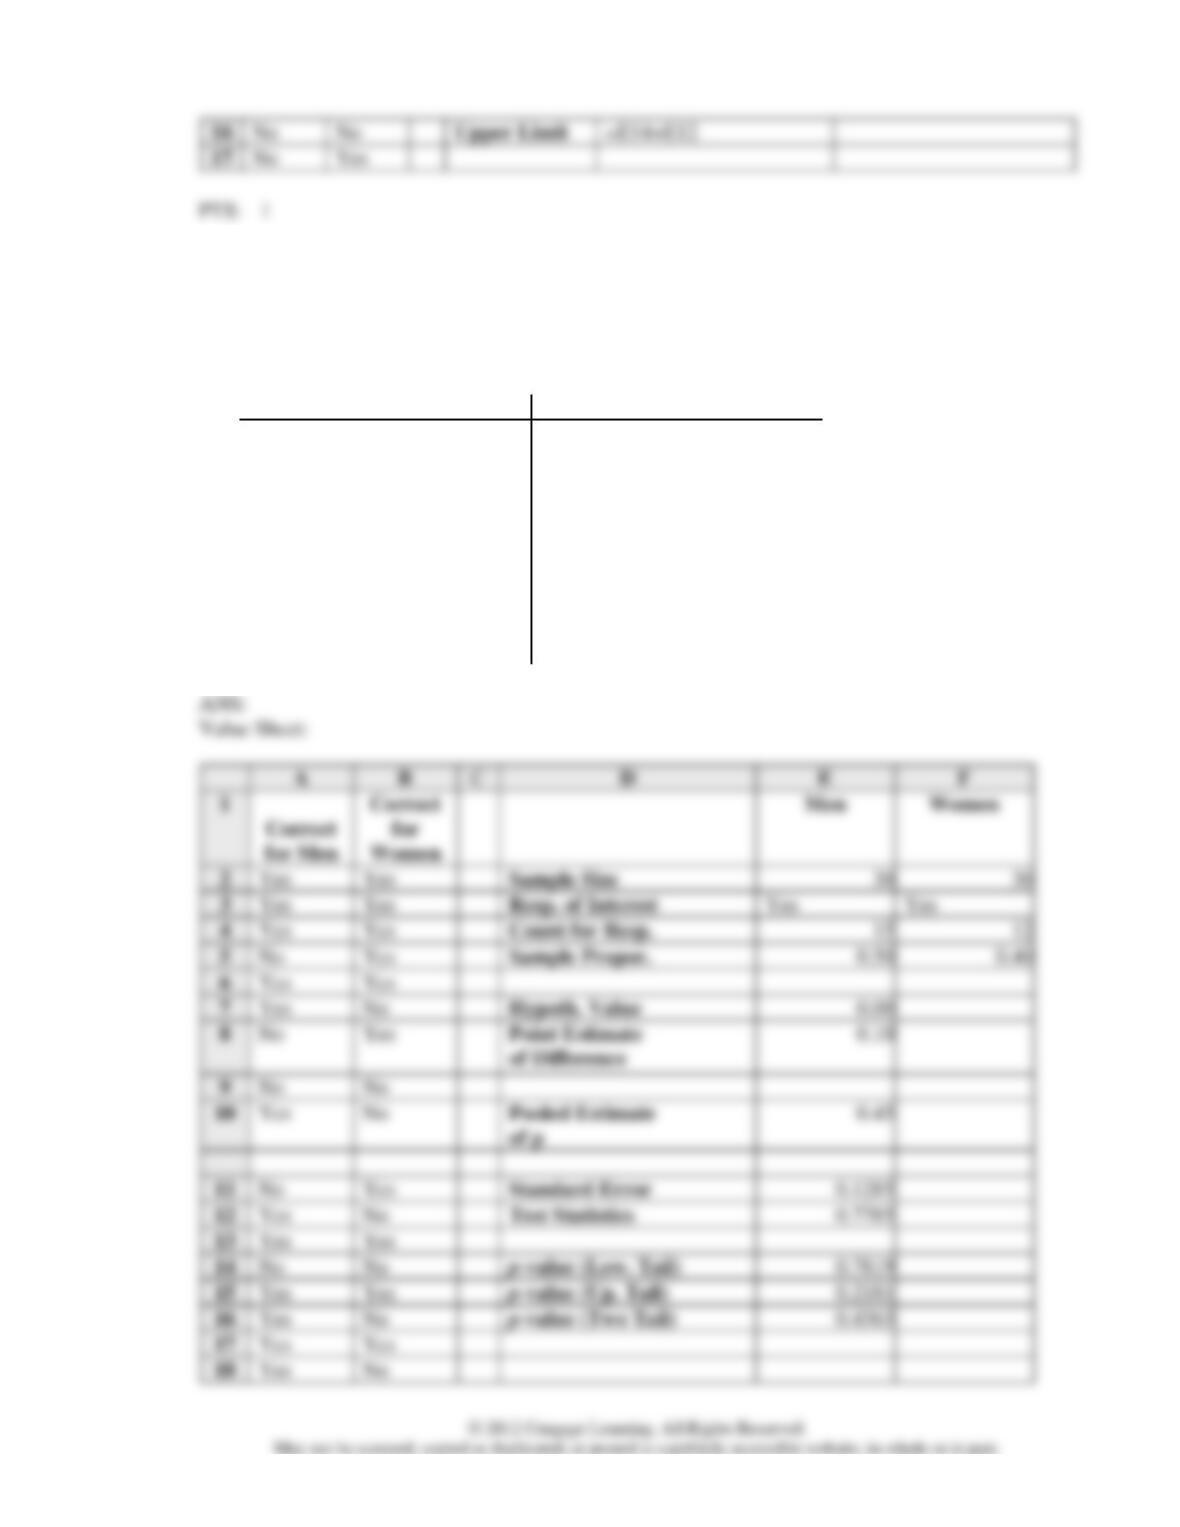
41. A manufacturing company wants to estimate the difference in the proportion of defective parts
between two machines. Independent random samples of parts are taken from both machines. The
results follow. Use Excel to estimate the difference in the proportion of defective parts between two
machines with a 99% level of confidence.
Machine 1
Machine 2
Yes
Yes
No
No
No
No
No
Yes
No
No
Yes
No
No
No
No
No
No
No
No
Yes
No
No
No
No
No
No
No
Yes
No
No
No
No
No
No
Yes
No
No
No
No
Yes
No
No
No
Yes
No
No
No
No
No
No
No
No
Yes
No
No
No
No
Yes
No
No
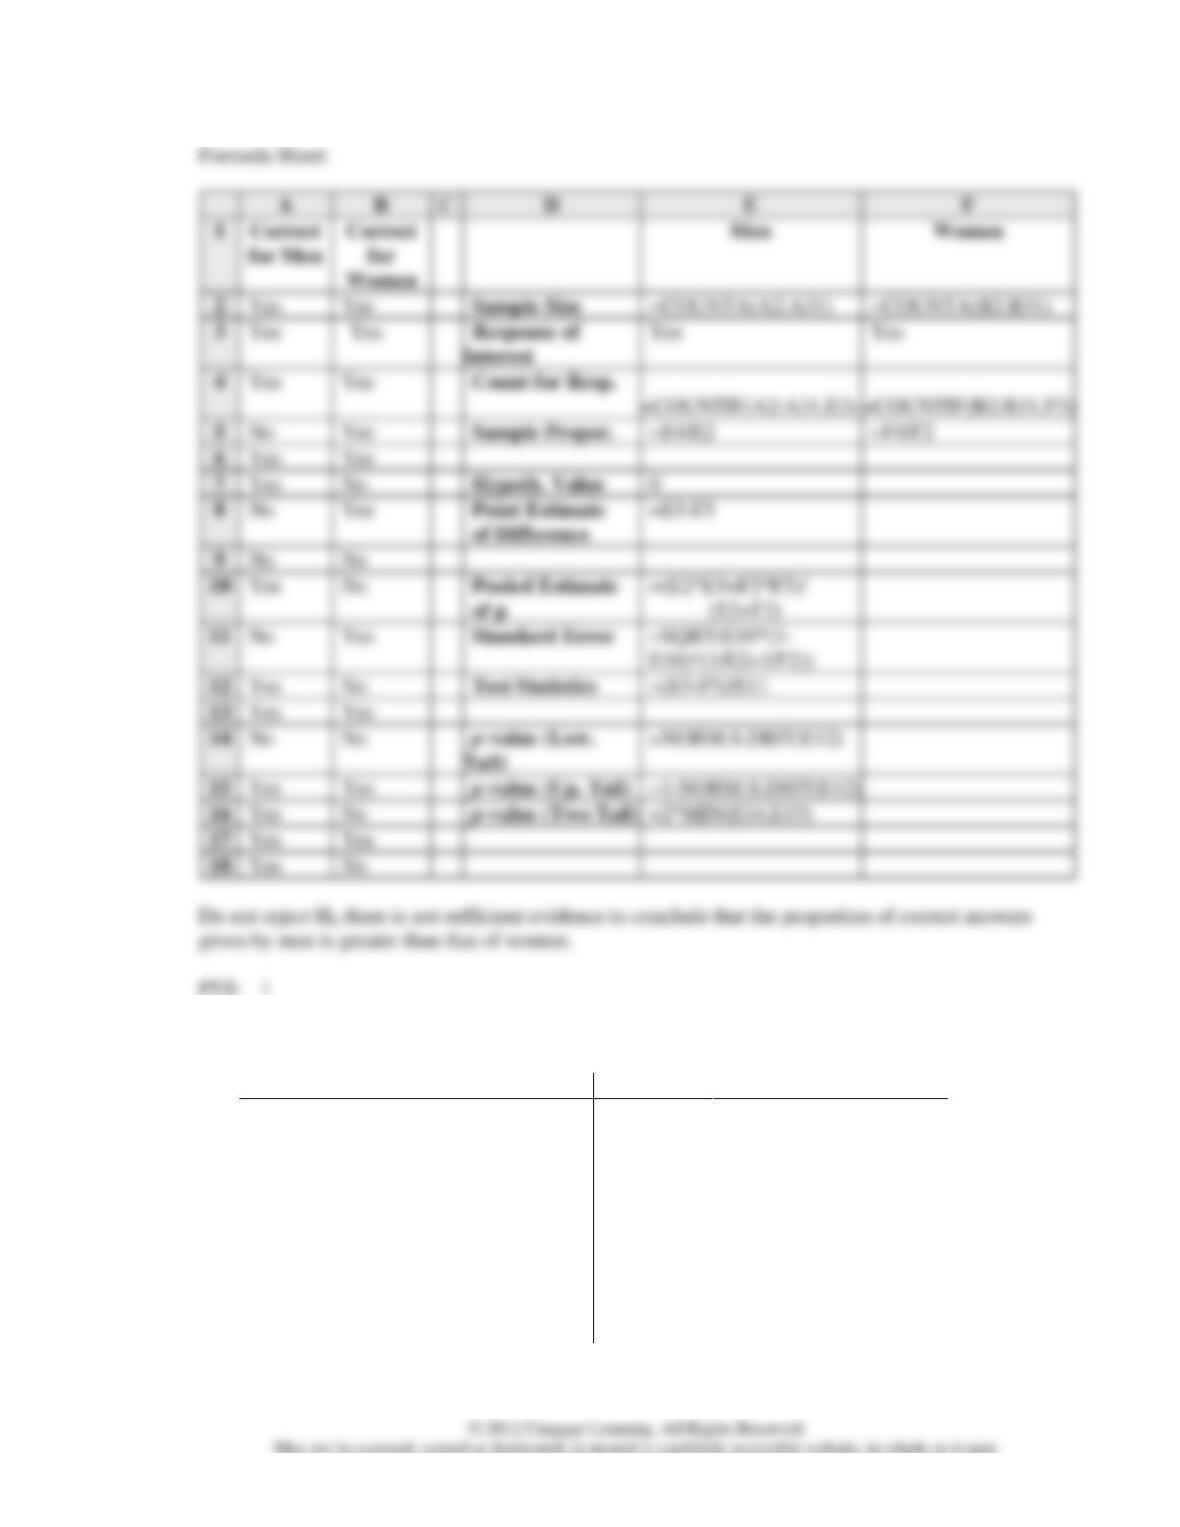
42. A company gives a test to prospective employees before granting an interview. A researcher
hypothesizes that men tend to answer one particular test question correctly more often than women.
Independent samples of both groups are given the test. The results for the question of interest follow.
Does the data provide sufficient evidence to conclude that the proportion of correct answers given by
men is greater than that of women? Use Excel to conduct the appropriate test at = .05.
Men
Women
Yes
Yes
Yes
Yes
No
No
Yes
Yes
No
Yes
Yes
No
Yes
No
No
Yes
No
No
No
Yes
No
Yes
Yes
No
Yes
Yes
No
Yes
No
No
Yes
Yes
No
No
Yes
No
No
Yes
No
Yes
No
No
No
Yes
No
No
No
No
Yes
No
No
No
Yes
No
No
Yes
No
Yes
Yes
No
Yes
Yes
Yes
Yes
Yes
Yes
Yes
Yes
Yes
Yes
Yes
Yes
Yes
Yes
Yes
Yes
Yes
Yes
Yes
Yes
=E14+E12
Yes
Yes
Yes
=COUNTA(A2:A31)
=COUNTA(B2:B31)
Yes
=E4/E2
=F4/F2
Yes
Yes
Yes
0
Yes
=(E5-F5)/E11
Yes
Yes
Yes
Yes
Yes
=2*MIN(E14,E15)
Yes
Yes
Yes
43. The results of recent polls on presidential approval ratings are shown below.
Approved of President in January
Approved of President in July
Yes
Yes
Yes
Yes
No
No
No
Yes
No
Yes
Yes
No
No
No
No
Yes
No
No
No
Yes
No
Yes
Yes
No
No
Yes
No
Yes
No
No
Yes
Yes
No
No
Yes
No
Yes
Yes
No
Yes
No
No
No
Yes
No
No
No
No
No
No
No
No
Yes
No
Yes
Yes
No
Yes
Yes
No
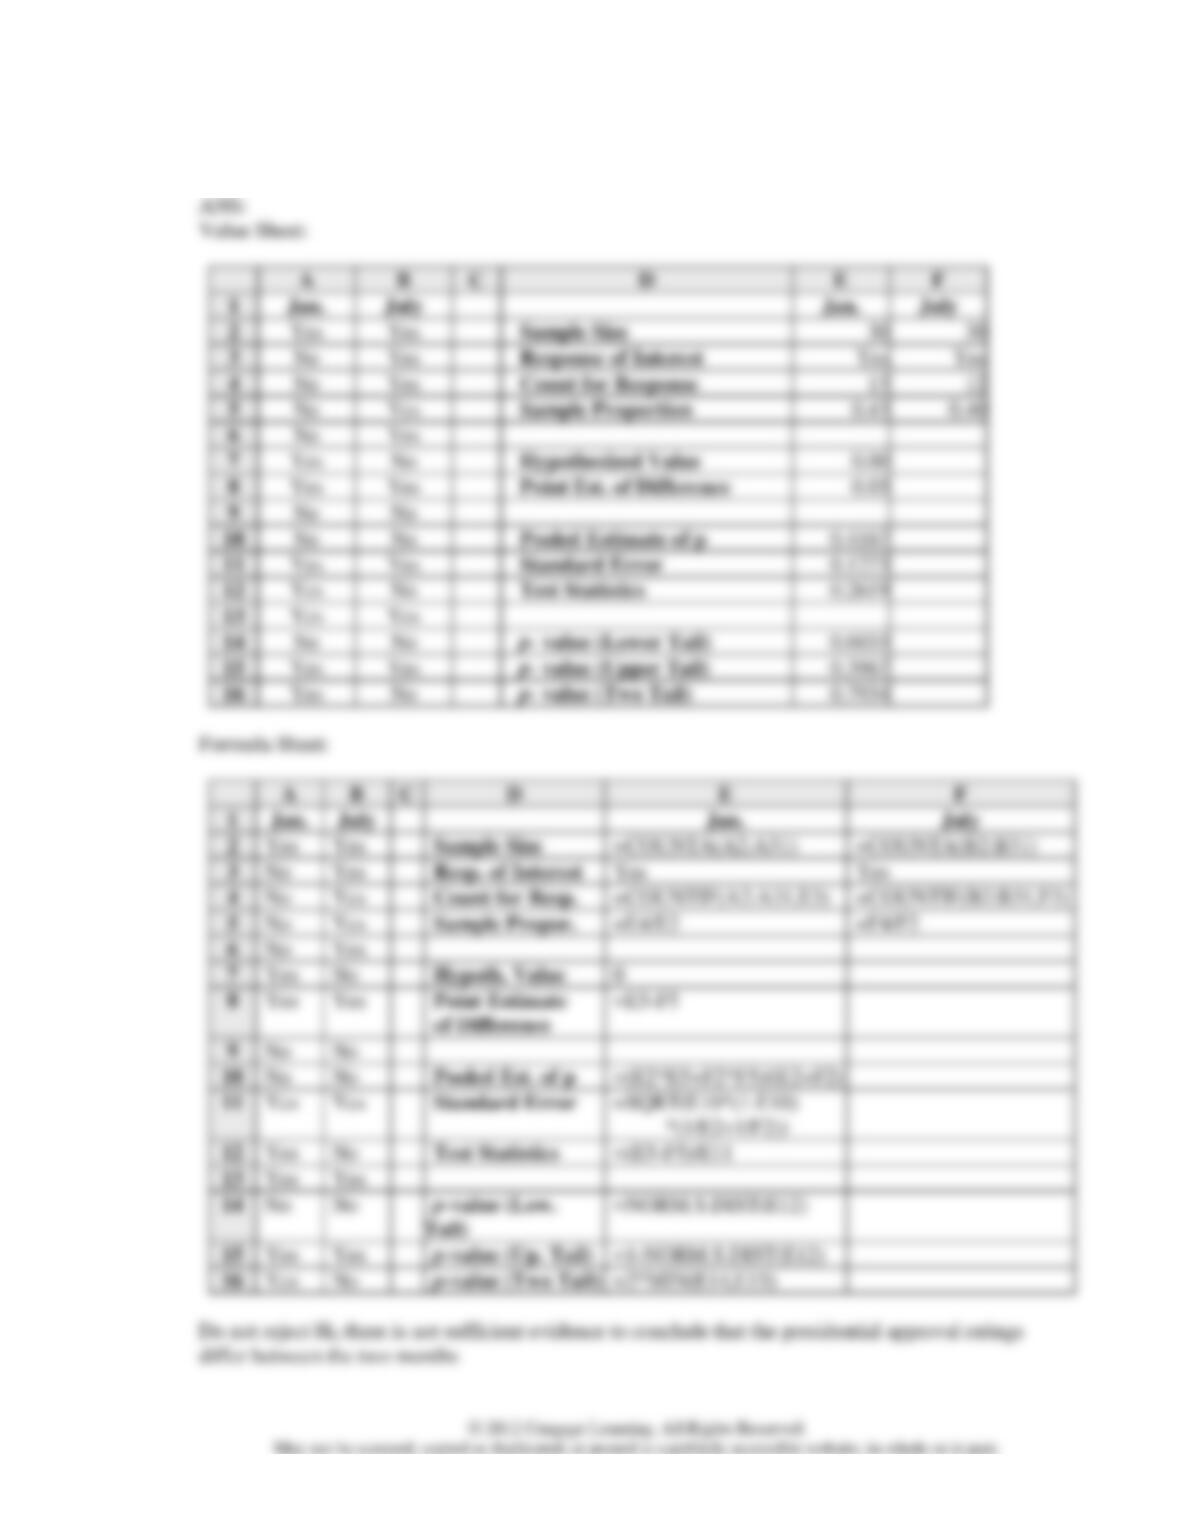
Does the data provide sufficient evidence to conclude that the presidential approval ratings differ
between the two months? Use Excel to conduct the appropriate test at = .05.
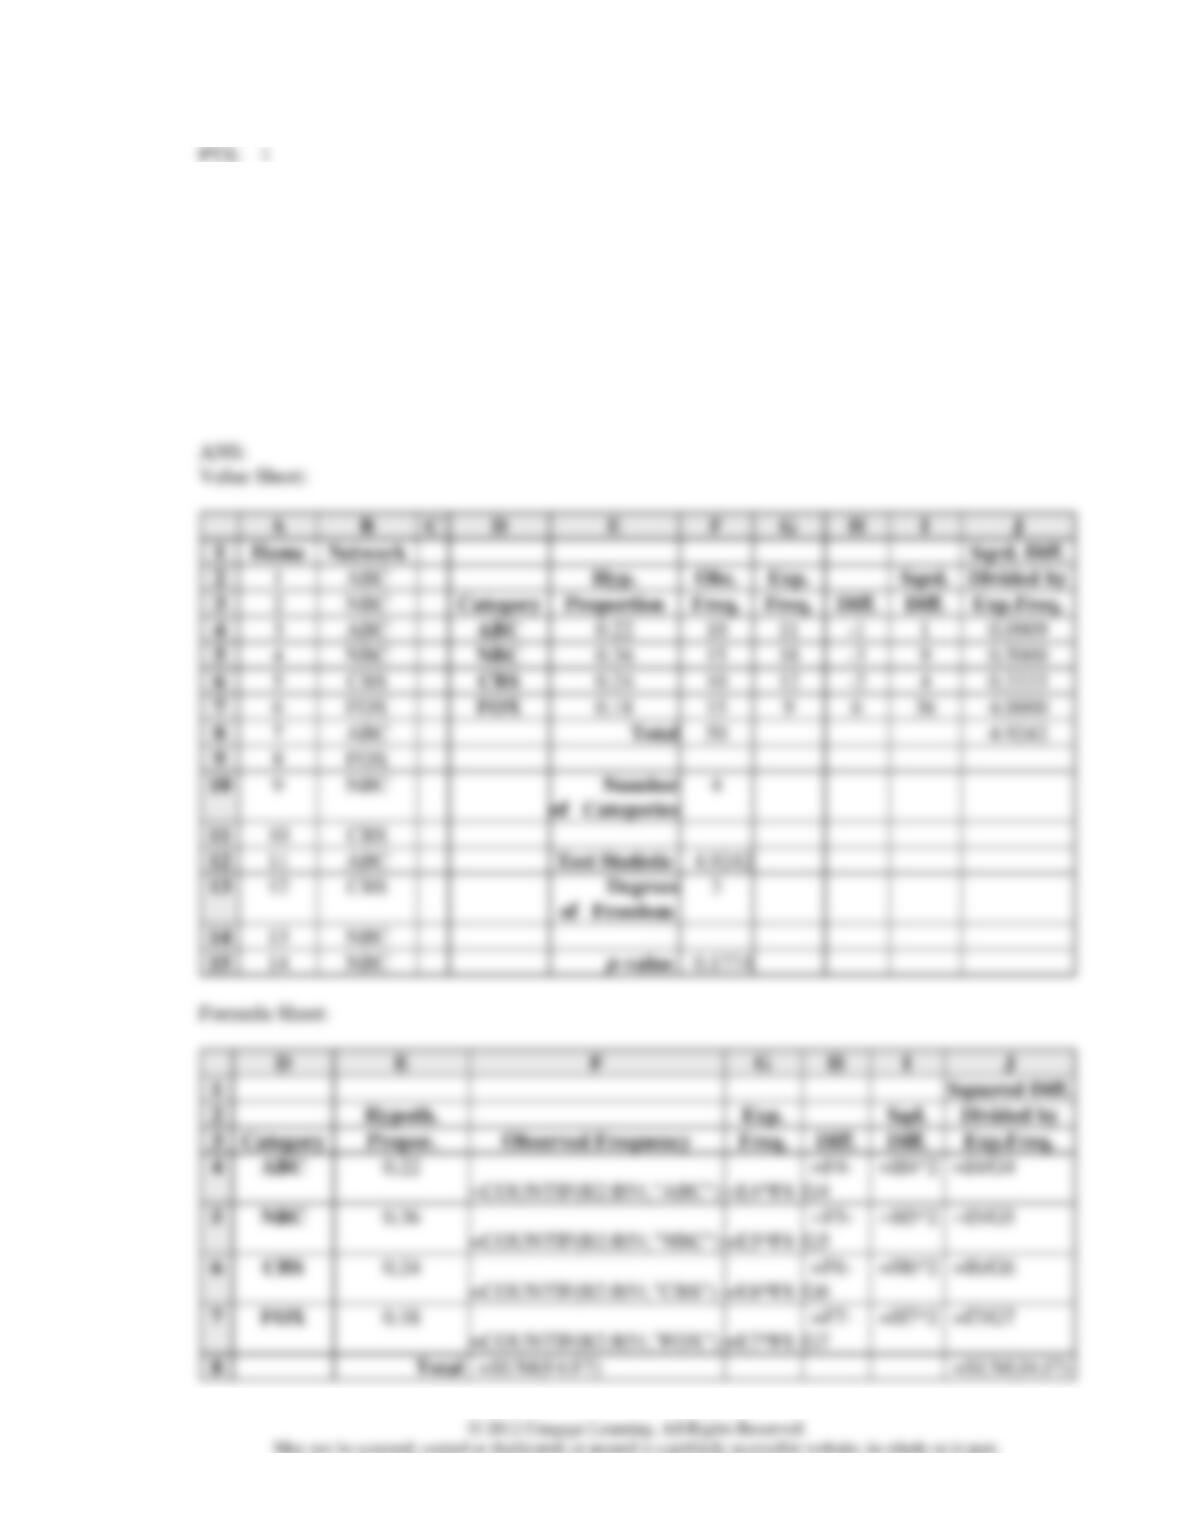
44. During “sweeps week” last year, the viewing audience was distributed as follows: 36% NBC, 22%
ABC, 24% CBS, and 18% FOX. This year during “sweeps week” a sample of 50 homes yielded the
following data. Use Excel to test at = .05 to determine if the audience proportions have changed.
ABC
FOX
ABC
FOX
ABC
ABC
CBS
NBC
FOX
FOX
NBC
ABC
CBS
ABC
NBC
NBC
NBC
CBS
FOX
ABC
ABC
FOX
NBC
CBS
CBS
NBC
NBC
ABC
FOX
FOX
NBC
NBC
NBC
NBC
FOX
ABC
FOX
NBC
FOX
CBS
CBS
CBS
FOX
FOX
NBC
CBS
FOX
CBS
FOX
NBC
=COUNTIF(B2:B51,”ABC”)
=E4*F8
G4
=COUNTIF(B2:B51,”NBC”)
=E5*F8
G5
=COUNTIF(B2:B51,”CBS”)
=E6*F8
G6
=SUM(F4:F7)
=SUM(J4:J7)
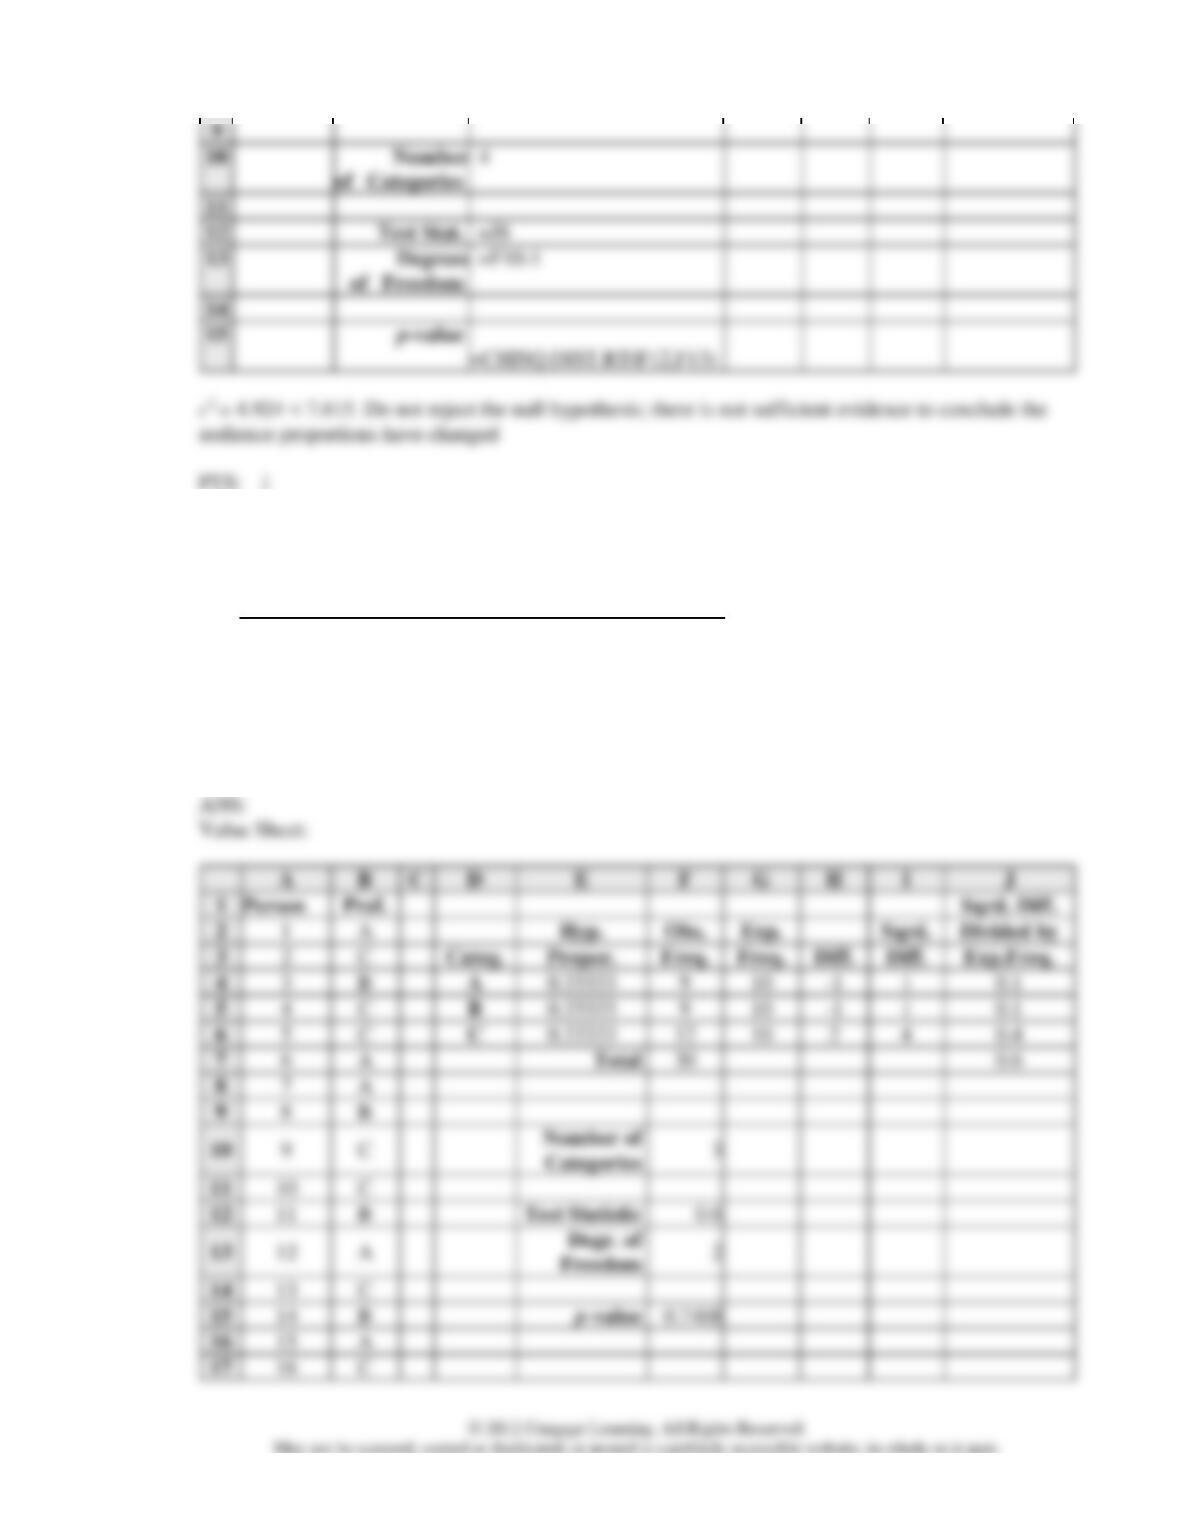
=J8
=CHISQ.DIST.RT(F12,F13)
45. Members of a focus group stated their preferences between three possible slogans. The results follow.
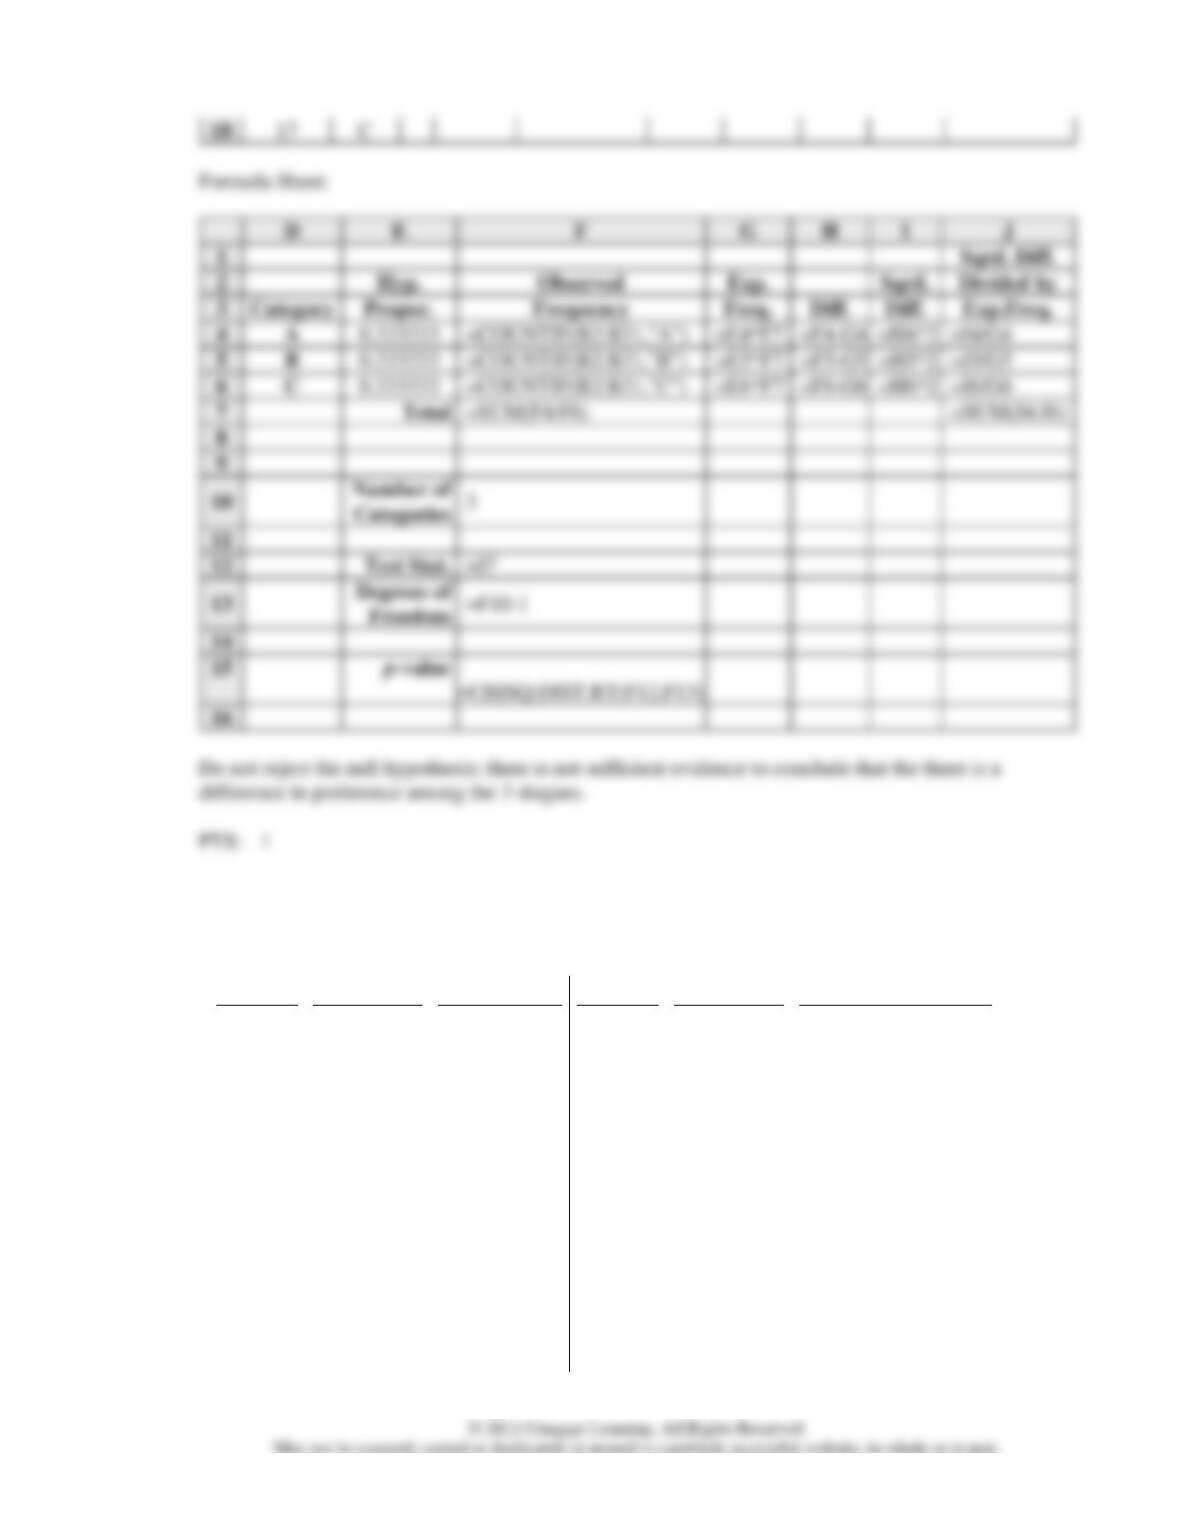
Use Excel to test at = .05 to determine any difference in preference among the three slogans.
Slogan Preferences
A
A
C
C
B
C
B
B
A
A
B
C
A
B
C
C
C
C
B
B
C
B
C
C
A
A
A
C
A
B
46. A study of wage discrimination at a local store compared employees’ race and their status. Partial
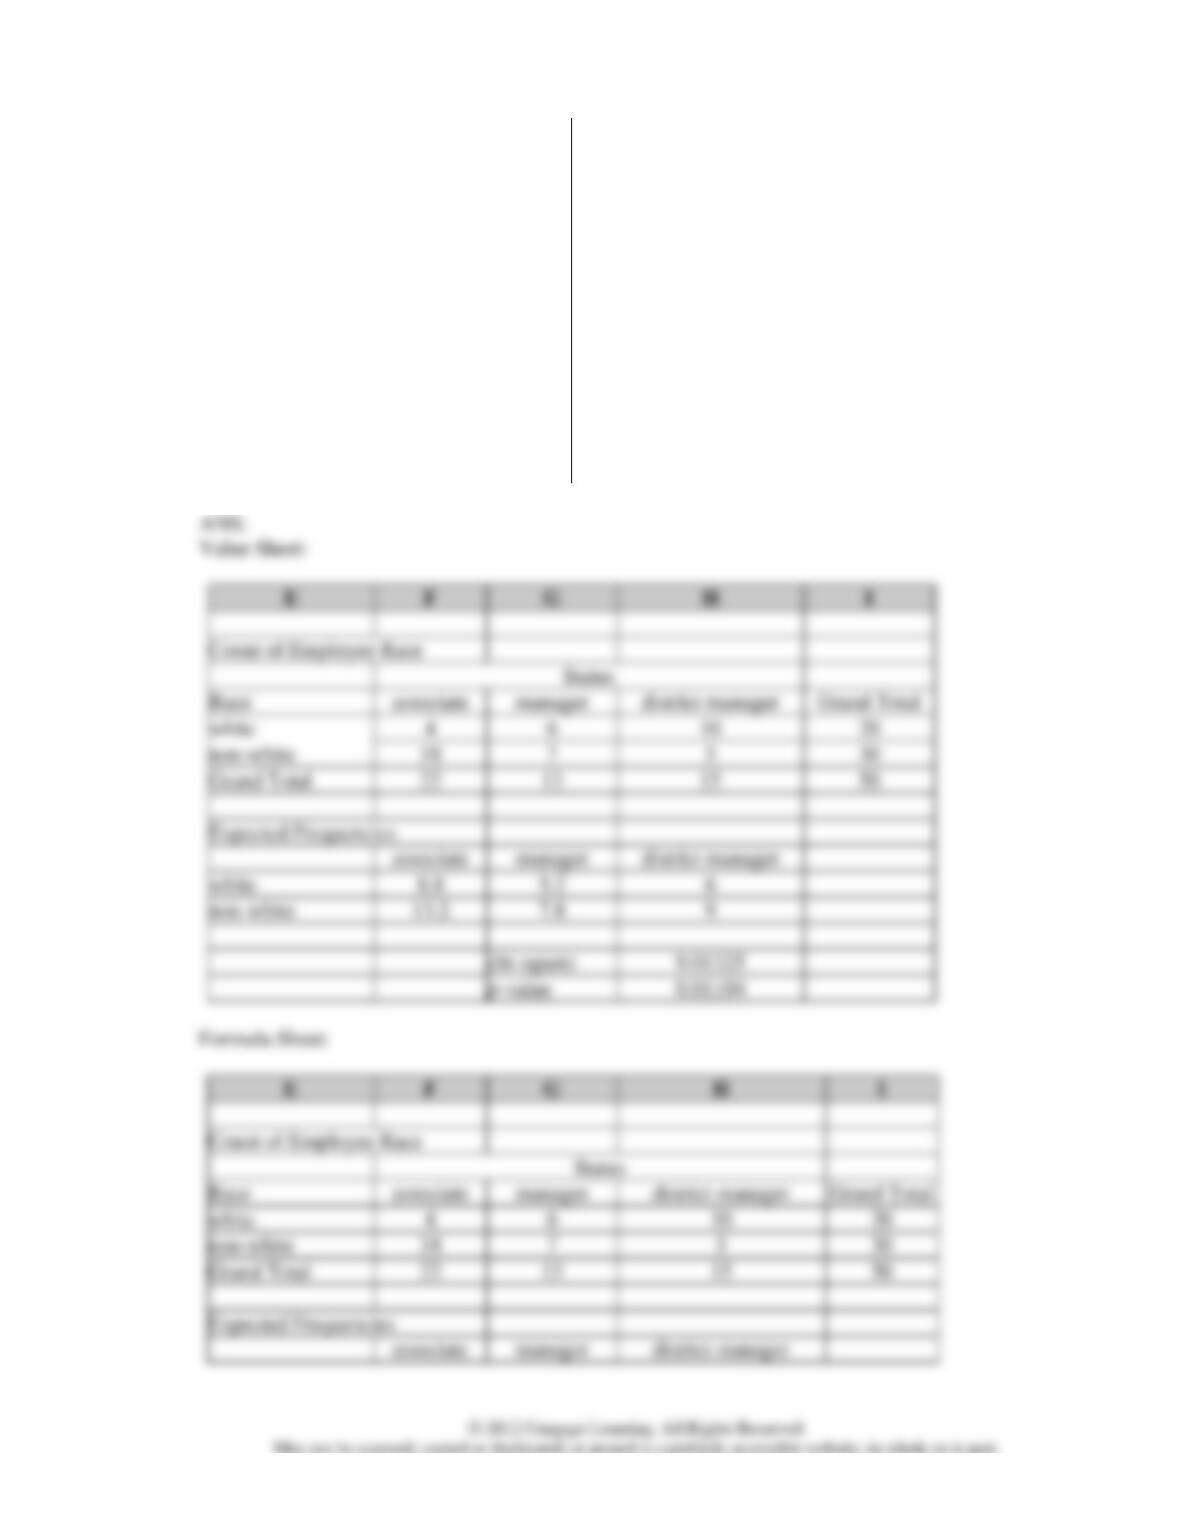
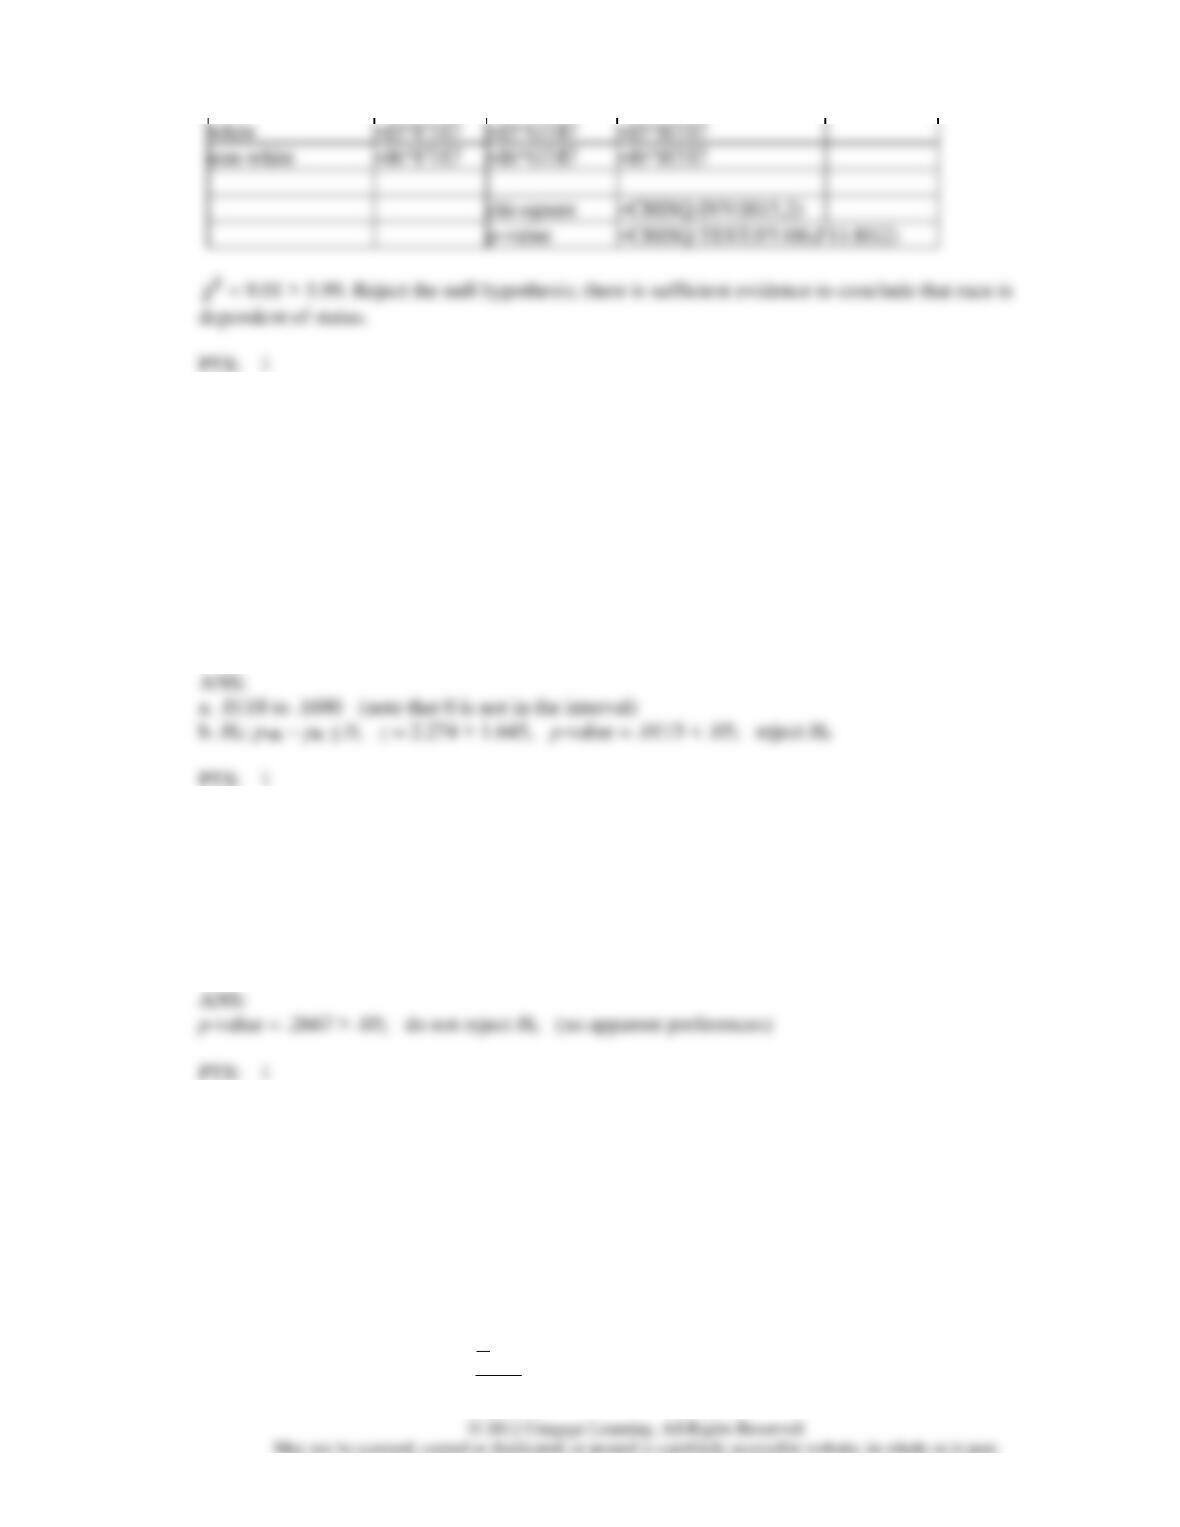
results of the study follow. Use Excel and test at = .05 to determine if gender is independent of
status.
Worker
Race
Status
Worker
Race
Status
1
white
manager
26
non-white
associate
2
non-white
associate
27
white
district manager
3
white
district
manager
28
non-white
manager
4
white
manager
29
white
associate
5
white
manager
30
non-white
district manager
6
non-white
associate
31
non-white
district manager
7
non-white
associate
32
white
district manager
8
white
associate
33
white
district manager
9
non-white
associate
34
non-white
associate
10
white
manager
35
white
district manager
11
non-white
manager
36
non-white
associate
12
non-white
associate
37
non-white
manager
13
white
associate
38
non-white
associate
14
non-white
associate
39
white
district manager
15
white
district
manager
40
non-white
associate
16
white
district
manager
41
non-white
manager
17
non-white
associate
42
non-white
district manager
18
non-white
associate
43
white
manager
19
white
associate
44
white
district manager
20
non-white
manager
45
non-white
associate
21
white
district
manager
46
non-white
associate
22
non-white
district
manager
47
non-white
district manager
23
non-white
manager
48
white
manager
24
non-white
associate
49
non-white
manager
25
non-white
associate
50
non-white
associate
13.2
47. A movie based on a best-selling novel was recently released. Six hundred viewers of the movie, 235
of whom had previously read the novel, were asked to rate the quality of the movie. The survey
showed that 141 of the novel readers gave the movie a rating of excellent, while 248 of the non-readers
gave the movie an excellent rating.
a. Develop an interval estimate of the difference between the proportions of the two populations, using
a .05 level of significance, as the basis for your decision.
b. Can we conclude, on the basis of a hypothesis test about p1 – p2, that the proportion of the non-
readers of the novel who thought the movie was excellent is greater than the proportion of readers
of the novel who thought the movie was excellent? Use a .05 level of significance. (Hint: this is
a one-tailed test.)
48. Employee panel preferences for three proposed company logo designs follow.
Logo Design
A
B
C
Number of Employees Preferring Design
78
59
66
Use a = .05 and test to determine any difference in preference among the three logo designs.
49. City planners are evaluating three proposed alternatives for relieving the growing traffic congestion on
a north-south highway in a booming city. The proposed alternatives are: (1) designate high-
occupancy vehicle (HOV) lanes on the existing highway, (2) construct a new, parallel highway, and
(3) construct a light (passenger) rail system.
In an analysis of the three proposals, a citizen group has raised the question of whether preferences for
the three alternatives differ among residents near the highway and non-residents. A test of
independence will address this question, with the hypotheses being:
H0: Proposal preference is independent of the residency status of the individual
Ha: Proposal preference is not independent of the residency status of the individual

A simple random sample of 500 individuals has been selected. The crosstabulation of the residency
statuses and proposal preferences of the individuals sampled is shown below.
Residency Status
HOV Lane
New Highway
Light Rail
Nearby resident
110
45
70
Distant resident
140
75
60
Conduct a test of independence using
= .05 to address the question of whether residency status is
independent of the proposal preference.