CHAPTER 15—TIME SERIES ANALYSIS AND FORECASTNG
MULTIPLE CHOICE
1. Common types of data patterns that can be identified when examining a time series plot include all of
the following except
a.
horizontal
b.
vertical
c.
seasonal
d.
cyclical
2. Given an actual demand of 61, forecast of 58, and an of .3, what would the forecast for the next
period be using simple exponential smoothing?
a.
57.1
b.
58.9
c.
61.0
d.
65.5
3. Which of the following smoothing constants would make an exponential smoothing forecast
equivalent to a naive forecast?
a.
0
b.
1 divided by the number of periods
c.
0.5
d.
1.0
4. The time series pattern showing an alternating sequence of points below and above the trend line
lasting more than one year is the
a.
trend pattern
b.
seasonal pattern
c.
trend and seasonal pattern
d.
cyclical pattern
5. The time series pattern that reflects repeating variability within a single year is called the
a.
trend pattern
b.
seasonal pattern
c.
trend and seasonal pattern
d.
cyclical pattern
6. The time series pattern that exists when the data fluctuate around a constant mean is the
a.
horizontal pattern
b.
trend pattern
c.
seasonal pattern
d.
cyclical pattern
7. The time series pattern that reflects a gradual shift or movement to a relatively higher or lower level
over a longer time period is called the
a.
trend pattern
b.
seasonal pattern
c.
cyclical pattern
d.
trend and seasonal pattern
8. The trend pattern is easy to identify by using
a.
moving averages
b.
exponential smoothing
c.
regression analysis
d.
the Delphi approach
9. The forecasting method that is appropriate when the time series has no significant trend, cyclical, or
seasonal effect is
a.
moving averages
b.
mean squared error
c.
mean average deviation
d.
qualitative forecasting methods
10. If data for a time series analysis is collected on an annual basis only, which pattern can be ignored?
a.
trend
b.
seasonal
c.
cyclical
d.
horizontal
11. For the following time series, you are given the moving average forecast.
Time Period
Time Series Value
Moving Average Forecast
1
23
2
17
3
17
4
26
19
5
11
20
6
23
18
7
17
20
The mean squared error equals
a.
0
b.
6
c.
41

d.
164
12. If the estimate of the trend component is 158.2, the estimate of the seasonal component is 94%, the
estimate of the cyclical component is 105%, and the estimate of the irregular component is 98%, then
the multiplicative model will produce a forecast of
a.
1.53
b.
1.53%
c.
153.02
d.
153,020,532
13. Below you are given the first four values of a time series.
Time Period
Time Series Value
1
18
2
20
3
25
4
17
Using a 4-period moving average, the forecasted value for period 5 is
a.
2.5
b.
17
c.
20
d.
10
14. Below you are given the first two values of a time series. You are also given the first two values of the
exponential smoothing forecast.
Time Period (t)
Time Series Value (Y t)
Exponential Smoothing
Forecast (F t)
1
18
18
2
22
18
If the smoothing constant equals .3, then the exponential smoothing forecast for time period three is
a.
18
b.
19.2
c.
20
d.
40
15. The following linear trend expression was estimated using a time series with 17 time periods.
Tt = 129.2 + 3.8t
The trend projection for time period 18 is
a.
68.4
b.
193.8

c.
197.6
d.
6.84
16. You are given the following information on the seasonal-irregular component values for a quarterly
time series:
Quarter
Seasonal-Irregular
Component Values (StIt)
1
1.23, 1.15, 1.16
2
.86, .89, .83
3
.77, .72, .79
4
1.20, 1.13, 1.17
The seasonal index for Quarter 1 is
a.
.997
b.
1.18
c.
4
d.
3
17. Below you are given some values of a time series consisting of 26 time periods.
Time Period
Time Series Value
1
37
2
48
3
50
4
63
.
.
.
23
105
24
107
25
112
26
114
The estimated regression equation for these data is
Yt = 16.23 + .52Yt-1 + .37Yt-2
The forecasted value for time period 27 is
a.
53.23
b.
109.5
c.
116.65
d.
116.95
18. A group of observations measured at successive time intervals is known as
a.
a trend component
b.
a time series
c.
a forecast
d.
an additive time series model
19. A component of the time series model that results in the multi-period above-trend and below-trend
behavior of a time series is
a.
a trend component
b.
a cyclical component
c.
a seasonal component
d.
an irregular component
20. The model that assumes that the actual time series value is the product of its components is the
a.
linear trend regression model
b.
multiplicative decomposition model
c.
additive time series model
d.
weighted moving average model
21. A method of smoothing a time series that can be used to identify the combined trend/cyclical
component is
a.
the moving average
b.
the percent of trend
c.
exponential smoothing
d.
the trend/cyclical index
22. A method that uses a weighted average of past values for arriving at smoothed time series values is
known as
a.
regression analysis
b.
deseasonalization
c.
decomposition
d.
exponential smoothing
23. In the linear trend equation, Tt = b0 + b1t b1 represents the
a.
trend value in period t
b.
intercept of the trend line
c.
slope of the trend line
d.
point in time
24. In the linear trend equation, T = b0 + b1t, b0 represents the
a.
time
b.
slope of the trend line
c.
trend value in period 1
d.
the Y intercept
25. A parameter of the exponential smoothing model which provides the weight given to the most recent
time series value in the calculation of the forecast value is known as the
a.
mean square error
b.
mean absolute deviation
c.
smoothing constant
d.
None of these alternatives is correct.
26. All of the following are true about qualitative forecasting methods except
a.
they generally involve the use of expert judgment to develop forecasts
b.
they assume the pattern of the past will continue into the future
c.
they are appropriate when past data on the variable being forecast are not applicable
d.
they are appropriate when past data on the variable being forecast are not available
27. The forecasting method that is appropriate when the time series has no significant trend, cyclical, or
seasonal effect is
a.
moving averages
b.
mean squared error
c.
mean average deviation
d.
qualitative forecasting methods
28. One measure of the accuracy of a forecasting model is the
a.
smoothing constant
b.
trend pattern
c.
mean absolute error
d.
seasonal index
29. Which of the following forecasting methods puts the least weight on the most recent time series value?
a.
exponential smoothing with = .3
b.
exponential smoothing with = .2
c.
moving average using the most recent 4 periods
d.
moving average using the most recent 3 periods
30. Using exponential smoothing, the demand forecast for time period 10 equals the demand forecast for
time period 9 plus
a.
times (the demand forecast for time period 8)
b.
times (the error in the demand forecast for time period 9)
c.
times (the observed demand in time period 9)
d.
times (the demand forecast for time period 9)
31. Gradual shifting or movement of a time series to relatively higher or lower values over a longer period
of time is called
a.
periodicity.
b.
cycle.
c.
regression.
d.
trend.
32. A seasonal pattern
a.
can occur within a day
b.
can take more than a year to repeat itself
c.
is a multi-year run of observations above and below the trend line
d.
reflects a shift in the time series over time
33. Holt’s linear exponential smoothing is often called
a.
nonlinear trend regression
b.
time series decomposition
c.
double exponential smoothing
d.
time series deseasonalization
34. The objective of smoothing methods is to smooth out
a.
long range forecasts
b.
wide seasonal variations
c.
significant trend effects
d.
random fluctuations
35. All of the following are true about time series methods except
a.
they discover a pattern in historical data and project it into the future
b.
they identify a set of related independent, or explanatory, variables
c.
they assume that the pattern of the past will continue into the future
d.
their forecasts are based solely on past values of the variable or past forecast errors
36. All of the following are true about a cyclical pattern except
a.
it is often due to multi-year business cycles
b.
it is often combined with long-term trend patterns and called trend-cycle patterns
c.
it is an alternating sequence of data points above and below the trend line
d.
it is usually easier to forecast than a seasonal pattern due to less variability
37. All of the following are true about a stationary time series except
a.
its statistical properties are independent of time
b.
a plot of the time series will always exhibit a horizontal pattern
c.
the process generating the data has a constant mean
d.
there is no variability in the time series over time
38. In situations where you need to compare forecasting methods for different time periods, the most
appropriate accuracy measure is
a.
mean error
b.
mean absolute error
c.
mean squared error
d.
mean absolute percentage error
Exhibit 15-1
Below you are given the first five values of a quarterly time series. The multiplicative model is
appropriate and a four-quarter moving average will be used.
Year
Quarter
Time Series Value Yt
1
1
36
2
24
3
16
2
4
20
1
44
39. Refer to Exhibit 15-1. An estimate of the trend component times the cyclical component (T2Ct) for
Quarter 3 of Year 1, when a four-quarter moving average is used, is
a.
24
b.
25
c.
26
d.
28
40. Refer to Exhibit 15-1. An estimate of the seasonal-irregular component for Quarter 3 of Year 1 is
a.
.64
b.
1.5625
c.
5.333
d.
30
Exhibit 15-2
Consider the following time series.
t
1
2
3
4
Yi
4
7
9
10
41. Refer to Exhibit 15-2. The slope of linear trend equation, b1, is
a.
2.5
b.
2.0
c.
1.0
d.
1.25
42. Refer to Exhibit 15-2. The intercept, b0, is
a.
2.5
b.
2.0
c.
1.0
d.
1.25
43. Refer to Exhibit 15-2. The forecast for period 5 is
a.
10.0
b.
2.5
c.
12.5
d.
4.5
44. Refer to Exhibit 15-2. The forecast for period 10 is
a.
10.0
b.
25.0
c.
30.0
d.
22.5
Exhibit 15-3
Consider the following time series.
Year (t)
Y i
1
7
2
5
3
4
4
2
5
1
45. Refer to Exhibit 15-3. The slope of linear trend equation, b1, is
a.
-1.5
b.
+1.5
c.
8.3
d.
-8.3
46. Refer to Exhibit 15-3. The intercept, b0, is
a.
-1.5
b.
+1.5
c.
8.3
d.
-8.3
47. Refer to Exhibit 15-3. In which time period does the value of Yi reach zero?
a.
0.000
b.
0.181
c.
5.53
d.
4.21
48. Refer to Exhibit 15-3. The forecast for period 10 is
a.
6.7
b.
-6.7
c.
23.3
d.
15
PROBLEM
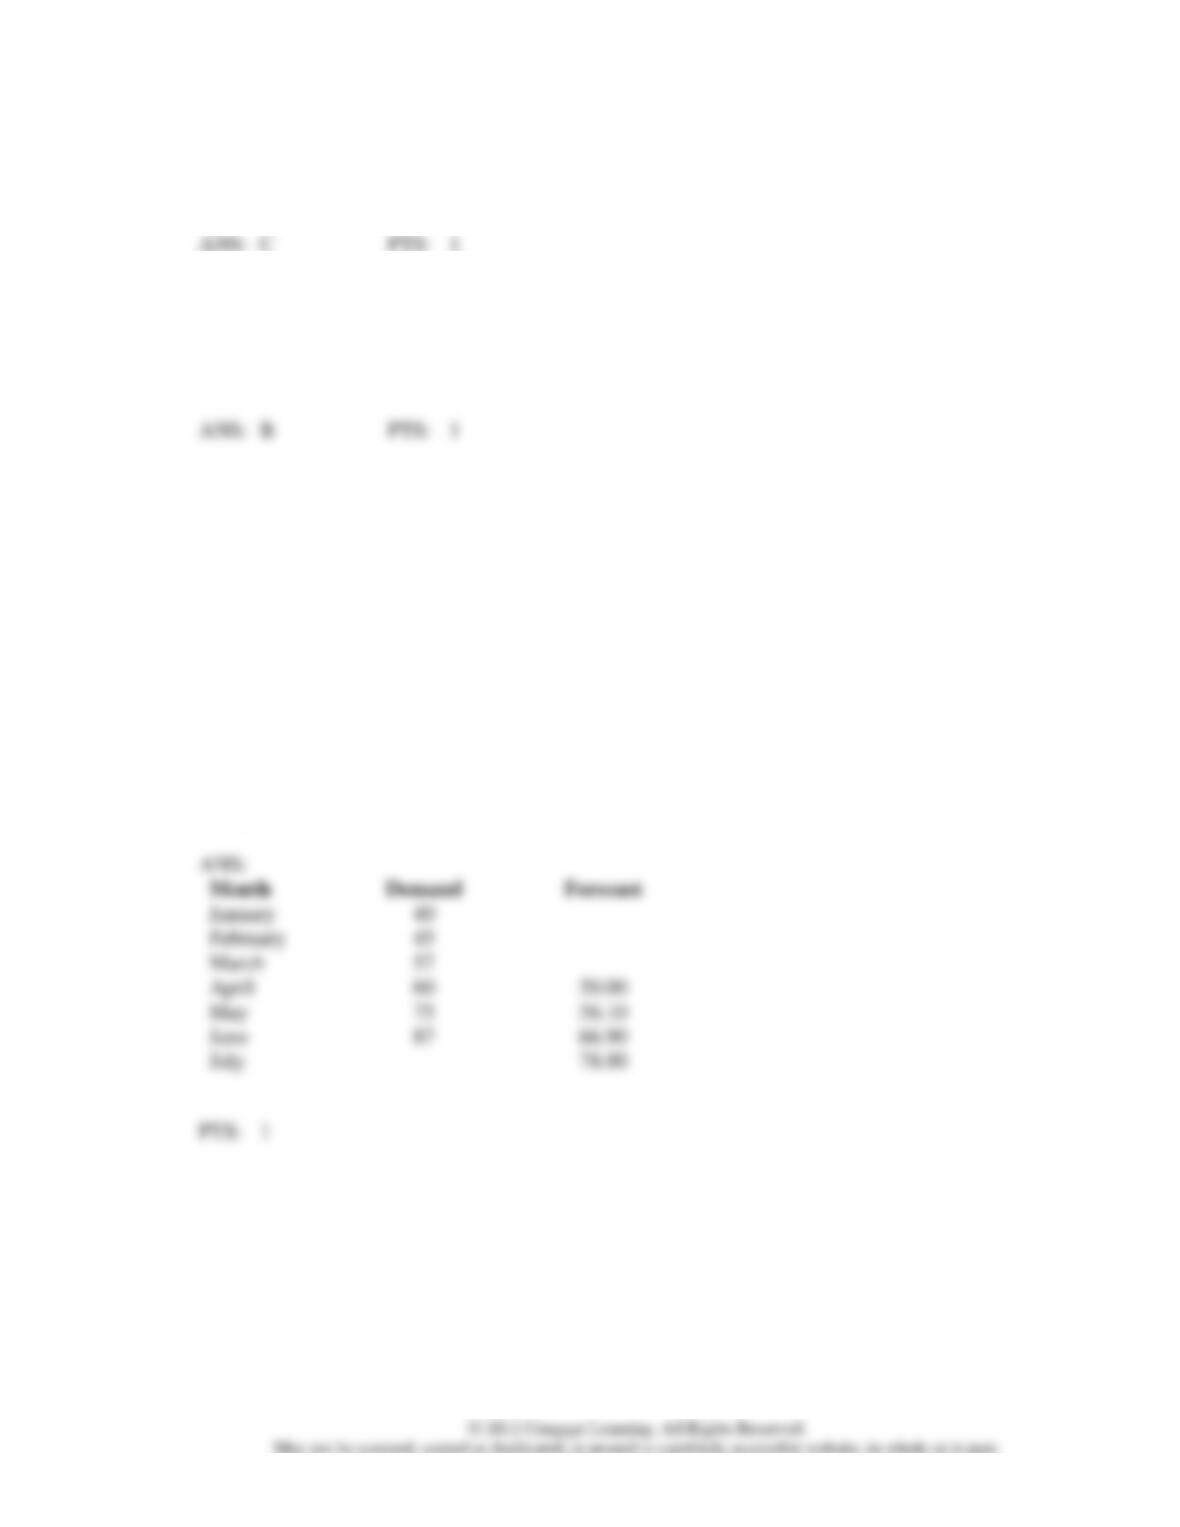
1. What is the forecast for July based on a three-month weighted moving average applied to the
following past demand data and using the weights: 5, 3,and 2 (largest weight is for most recent data)?
Show all of your computations for April through July.
Month
Demand
Forecast
January
40
February
45
March
57
April
60
May
75
June
87
July
January
40
February
45
March
57
April
60
50.00
May
75
56.10
June
87
66.90
July
78.00
2. Actual sales for January through April are shown below.
Observation
Month
Actual Sales (A)
Forecasted Sales (F)
1
January
18
2
February
23
3
March
20
4
April
16
5
May
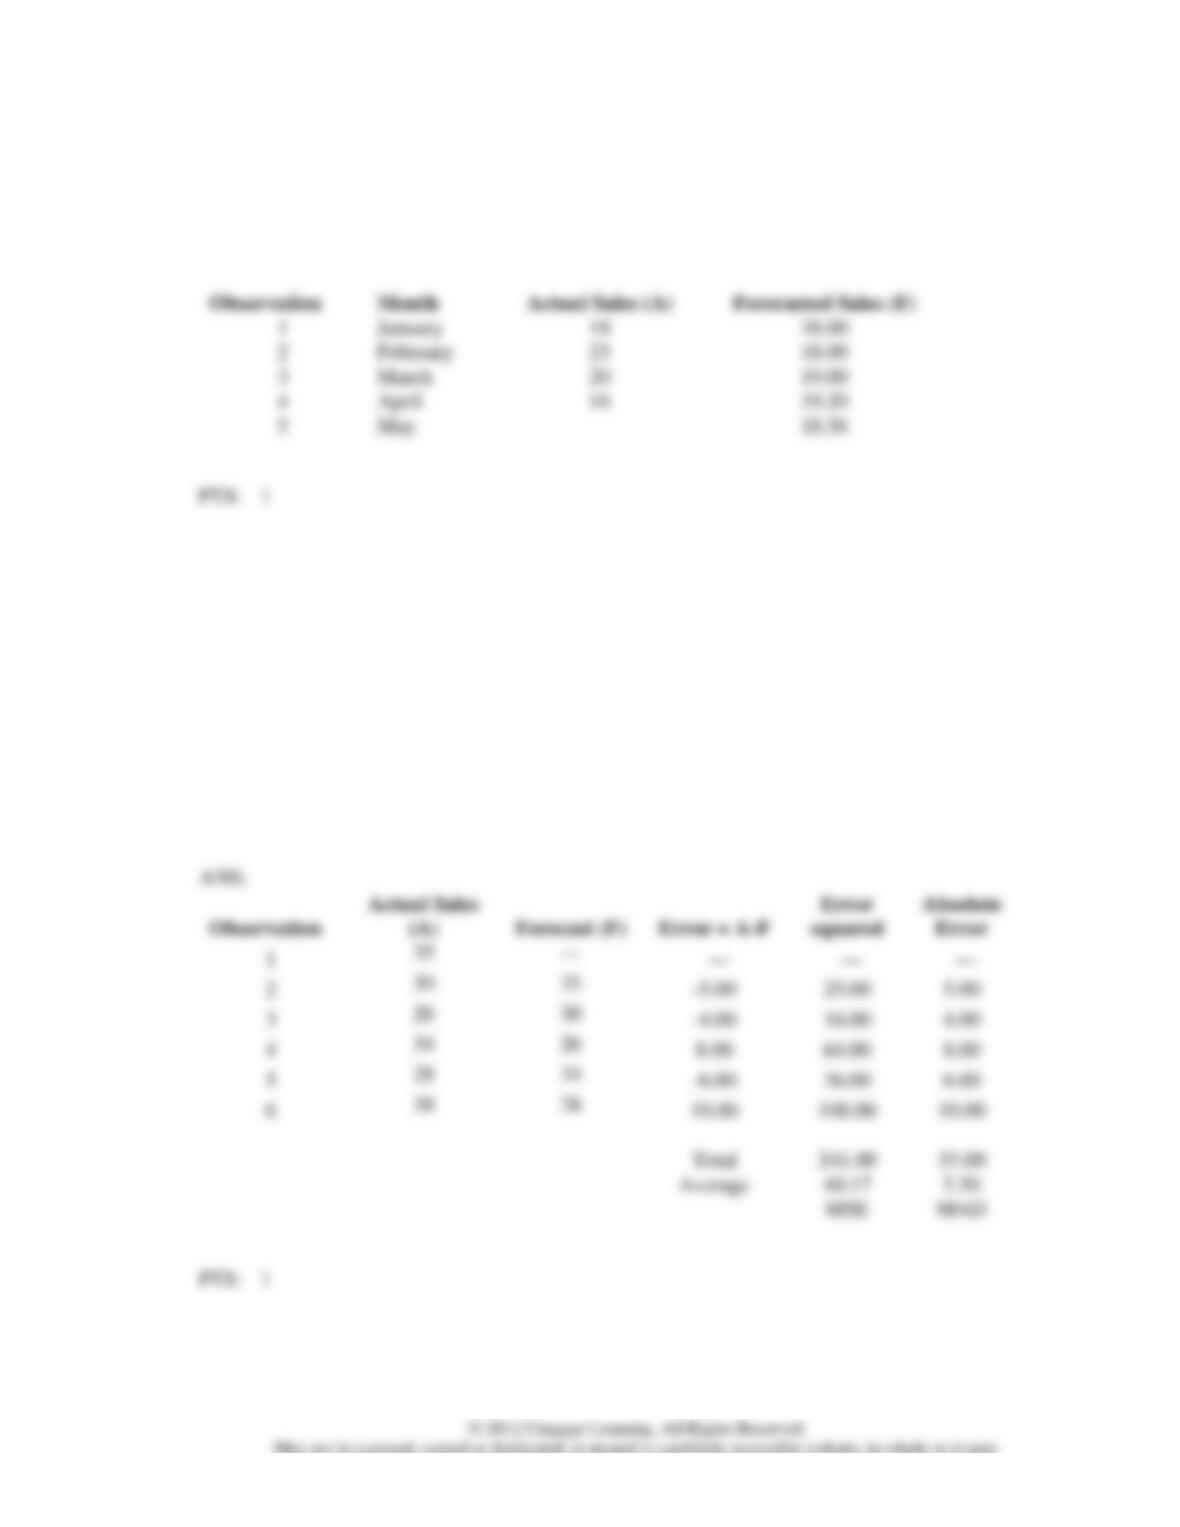
Use exponential smoothing with = 0.2 to calculate smoothed averages and forecast sales for May
from the above data. Assume the forecast for the initial period (January) is 18. Show all of your
computations.
ANS:
3. The actual demand for a product and the forecast for the product are shown below. Calculate MAD
and MSE. Show all of your computations.
Observation
Actual Demand
(A)
Forecast
(F)
1
35
—
2
30
35
3
26
30
4
34
26
5
28
34
6
38
28
Error = A-F
4. The quarterly sales (in thousands of copies) for a specific educational software over the past three
years are given in the following table.
2003
2004
2005
Quarter 1
170
180
190
Quarter 2
111
96
120
Quarter 3
270
280
290
Quarter 4
250
220
223
a.
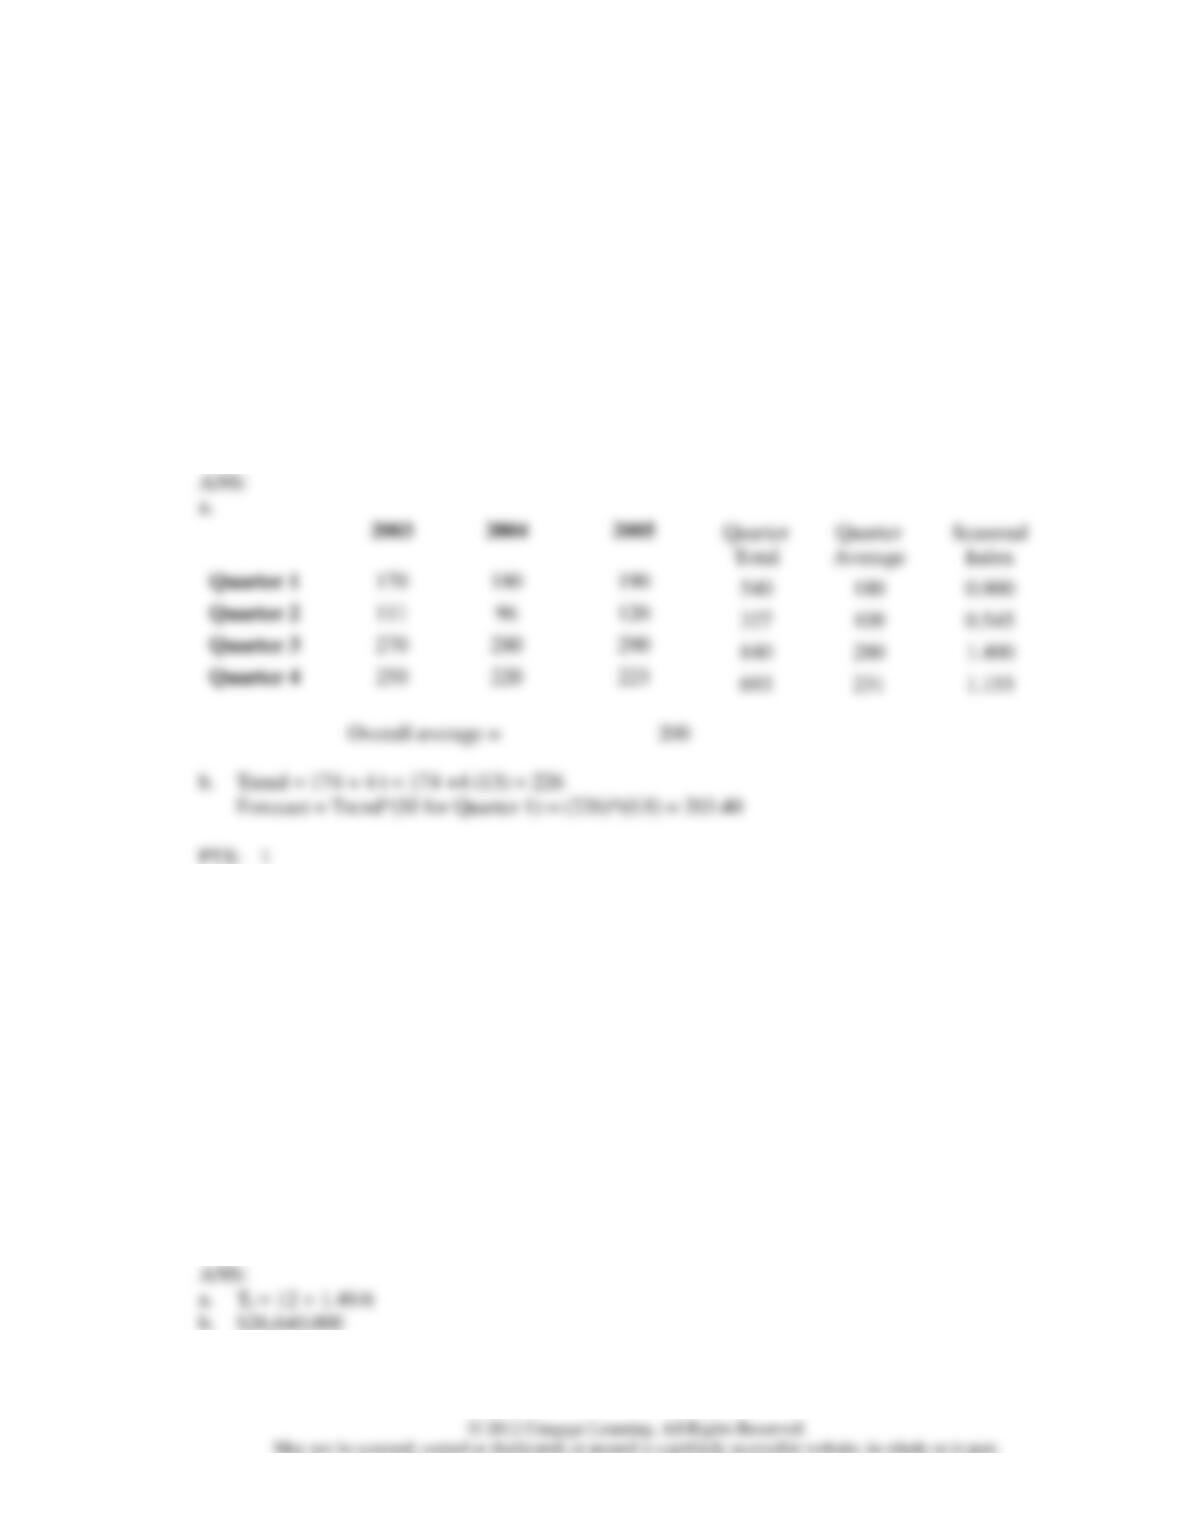
Compute the four seasonal factors (Seasonal Indexes). Show all of your computations.
b.
The trend for these data is Trend = 174 + 4 t (t represents time, where t=1 for Quarter 1 of
2003 and t=12 for Quarter 4 of 2005). Forecast sales for the first quarter of 2006 using the
trend and seasonal indexes. Show all of your computations.
Quarter 1
Quarter 2
Quarter 3
Quarter 4
5. The sales records of a company over a period of seven years are shown below.
Year
(t)
Sales
(In Millions of Dollars)
1
12
2
16
3
17
4
19
5
18
6
21
7
22
a.
Develop a linear trend expression for the above time series.
b.
Forecast sales for period 10.
a.