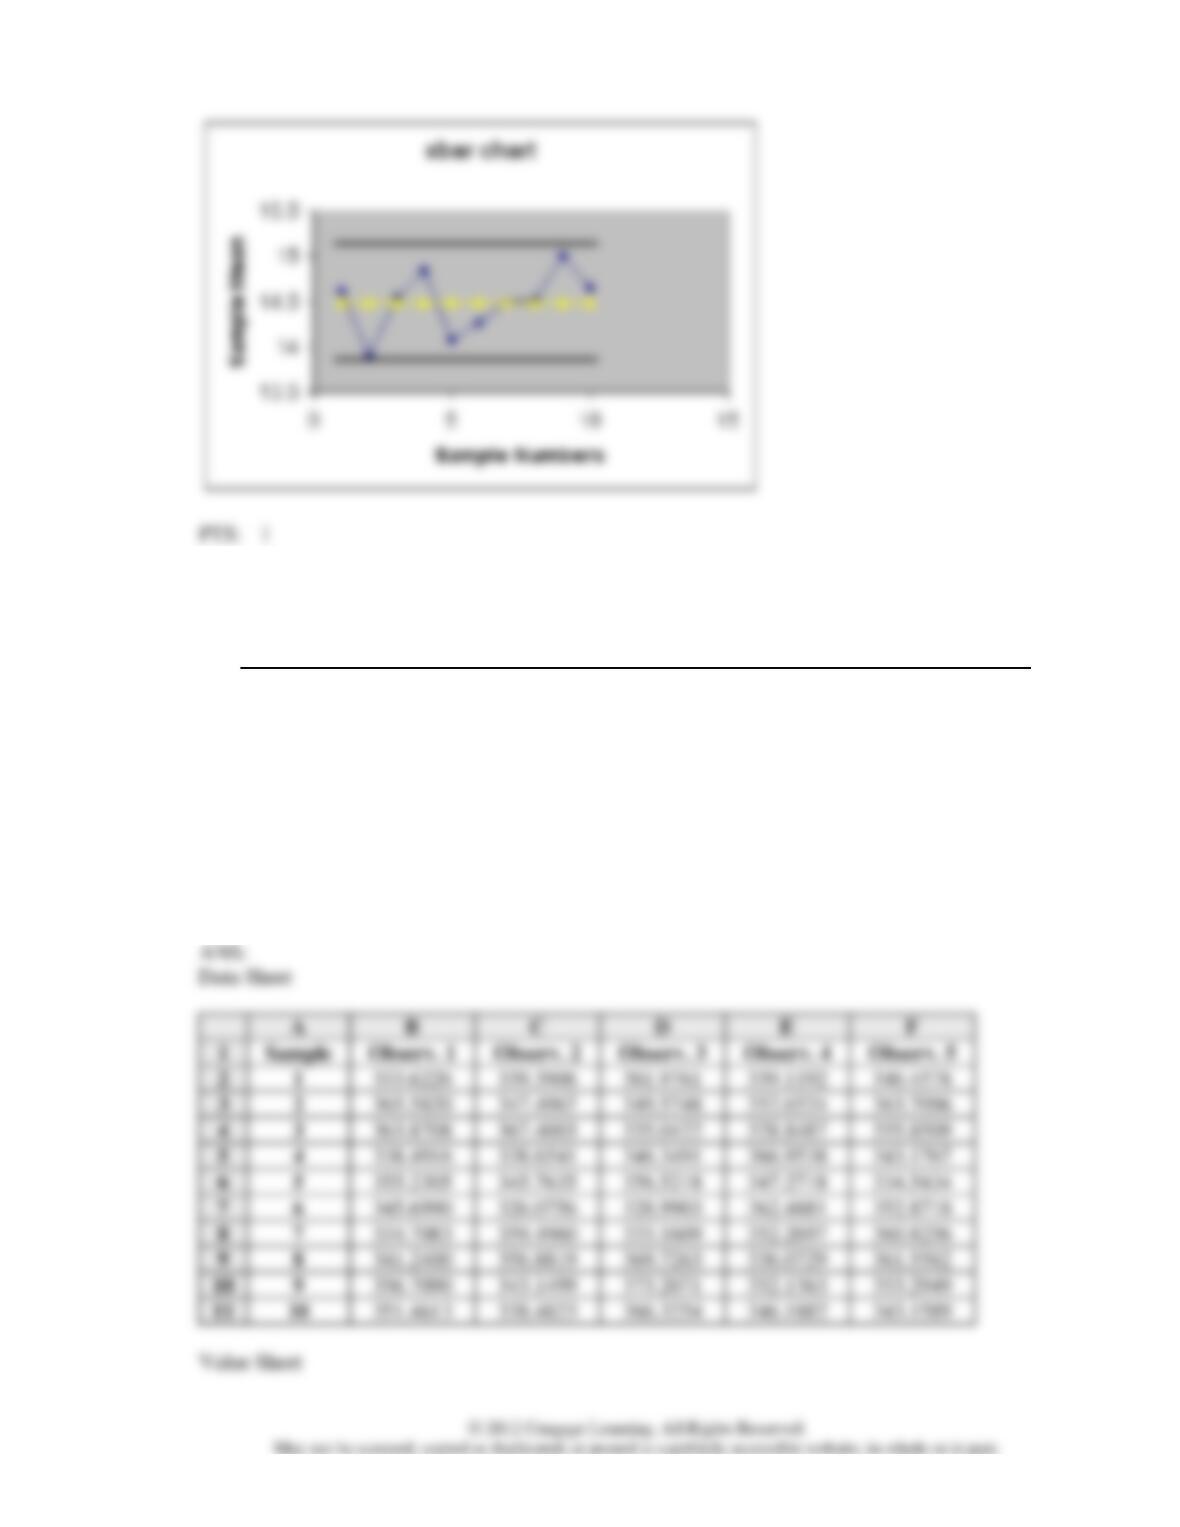
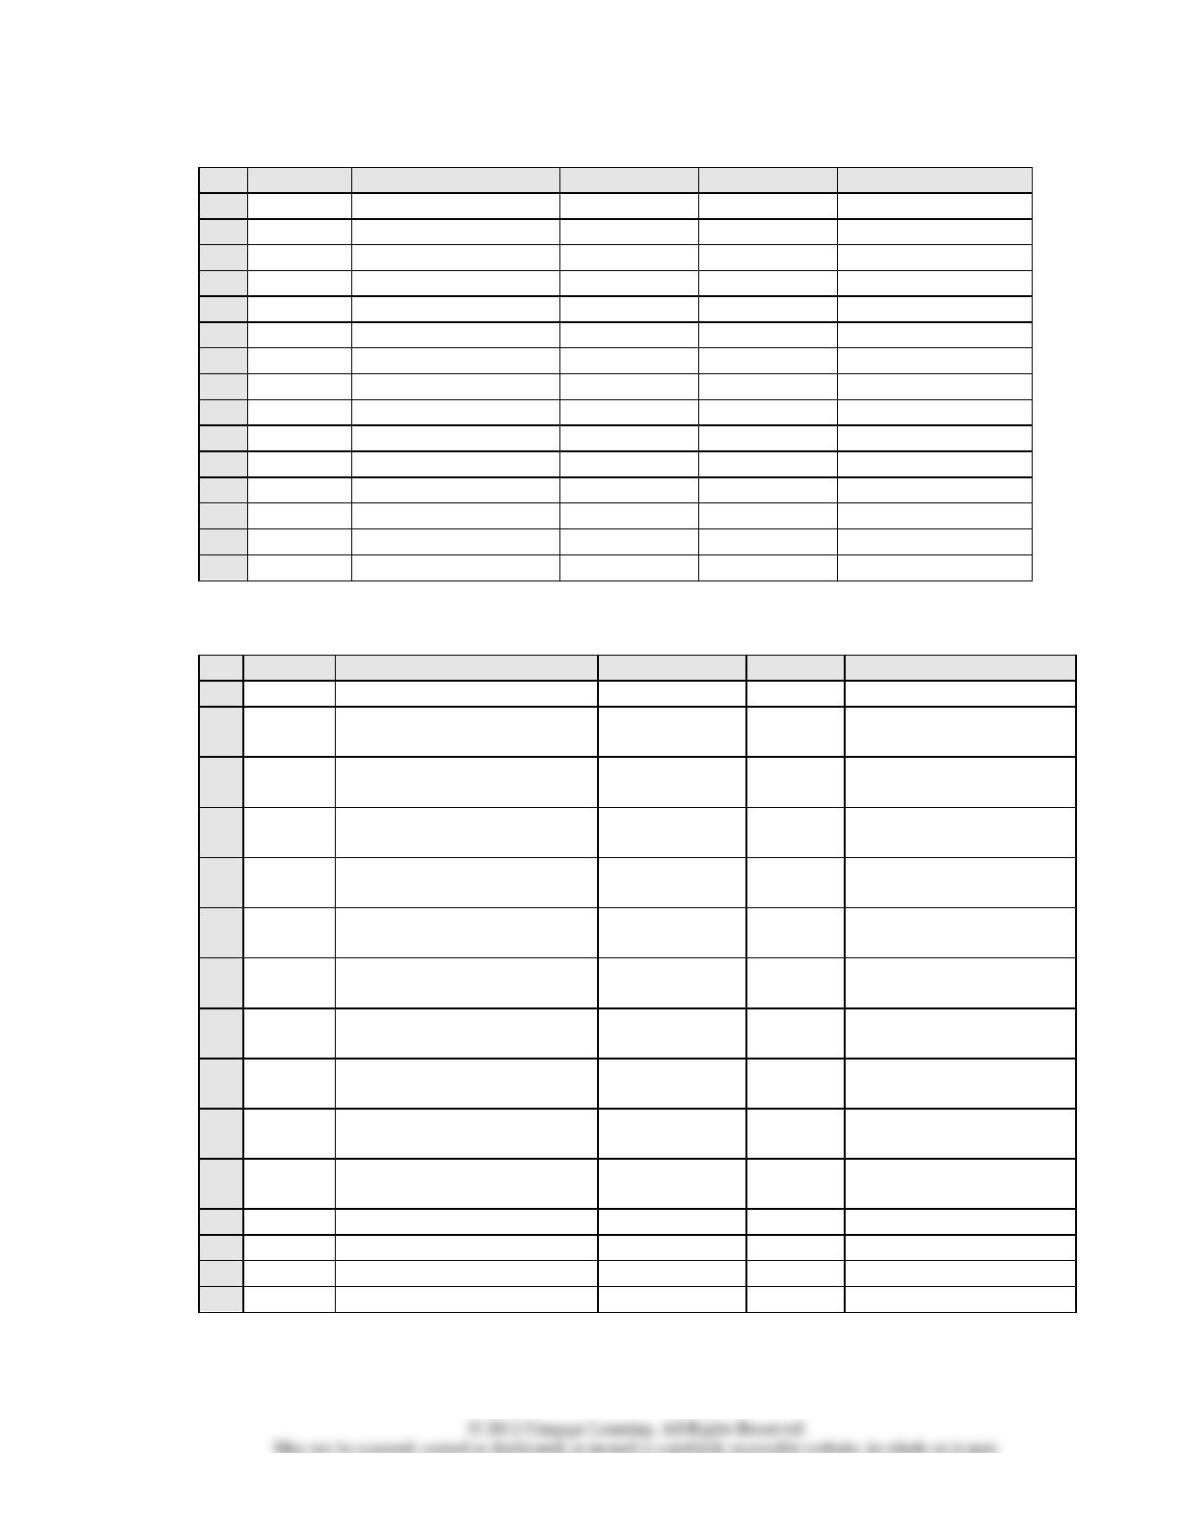
6. The following data represent the filling weights based on samples of 350-gram containers. Ten
samples of size 5 were taken. Use Excel to develop an R chart.
Sample
Observ. 1
Observ. 2
Observ. 3
Observ. 4
Observ. 5
1
333.6226
339.3906
361.9761
339.1192
346.4578
2
365.5820
347.4967
349.5748
352.6524
363.7096
3
363.8708
367.4003
335.0422
328.8487
355.8509
4
338.4916
338.6541
346.3491
366.9538
343.1767
5
355.2305
345.7635
356.5218
347.2718
334.5434
6
345.6990
326.0756
328.9903
362.4881
352.8718
7
334.7083
359.4960
333.1609
352.2697
360.8256
8
341.2400
356.8819
369.7263
336.0729
361.5562
9
356.7090
343.1499
373.2071
352.1363
353.2949
10
351.4613
338.4823
366.3254
346.1882
343.1589
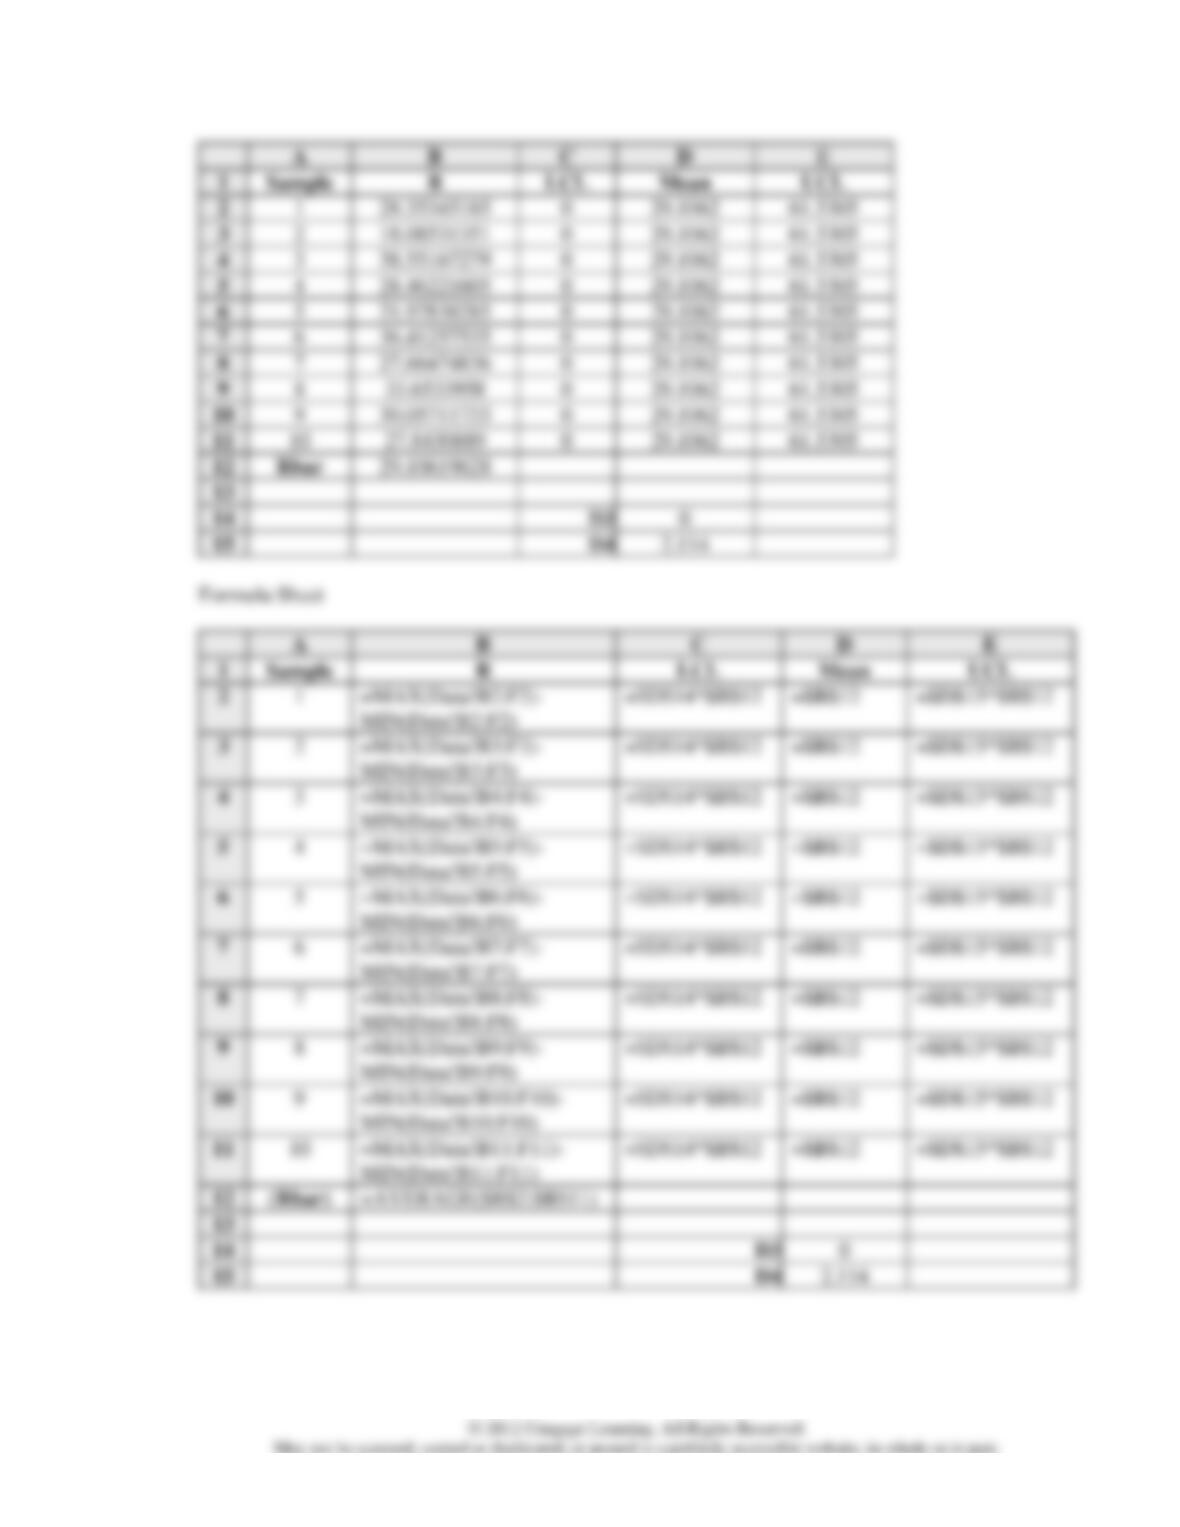
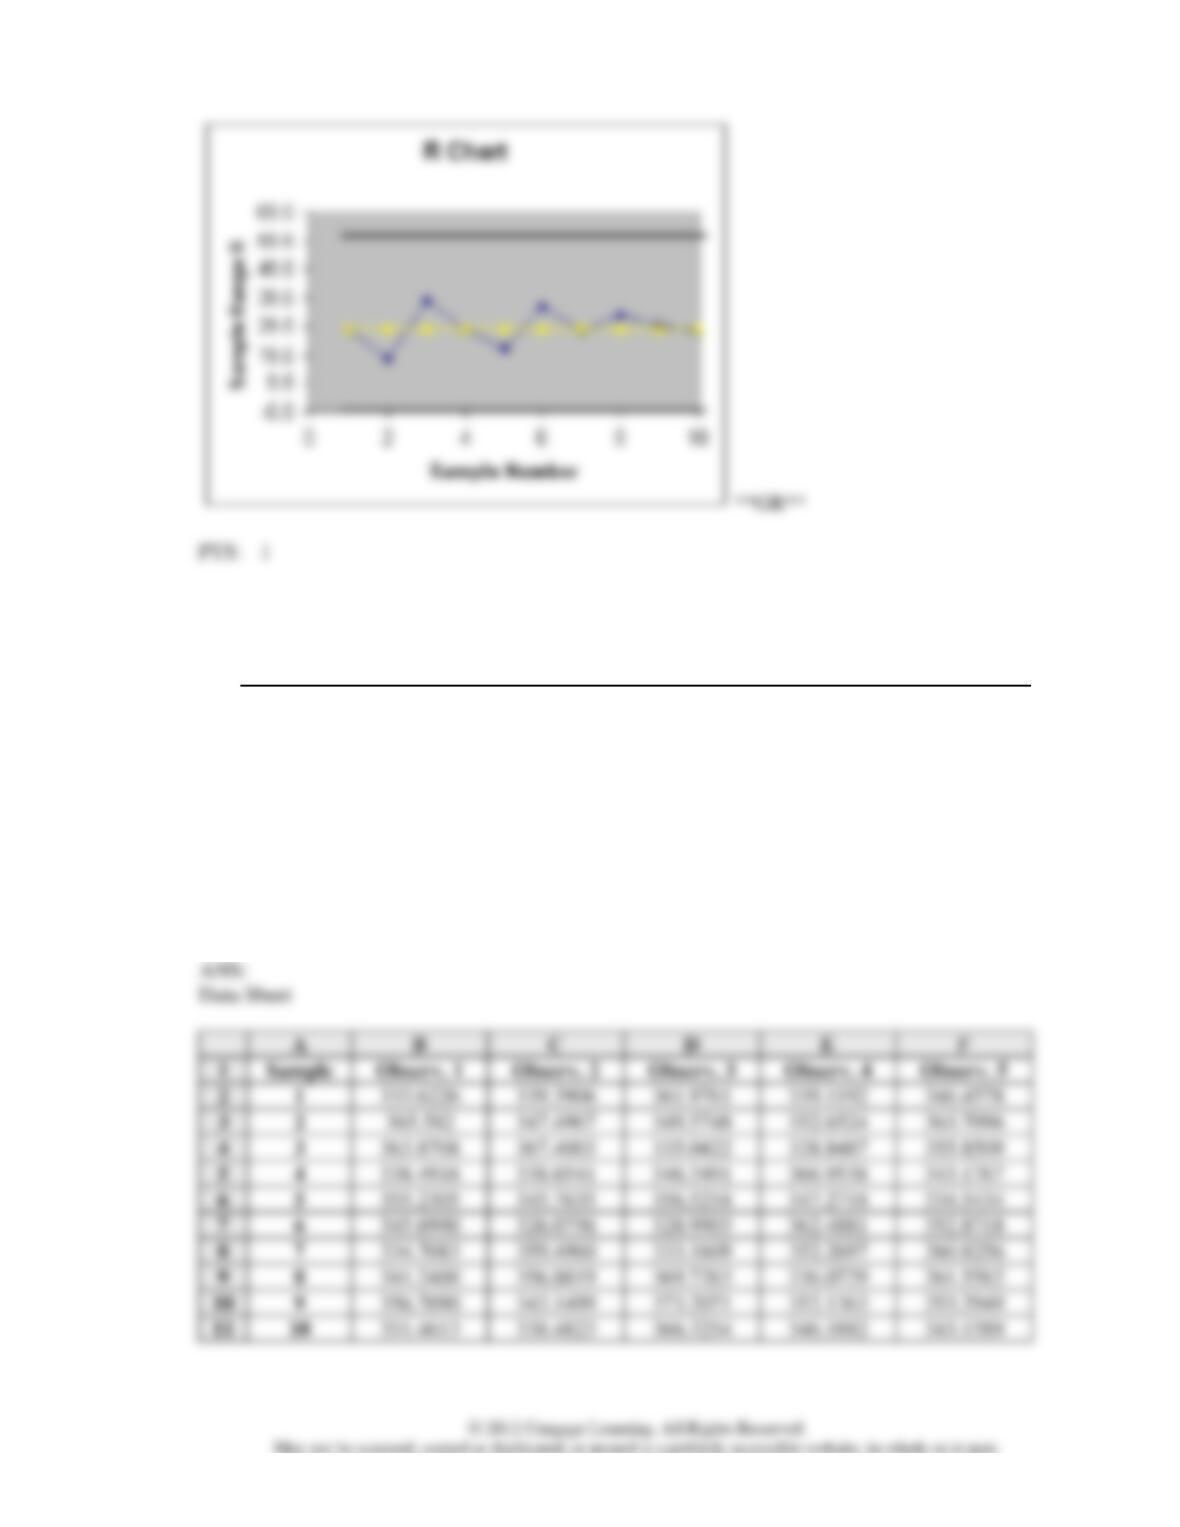
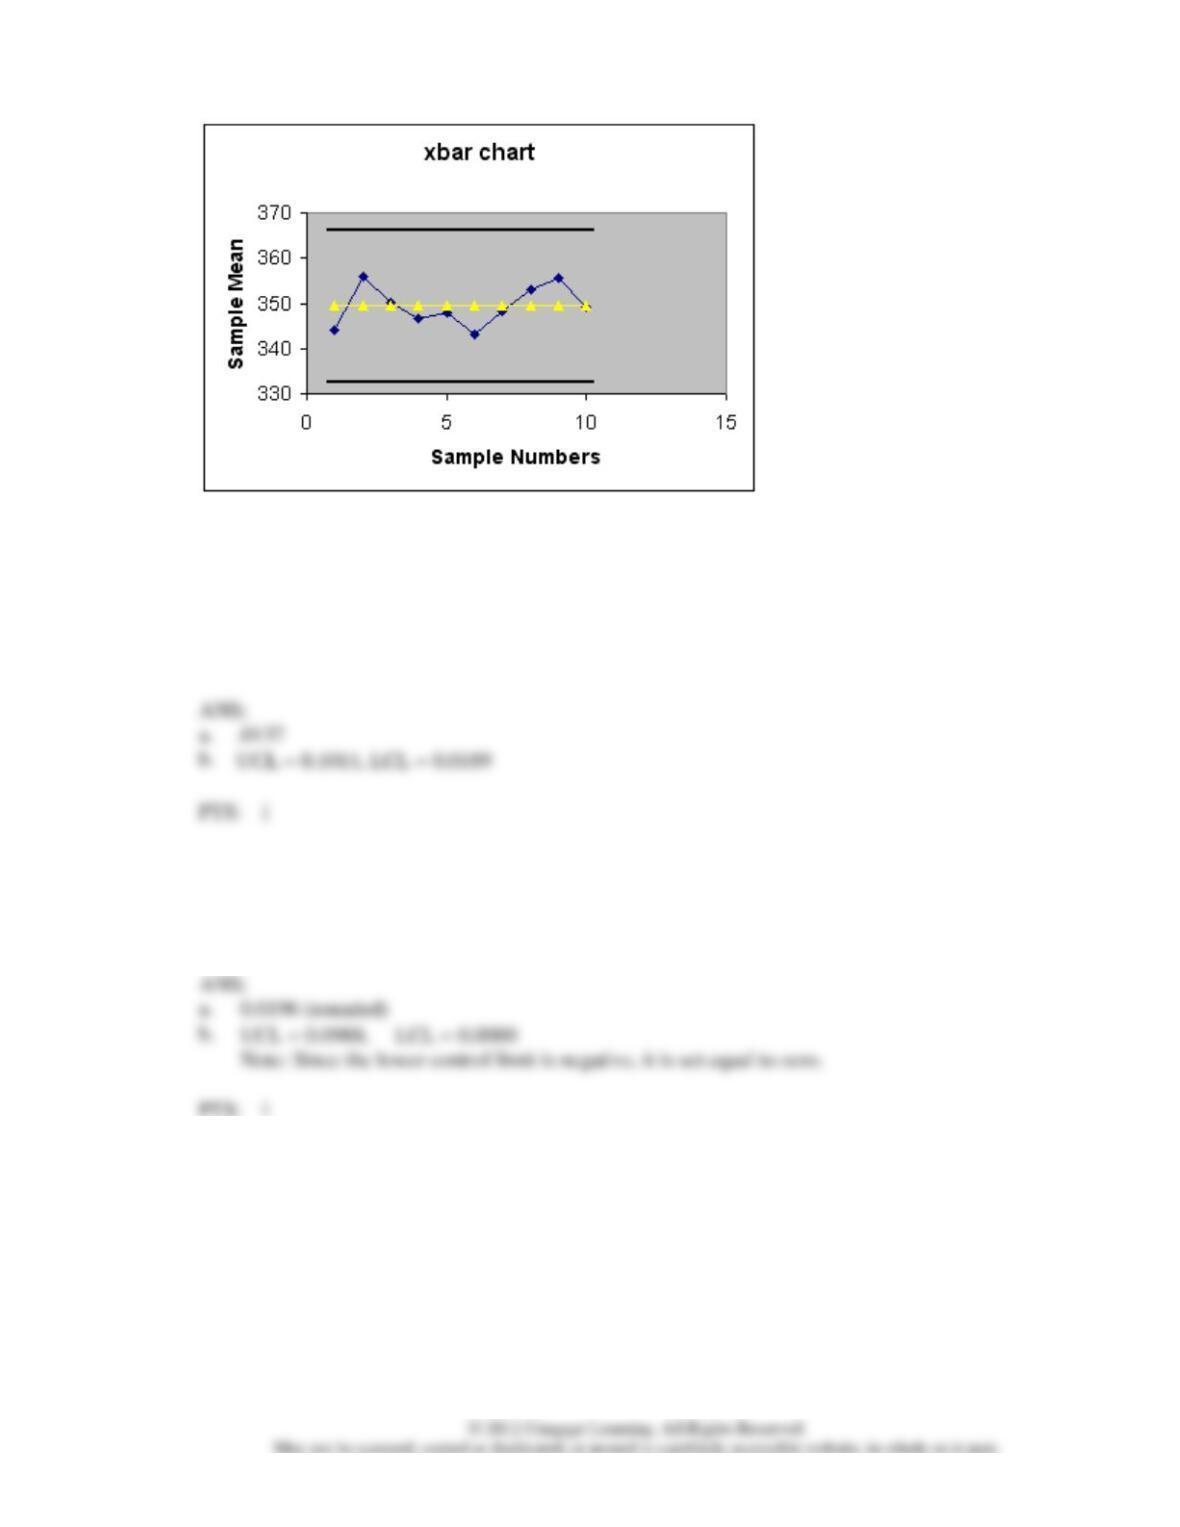
7. The following data represent the filling weights based on samples of 350-gram containers. Ten
samples of size 5 were taken. Use Excel to develop an x-bar chart.
Sample
Observ. 1
Observ. 2
Observ. 3
Observ. 4
Observ. 5
1
333.6226
339.3906
361.9761
339.1192
346.4578
2
365.5820
347.4967
349.5748
352.6524
363.7096
3
363.8708
367.4003
335.0422
328.8487
355.8509
4
338.4916
338.6541
346.3491
366.9538
343.1767
5
355.2305
345.7635
356.5218
347.2718
334.5434
6
345.6990
326.0756
328.9903
362.4881
352.8718
7
334.7083
359.4960
333.1609
352.2697
360.8256
8
341.2400
356.8819
369.7263
336.0729
361.5562
9
356.7090
343.1499
373.2071
352.1363
353.2949
10
351.4613
338.4823
366.3254
346.1882
343.1589
Value Sheet
A
B
C
D
E
1
Sample
Xbar
LCL
Mean
UCL
2
1
344.1133
332.6003
349.3945
366.1888
3
2
355.8031
332.6003
349.3945
366.1888
4
3
350.2026
332.6003
349.3945
366.1888
5
4
346.7251
332.6003
349.3945
366.1888
6
5
347.8662
332.6003
349.3945
366.1888
7
6
343.2250
332.6003
349.3945
366.1888
8
7
348.0921
332.6003
349.3945
366.1888
9
8
353.0955
332.6003
349.3945
366.1888
10
9
355.6994
332.6003
349.3945
366.1888
11
10
349.1232
332.6003
349.3945
366.1888
12
Mean
349.3945
13
14
A2
0.577
15
Rbar
29.1062
Formula Sheet
A
B
C
D
E
1
Sample
Xbar
LCL
Mean
UCL
2
1
=AVERAGE(Data!B2:F2)
=$B$12-
$D$14*$D$15
=$B$12
=$B$12+$D$14*$D$15
3
2
=AVERAGE(Data!B3:F3)
=$B$12-
$D$14*$D$15
=$B$12
=$B$12+$D$14*$D$15
4
3
=AVERAGE(Data!B4:F4)
=$B$12-
$D$14*$D$15
=$B$12
=$B$12+$D$14*$D$15
5
4
=AVERAGE(Data!B5:F5)
=$B$12-
$D$14*$D$15
=$B$12
=$B$12+$D$14*$D$15
6
5
=AVERAGE(Data!B6:F6)
=$B$12-
$D$14*$D$15
=$B$12
=$B$12+$D$14*$D$15
7
6
=AVERAGE(Data!B7:F7)
=$B$12-
$D$14*$D$15
=$B$12
=$B$12+$D$14*$D$15
8
7
=AVERAGE(Data!B8:F8)
=$B$12-
$D$14*$D$15
=$B$12
=$B$12+$D$14*$D$15
9
8
=AVERAGE(Data!B9:F9)
=$B$12-
$D$14*$D$15
=$B$12
=$B$12+$D$14*$D$15
10
9
=AVERAGE(Data!B10:F10)
=$B$12-
$D$14*$D$15
=$B$12
=$B$12+$D$14*$D$15
11
10
=AVERAGE(Data!B11:F11)
=$B$12-
$D$14*$D$15
=$B$12
=$B$12+$D$14*$D$15
12
Mean
=AVERAGE(B2:B11)
13
14
A2
0.577
15
Rbar
29.1062
PTS: 1
8. A production process is considered in control if 6% of the items produced are defective. Samples of
size 300 are used for the inspection process.
a.
Determine the standard error of the proportion.
b.
Determine the upper and the lower control limits for the p chart.
a.
.0137
UCL = 0.1011, LCL = 0.0189
9. A production process is considered in control if 4% of the items produced are defective. Samples of
size 100 are used for the inspection process.
a.
Determine the standard error of the proportion.
b.
Determine the upper and the lower control limits for the p chart.
a.
0.0196 (rounded)
UCL = 0.0988, LCL = 0.0000
Note: Since the lower control limit is negative, it is set equal to zero.
10. Brakes Shop, Inc., is a franchise that specializes in repairing brake systems of automobiles. The
company purchases brake shoes from a national supplier. Currently, lots of 1,000 brake shoes are
purchased, and each shoe is inspected before being installed on an automobile. The company has
decided, instead of 100% inspection, to adopt an acceptance sampling plan.
a.
Explain what is meant by the acceptance sampling plan.
b.
If the company decides to adopt an acceptance sampling plan, what kinds of risks are there?
c.
The quality control department of the company has decided to select a sample of 10 shoes and
inspect them for defects. Furthermore, it has been decided that if the sample contains no
defective parts, the entire lot will be accepted. If there are 50 defective shoes in a shipment,
what is the probability that the entire lot will be accepted?
d.
What is the probability of accepting the lot if there are 100 defective units in the lot?
d.
.3487
11. The quality control department of a company has decided to select a sample of 20 items from each
shipment of goods it receives and inspect them for defects. It has been decided that if the sample
contains no defective parts, the entire lot will be accepted. Each shipment contains 1,000 items.
a.
What is the probability of accepting a lot that contains 10% defective items?
b.
What is the probability of accepting a lot that contains 5% defective items?
c.
What is the probability of rejecting a lot that contains 15% defective items?
b.
0.3585
c.
0.9612
12. An acceptance sampling plan uses a sample of 18 with an acceptance criterion of zero. Determine the
probability of accepting shipments that contain 5, 10, 15, 20, 25, 30, 35, 40, and 45% defective units.
13. The quality control department of a company has decided to select a sample of 10 items from the
shipments received; and if the sample contains no defective parts, the entire shipment will be accepted.
a.
If there are 40 defective items in a shipment, what is the probability that the entire lot will be
accepted?
b.
Use the binomial table and read the probability of accepting lots that contain 5, 10, 15, 20, 25,
30, 35, 40, 45, and 50% defective units.
0.9044
10
0.3487
20
0.1074
35
0.0135
45
0.0025
14. The weight of bags of cement filled by Granite Rock Company’s packaging process is normally
distributed with a mean of 50 pounds and a standard deviation of 1.5 pounds when the process is in
control. What should the control limits be for a sample mean, , chart if 9 bags are sampled at a
time?
15. Snipper, Inc. manufactures lawnmowers that require minor, final assembly by the customer. A sealed
plastic bag containing the hardware (nuts, bolts, washers, and so on) needed for final assembly is
included with each lawnmower shipped. During a week of normal, in-control operation, twenty
samples of 200 bags of hardware were examined for content (hardware type and count) accuracy. A
total of 104 bags of the 4000 examined failed to have the correct contents.
a. Compute the upper limit, center line, and lower limit for a p chart.
b. Compute the upper limit, center line, and lower limit for an np chart.
16. A U.S. manufacturer of digital video recorders purchases a circuit board from a Taiwanese firm. The
circuit boards are shipped in lots of 2000. The acceptance sampling procedure uses 12 randomly
selected circuit boards. The acceptance number is 1. If p0 is .03 and p1 is .20, what are the
producer’s and consumer’s risks for this plan?
17. To inspect incoming shipments of components, a manufacturer is considering samples of sizes 12, 15,
and 18. Use binomial probabilities to select a sampling plan that provides a producer’s risk of
= .12
when p0 is .04 and a consumer’s risk of
= .08 when p1 is .25.
18. A process sampled 30 times with a sample of size nine resulted in = 12.7 and = 0.8. Compute
the upper and lower control limits for the and charts for this process.
19. A process that is in control has a mean of
= 56.5 and a standard deviation of
= 3.4. What should
the control limits be for a sample mean chart if samples of size 8 are taken?
20. An acceptance sampling plan with n = 20 and c = 1 has been designed with a producer’s risk of .12.
a. Was the value of p0 equal to .02, .03, .04, or .05?
b. What is the consumer’s risk associated with this plan if p1 is .08?
c. Assume the consumer’s risk found in (b) is unacceptably high. Which modification of the sampling
plan will result in the greater reduction of the consumer’s risk, increasing n to 30 or decreasing c
to 0?
21. Ledd Electronics has received a large shipment of power supply units for the desktop computers being
assembled. The units are coming from a new supplier and Ledd is not sure what the actual defect rate
will be for this component. Ledd is considering an acceptance sampling plan with n = 30 and c = 1.
a. Find the probability of accepting a lot when the defect rate is 2%, 4%, and 6%.
b. What happens to the producer’s risk as the defect rate increases?
c. What happens to the consumer’s risk as the defect rate increases?
22. Harry Coates wants to construct and R charts at the bag-filling operation for Meow Chow cat food.
He knows that when the filling operation is functioning correctly, bags of cat food should average
50.00 pounds and 5-bag samples should have an average range of .330 pounds.
Harry had twenty 5-bag samples taken at 2-hour intervals and the sample means and ranges are shown
below. Determine the center lines and upper and lower control limits for the and R charts.
Sample
Number
Sample
Mean ( )
Sample
Range (R)
Sample
Number
Sample
Mean ( )
Sample
Range (R)
1
50.018
0.43
11
49.958
0.32
2
50.132
0.19
12
50.060
0.27
3
50.060
0.41
13
49.978
0.39
4
50.112
0.33
14
49.986
0.40
5
49.998
0.29
15
50.036
0.52
6
49.892
0.29
16
50.066
0.27
7
49.944
0.30
17
49.946
0.33
8
49.922
0.30
18
49.980
0.24
9
50.004
0.25
19
49.972
0.49
10
50.118
0.14
20
49.966
0.28
23. Janie Hochevar, director of production at the center, has decided to record the number of defective
labels in random daily samples on control charts. Janie estimates that 1.5 percent loose labels is
typical when the labeling process is in control.
Twelve daily samples, each consisting of 200 pairs of jeans, were selected and examined. The
number of defective labels found in each sample is shown below.
Sample
Number
Number of
Defectives
Sample
Number
Number of
Defectives
1
2
7
3
2
3
8
0
3
5
9
5
4
2
10
3
5
7
11
9
6
1
12
2
a. Determine the center line and the 3s control limits for the p chart.
b. Decide if the labeling operation is in control.
24. The No-Cal Bottling Company bottles soft drinks for sale to government commissaries. The bottles
come in only one flavor (chocolate-lemon) and only one size (32 ounces). Joan Stickler, the quality
control officer for the commissaries, wants to keep track of the fill weights of No-Cal and begins to
draw daily samples of 100 bottles from the daily receipts. The first ten sample means and ranges are:
Sample
Sample
Mean ( )
Sample
Range (R)
Sample
Sample
Mean ( )
Sample
Range (R)
1
31.5
2.1
6
31.5
.7
2
31.2
2.5
7
31.7
1.2
3
32.1
3.0
8
31.2
2.0
4
30.9
1.6
9
32.8
1.7
5
32.7
1.7
10
31.9
0
If sample ranges ordinarily average 2.5 ounces:
a. Compute 3s control limits for sample means.
b. Compute 3s control limits for sample ranges.
c. What would you conclude about the fill weights of NoCal?