CHAPTER 3—DESCRIPTIVE STATISTICS: NUMERICAL MEASURES
MULTIPLE CHOICE
1. The interquartile range is the difference between the
a.
first and second quartiles
b.
first and third quartiles
c.
second and third quartiles
d.
second and fourth quartiles
2. The coefficient of determination is equal to the
a.
absolute value of the correlation coefficient
b.
squared value of the correlation coefficient
c.
square-root of the correlation coefficient
d.
inverse value of the correlation coefficient
3. Generally, which one of the following is the least appropriate measure of central tendency for a data
set that contains outliers?
a.
mean
b.
median
c.
2nd quartile
d.
50th percentile
4. An important measure of location for categorical data is the
a.
mean
b.
median
c.
mode
d.
margin
5. The measure of variability easiest to compute, but seldom used as the only measure, is the
a.
range
b.
interquartile range
c.
standard deviation
d.
variance
6. In computing descriptive statistics for grouped data, the ____ are used to approximate the data values
in each class.
a.
class lower limits
b.
class upper limits
c.
class midpoints
d.
class ranges
7. Which of the following is not a measure of variability of a single variable?
a.
range
b.
covariance
c.
standard deviation
d.
coefficient of variation
8. The empirical rule states that, for data having a bell-shaped distribution, the percentage of data values
being within one standard deviation of the mean is approximately
a.
33
b.
50
c.
68
d.
95
9. A box plot is a graphical representation of data that is based on
a.
the empirical rule
b.
z-scores
c.
a histogram
d.
a five-number summary
10. The coefficient of variation indicates how large the standard deviation is relative to the
a.
mean
b.
median
c.
range
d.
variance
11. Which of the following descriptive statistics is not measured in the same units as the data?
a.
35th percentile
b.
standard deviation
c.
variance
d.
interquartile range
12. A numerical measure computed from a sample, such as sample mean, is known as a
a.
population parameter
b.
sample parameter
c.
sample statistic
d.
population mean
13. A numerical measure, such as a mean, computed from a population is known as a
a.
population parameter
b.
sample parameter
c.
sample statistic
d.
sample mean
14. Since the population size is always larger than the sample size, then the sample statistic
a.
can never be larger than the population parameter
b.
can never be equal to the population parameter
c.
can never be zero
d.
None of the other answers are correct.
15.
is an example of a
a.
population parameter
b.
sample statistic
c.
population variance
d.
mode
16. The mean of a sample is
a.
always equal to the mean of the population
b.
always smaller than the mean of the population
c.
computed by summing the data values and dividing the sum by (n − 1)
d.
computed by summing all the data values and dividing the sum by the number of items
17. The mean of the sample
a.
is always larger than the mean of the population from which the sample was taken
b.
is always smaller than the mean of the population from which the sample was taken
c.
can never be zero
d.
None of the other answers are correct.
18. Since the population is always larger than the sample, the value of the sample mean
a.
is always smaller than the true value of the population mean
b.
is always larger than the true value of the population mean
c.
is always equal to the true value of the population mean
d.
could be larger, equal to, or smaller than the true value of the population mean
19. After the data has been arranged from smallest value to largest value, the value in the middle is called
the
a.
range
b.
median
c.
mean
d.
None of the other answers are correct.
20. If a data set has an even number of observations, the median
a.
can not be determined
b.
is the average value of the two middle items
c.
must be equal to the mean
d.
is the average value of the two middle items when all items are arranged in ascending
order
21. Since the median is the middle value of a data set, it must always be
a.
smaller than the mode
b.
larger than the mode
c.
smaller than the mean
d.
None of the other answers are correct.
22. The most frequently occurring value of a data set is called the
a.
range
b.
mode
c.
mean
d.
None of the other answers are correct.
23. Since the mode is the most frequently occurring data value, it
a.
can never be larger than the mean
b.
is always larger than the median
c.
is always larger than the mean
d.
None of the other answers are correct.
24. Excel’s __________ function can be used to compute the mean.
a.
MAX
b.
AVERAGE
c.
MEDIAN
d.
MODE
25. Excel’s __________ function can be used to compute the median.
a.
MAX
b.
AVERAGE
c.
MEDIAN
d.
MODE
26. Excel’s __________ function can be used to compute the mode.
a.
MAX
b.
AVERAGE
c.
MEDIAN
d.
MODE.SNGL
27. Excel provides functions for computing the
a.
mean
b.
median
c.
mode
d.
Excel provides functions for all of these.
28. In computing the pth percentile, if the index i is an integer the pth percentile is the
a.
data value in position i
b.
data value in position i + 1
c.
average of data values in position i and i + 1
29. The 50th percentile is the
a.
mode
b.
median
c.
mean
d.
third quartile
30. The 75th percentile is also the
a.
first quartile
b.
second quartile
c.
third quartile
d.
fourth quartile
31. The first quartile
a.
contains at least one third of the data elements
b.
is the same as the 25th percentile
c.
is the same as the 50th percentile
d.
is the same as the 75th percentile
32. Which of the following is not a measure of location?
a.
mean
b.
median
c.
variance
d.
mode
33. The median of a sample will always equal the
a.
mode
b.
mean
c.
50th percentile
d.
all of these answers are correct
34. The measure of location that is the most likely to be influenced by extreme values in the data set is the
a.
range
b.
median
c.
mode
d.
mean
35. The difference between the largest and the smallest data values is the
a.
variance
b.
interquartile range
c.
range
d.
coefficient of variation
36. The interquartile range is
a.
the 50th percentile
b.
another name for the variance
c.
the difference between the largest and smallest values
d.
the difference between the third quartile and the first quartile
37. The interquartile range is used as a measure of variability to overcome what difficulty of the range?
a.
the sum of the range variances is zero
b.
the range is difficult to compute
c.
the range is influenced too much by extreme values
d.
the range is negative
38. The sample variance
a.
is always smaller than the true value of the population variance
b.
is always larger than the true value of the population variance
c.
could be smaller, equal to, or larger than the true value of the population variance
d.
can never be zero
39. The variance of the sample
a.
can never be negative
b.
can be negative
c.
cannot be zero
d.
cannot be less than one
40. The population variance can never be
a.
zero
b.
larger than the standard deviation
c.
negative
d.
all of these are correct
41. The sum of deviations of the individual data elements from their mean is
a.
always greater than zero
b.
always less than zero
c.
sometimes greater than and sometimes less than zero, depending on the data elements
d.
always equal to zero
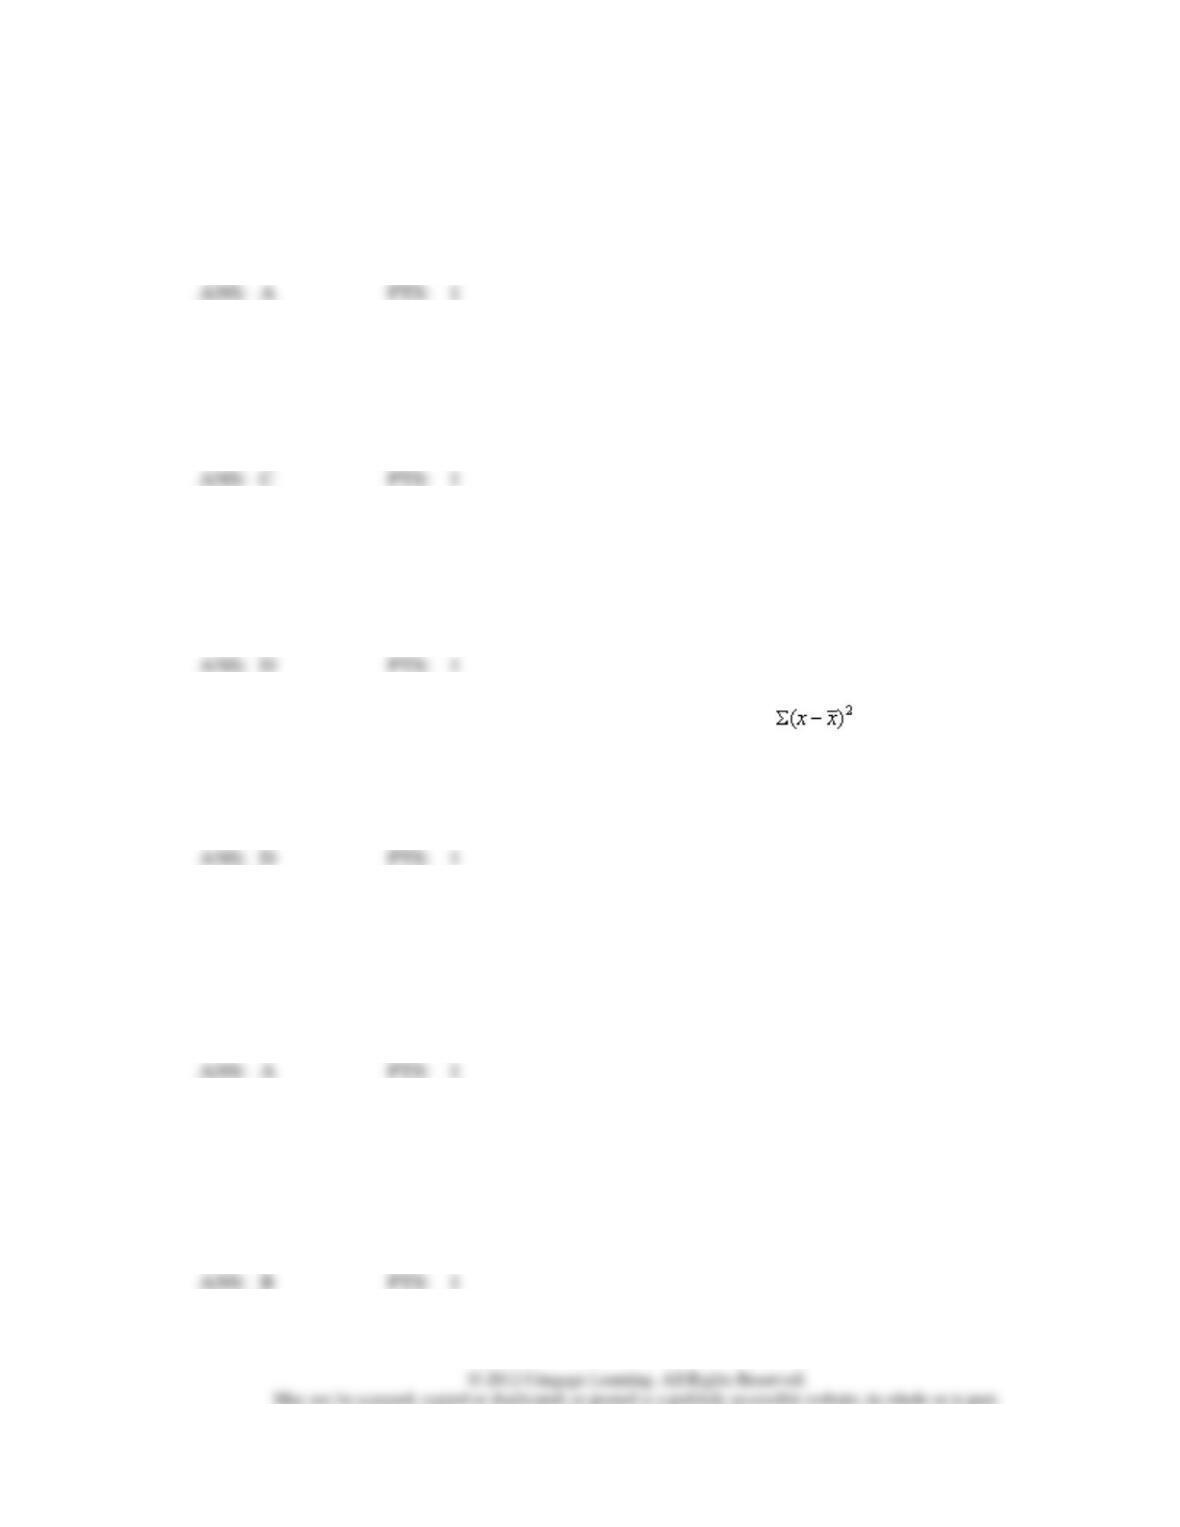
42. The value of the sum of the squared deviations from the mean, i.e., must always be
a.
less than the mean
b.
negative
c.
either positive or negative depending on whether the mean is negative or positive
d.
at least zero
43. If the variance of a data set is correctly computed with the formula using n − 1 in the denominator,
which of the following is true?
a.
the data set is a sample
b.
the data set is a population
c.
the data set could be either a sample or a population
d.
the data set is from a census
44. During a cold winter, the temperature stayed below zero for ten days (ranging from -20 to -5). The
variance of the temperatures of the ten day period
a.
is negative since all the numbers are negative
b.
must be at least zero
c.
can not be computed since all the numbers are negative
d.
can be either negative or positive
45. The variance of a sample of 81 observations equals 64. The standard deviation of the sample equals
a.
0
b.
4096
c.
8
d.
6,561
46. The standard deviation of a sample of 100 observations equals 64. The variance of the sample equals
a.
8
b.
10
c.
6,400
d.
4,096
47. The numerical value of the standard deviation can never be
a.
larger than the variance
b.
zero
c.
negative
d.
all of these statements are correct
48. Excel’s __________ function can be used to compute the sample variance.
a.
MAX
b.
MODE
c.
VAR.S
d.
STDEV
49. Excel’s __________ function can be used to compute the population variance.
a.
MAX
b.
MODE
c.
VAR
d.
None of the other answers are correct.
50. Excel’s __________ function can be used to compute the sample standard deviation.
a.
MAX
b.
MODE
c.
VAR
d.
STDEV.S
51. Excel’s __________ function can be used to compute the population standard deviation.
a.
MAX
b.
MODE
c.
STDEV
d.
None of the other answers are correct.
52. The coefficient of variation is
a.
the same as the variance
b.
the square root of the variance
c.
the square of the standard deviation
d.
None of the other answers are correct.
53. The weights (in pounds) of a sample of 36 individuals were recorded and the following statistics were
calculated
mean = 160
range = 60
mode = 165
variance = 324
median = 170
The coefficient of variation equals
a.
0.1125%
b.
11.25%
c.
203.12%
d.
0.20312%
54. Which of the following is a measure of dispersion?
a.
percentiles
b.
quartiles
c.
interquartile range
d.
all of these are measures of dispersion
55. Which of the following is not a measure of dispersion?
a.
the range
b.
the 50th percentile
c.
the standard deviation
d.
the interquartile range
56. The measure of dispersion that is influenced most by extreme values is
a.
the variance
b.
the standard deviation
c.
the range
d.
the interquartile range
57. The descriptive measure of dispersion that is based on the concept of a deviation about the mean is
a.
the range
b.
the interquartile range
c.
both the range and the interquartile range
d.
the standard deviation
58. If two groups of numbers have the same mean, then their
a.
standard deviations must also be equal
b.
medians must also be equal
c.
modes must also be equal
d.
None of the other answers are correct.
59. The descriptive measure that is not measured in the same units as the original data is the
a.
median
b.
standard deviation
c.
mode
d.
variance
60. Which of the following symbols represents the size of the population?
a.
2
b.
c.
d.
N
61. Which of the following symbols represents the size of the sample?
a.
2
b.
c.
N
d.
n
62. Which of the following symbols represents the mean of the population?
a.
2
b.
c.
d.
63. Which of the following symbols represents the mean of the sample?
a.
2
b.
c.
d.
64. Which of the following symbols represents the variance of the population?
a.
2
b.
c.
d.
65. The symbol
2 is used to represent the
a.
variance of the population
b.
standard deviation of the sample
c.
standard deviation of the population
d.
None of the other answers are correct.
66. Which of the following symbols represents the standard deviation of the population?
a.
2
b.
c.
d.
67. The symbol
is used to represent the
a.
variance of the population
b.
standard deviation of the sample
c.
standard deviation of the population
d.
None of the other answers are correct.
68. The __________ denotes the number of standard deviations xi is from the mean .
a.
range
b.
median
c.
z-score
d.
third quartile
69. A(n) __________ is an unusually small or unusually large data value.
a.
sample statistic
b.
median
c.
z-score
d.
outlier
70. __________ can be used to make statements about the proportion of data values that must be within a
specified number of standard deviations of the mean.
a.
Chebyshev’s theorem
b.
The empirical rule
c.
A five-number summary
d.
A box plot
71. __________ can be used to determine the percentage of data values that must be within one, two, and
three standard deviations of the mean for data having a bell-shaped distribution.
a.
Chebyshev’s theorem
b.
empirical rule
c.
five-number summary
d.
box plot
72. In a five-number summary, which of the following is not used for data summarization?
a.
the smallest value
b.
the largest value
c.
the median
d.
the mean
73. A graphical summary of data that is based on a five-number summary is a
a.
histogram
b.
stem-and-leaf display
c.
scatter diagram
d.
box plot
74. A numerical measure of linear association between two variables is the
a.
variance
b.
covariance
c.
standard deviation
d.
coefficient of variation
75. Positive values of covariance indicate
a.
a positive variance of the x values
b.
a positive variance of the y values
c.
the standard deviation is positive
d.
a positive relation between the x and the y variables
76. Excel’s __________ function can be used to compute the sample covariance.
a.
MAX
b.
COVARIANCE.S
c.
VAR
d.
CORREL
77. A numerical measure of linear association between two variables is the
a.
variance
b.
z-score
c.
correlation coefficient
d.
None of the other answers are correct.
78. The correlation coefficient ranges between
a.
0 and 1
b.
−1 and +1
c.
minus infinity and plus infinity
d.
1 and 100
79. The correlation coefficient
a.
is the same as the covariance
b.
can be larger than 1
c.
cannot be larger than 1
d.
cannot be negative
80. Excel’s __________ function can be used to compute the sample correlation coefficient.
a.
MAX
b.
COVAR
c.
VAR
d.
CORREL
81. A mean computed in such a way that each data value is given a weight reflecting its importance is
referred to as
a.
an important mean
b.
a trimmed mean
c.
a weighted mean
d.
a heavy mean
82. In computing descriptive statistics from grouped data,
a.
data values are treated as if they occur at the midpoint of a class
b.
the grouped data result is more accurate than the ungrouped result
c.
the grouped data computations are used only when a population is being analyzed
d.
All of these answers are correct.
83. When should measures of location and dispersion be computed from grouped data rather than from
individual data values?
a.
as much as possible since computations are easier
b.
only when individual data values are unavailable
c.
whenever computer packages for descriptive statistics are unavailable
d.
only when the data are from a population
84. An important numerical measure of the shape of a distribution is the
a.
correlation coefficient
b.
variance
c.
skewness
d.
relative location
85. If the data distribution is symmetric, the skewness is
a.
0
b.
.5
c.
1
d.
None of the other answers is correct.
86. For data skewed to the left, the skewness is
a.
between 0 and .5
b.
less than 1
c.
positive
d.
negative
87. When the data are positively skewed, the mean will usually be
a.
less than the median
b.
greater than the median
c.
less than the mode
d.
greater than the mode
Exhibit 3-1
A researcher has collected the following sample data.
5
12
6
8
5
6
7
5
12
4
88. Refer to Exhibit 3-1. The median is
a.
5
b.
6
c.
7
d.
8
89. Refer to Exhibit 3-1. The mode is
a.
5
b.
6
c.
7
d.
8
90. Refer to Exhibit 3-1. The mean is
a.
5
b.
6
c.
7
d.
8
91. Refer to Exhibit 3-1. The 75th percentile is
a.
5
b.
6
c.
7
d.
8
Exhibit 3-2
A researcher has collected the following sample data. The mean of the sample is 5.
3
5
12
3
2
92. Refer to Exhibit 3-2. The variance is
a.
80
b.
4.062
c.
13.2
d.
16.5
93. Refer to Exhibit 3-2. The standard deviation is
a.
8.944
b.
4.062
c.
13.2
d.
16.5
94. Refer to Exhibit 3-2. The coefficient of variation is
a.
72.66%
b.
81.24%